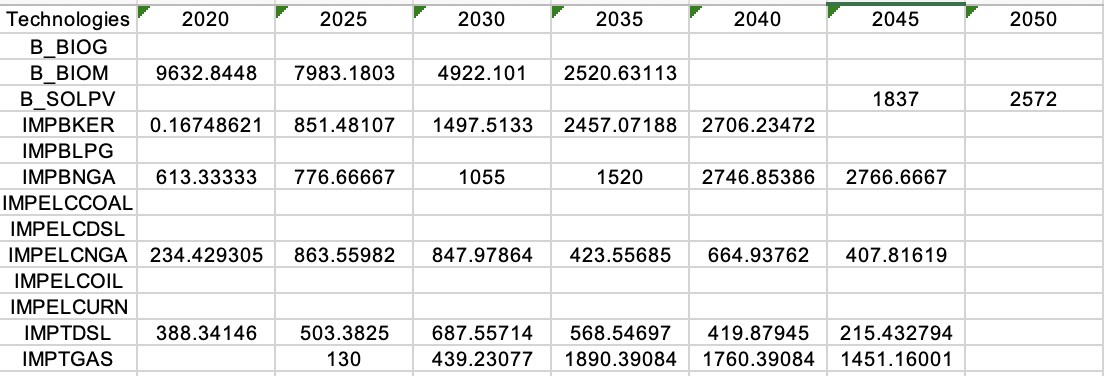
Trying to figure out why my capacity activity is declining when demand increases across the period
26 views
Skip to first unread message
Joan
Jan 12, 2022, 9:15:19 PM1/12/22
to Temoa Project
What could explain the reduction in capacity activity when the final demand increases across the analysis period? The activity increases for my end-use demand services so why is the supply going declining? What could I be missing?


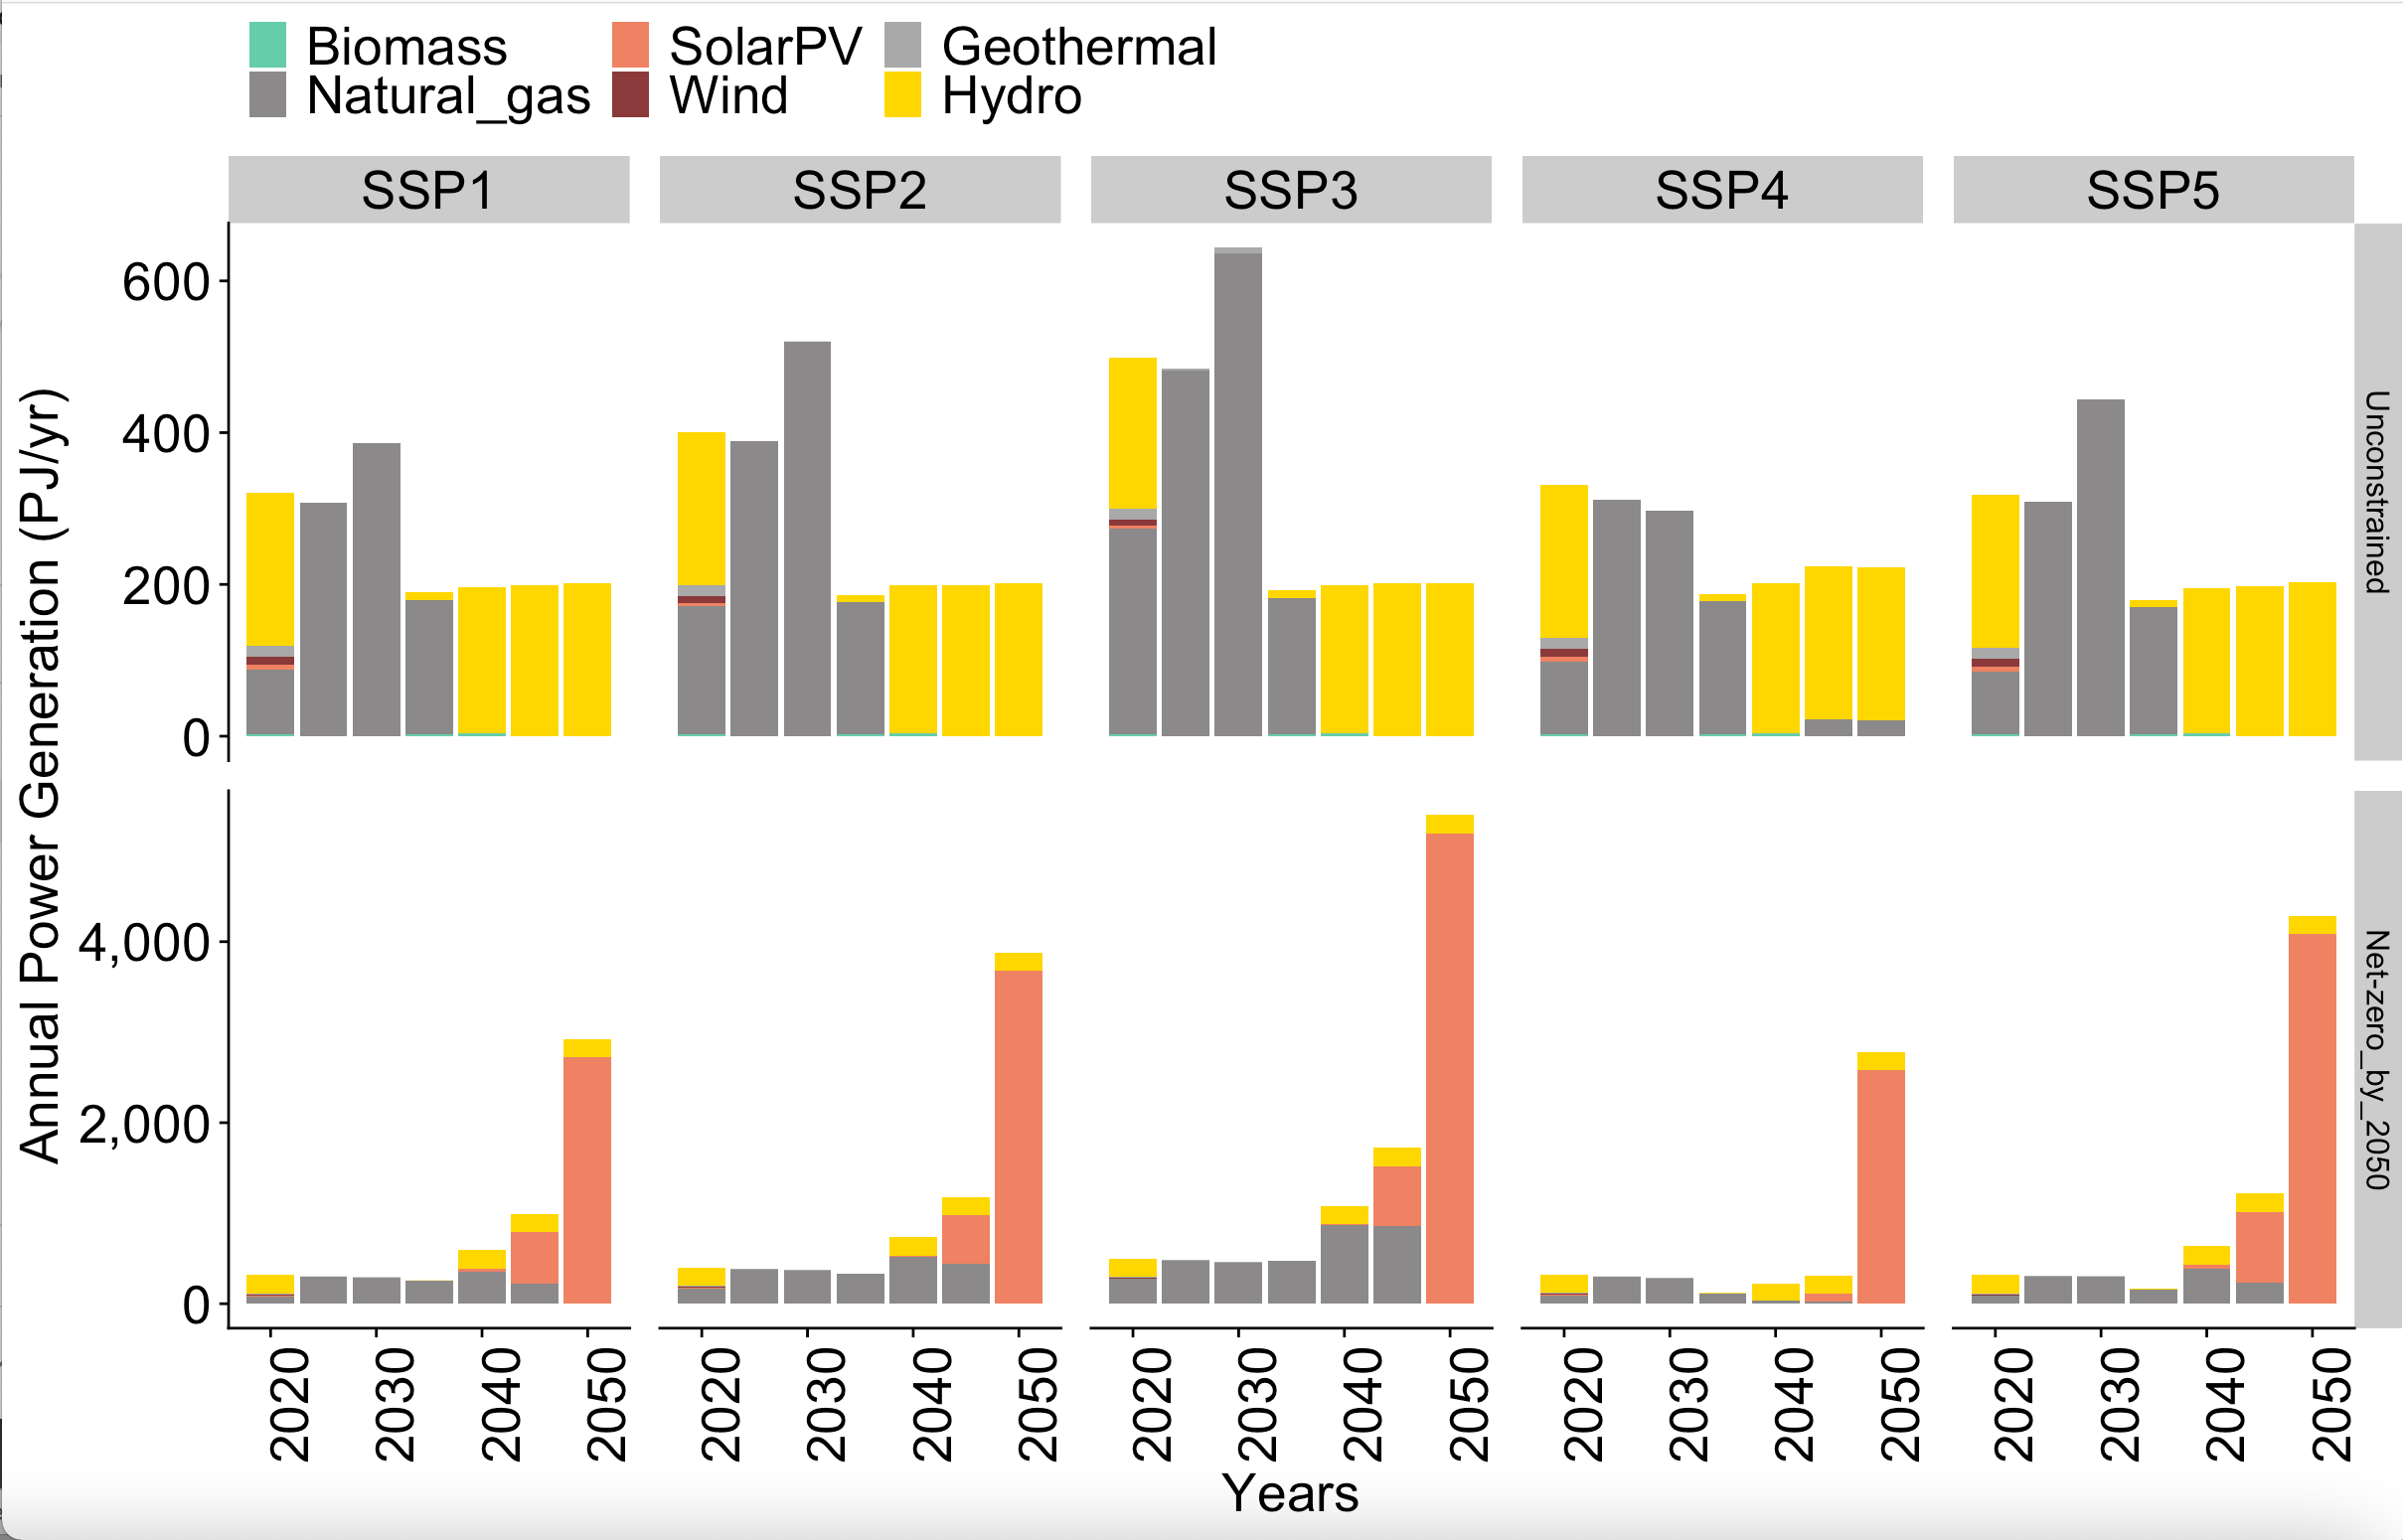
My power plots also have an odd shape and decline over time and yet the final demand is rising with each consecutive period

Any ideas why these look like this?
Thank you,
Joan
Joe
Jan 22, 2022, 9:28:16 AM1/22/22
to Temoa Project
Hi Joan,
Sorry for the slow reply. Are you modeling the whole energy system or just electricity for now? If the latter, I would expect the total activity to match across the two scenarios (unconstrained vs net zero), but only the relative mix of generation by technology type to change. Email me a copy of your database and I can have a look.
Best,
Joe
Reply all
Reply to author
Forward
0 new messages
