Query regarding snowy mountainous catchments
21 views
Skip to first unread message

Ignacio Fuentes
Nov 22, 2022, 9:23:11 AM11/22/22
to swat...@googlegroups.com
Hi all,I'm relatively new in SWAT and trying to calibrate a model in a snowy mountainous catchment in the southern hemisphere, where most rainfall occurs in winter but melting takes place in spring and summer. Here is a map of the catchment:
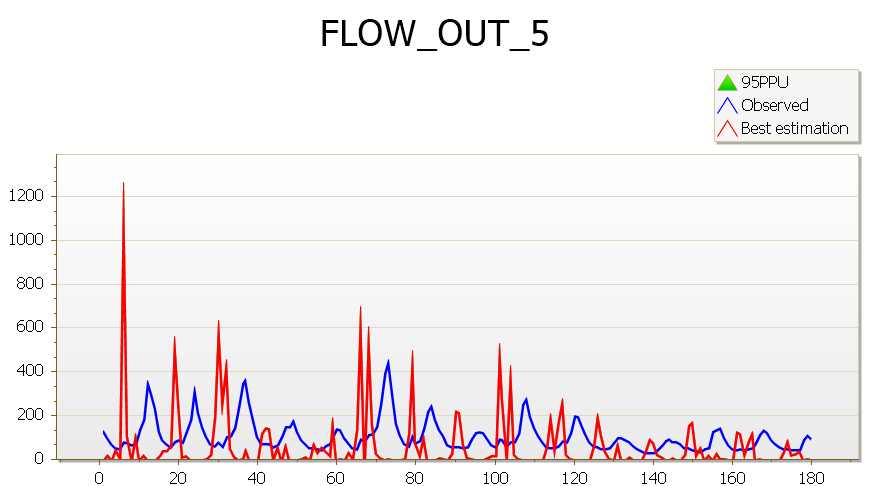
The initial iteration in the calibration shows the following plot (with r__WDPQ.sub 0-0), where simulation peaks occur in winter, while actual streamflow peaks occur in spring-summer even using elevation bands.
Then using v__PLAPS.sub________20-24 (-1000 to 1000) and v__TLAPS.sub________20-24(-10 to 10) constrained to the mountainous catchments, we got the following plot that mainly shows increases or decreases in the simulations, but doesn't seem to shift them in time: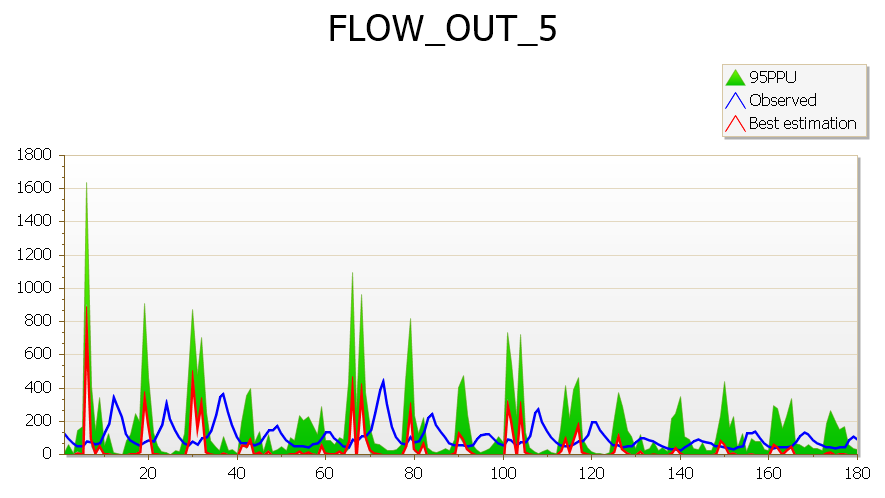
Then using the following snow parameters we got:v__SUB_SFTMP().sno________20-24 -5 5
v__SUB_SMTMP().sno________20-24 -5 5
v__SUB_SMFMX().sno________20-24 0 5
v__SUB_SMFMN().sno________20-24 0 5
v__SUB_TIMP().sno________20-24 0 1
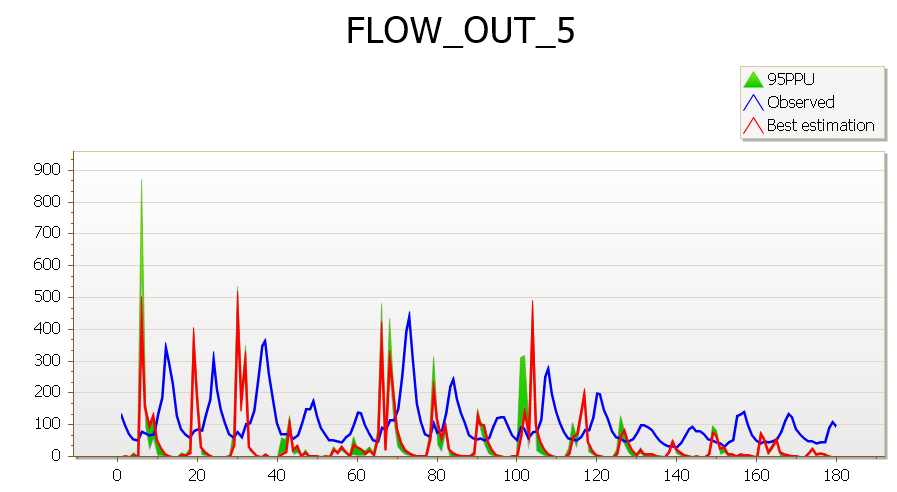
Clearly, we are missing an important factor that might shift the simulation some months forwards.Do you have any advice that may help me to cope with this issue?
Cheers
v__SUB_SFTMP().sno________20-24 -5 5
v__SUB_SMTMP().sno________20-24 -5 5
v__SUB_SMFMX().sno________20-24 0 5
v__SUB_SMFMN().sno________20-24 0 5
v__SUB_TIMP().sno________20-24 0 1
v__SUB_SMTMP().sno________20-24 -5 5
v__SUB_SMFMX().sno________20-24 0 5
v__SUB_SMFMN().sno________20-24 0 5
v__SUB_TIMP().sno________20-24 0 1
Clearly, we are missing an important factor that might shift the simulation some months forwards.
Do you have any advice that may help me to cope with this issue?
Cheers
Cheers

Willem Vervoort
Nov 22, 2022, 4:59:21 PM11/22/22
to swat...@googlegroups.com
Hi Ignacio,
I have no experience, but have you checked this paper: https://www.sciencedirect.com/science/article/pii/S0022169415008550
There is also this presentation which discusses the parameters: https://swat.tamu.edu/media/56950/h1-2-singh.pdf
Regards
Willem
--
You received this message because you are subscribed to the Google Groups "SWAT-CUP" group.
To unsubscribe from this group and stop receiving emails from it, send an email to swat-cup+u...@googlegroups.com.
To view this discussion on the web visit https://groups.google.com/d/msgid/swat-cup/CABHvOp%3DS%3Ds09O2Ov%2BwCGzu1PkgSyfXz0q2bhpLbcmPCsZ-bkig%40mail.gmail.com.

Salman Khan
Nov 24, 2022, 6:50:17 AM11/24/22
to swat...@googlegroups.com
Dear Fuentes,
Make sure you have improved your model in terms of elevation bands before fixing lapse rates and snow parameters.
Kind Regards
Salman
To view this discussion on the web visit https://groups.google.com/d/msgid/swat-cup/CAHJpk%3D%2BRFpd08TkbOoQhUud5yaq03S9gQz8mV02FnR%2BOFcLUiA%40mail.gmail.com.
Ignacio Fuentes
Nov 25, 2022, 8:28:12 AM11/25/22
to swat...@googlegroups.com
Thanks for the advice and the references.
I'm still getting similar results, but checking my temperature data, I've realised that most minimum temperatures below 0 degrees are characterised as nans in the input weather data, probably due to the range of measurements of the devices. I wonder if that might be a reason for such a bad representation of simulations even adding elevation bands.
Also, I checked out that adding elevation bands during the development of the model with Qgis gives similar results in the .sub files than if adding them later using the utility programs from swat-cup.
Anyway, I'll keep digging into the issue and if I have any good news I'll let you know.
Thanks again for the help.
Regards
To view this discussion on the web visit https://groups.google.com/d/msgid/swat-cup/CADMPsdS6yPr2SdgFmdktNGgxaqn4kuxJ34n0nKQm3sVfdk22Aw%40mail.gmail.com.
Reply all
Reply to author
Forward
0 new messages