Some questions about Tutorial 'Regional_Jet_Optimization'
50 views
Skip to first unread message

Haoliang Yu
Jan 19, 2023, 8:02:52 AM1/19/23
to SUAVE FORUM
Hi, I run the 'Regional_Jet_Optimization' tutorial case.( SUAVE version==2.5.2)
40~VFH6K.png?part=0.4&view=1)

![LYVAVRZSRT%20$OMX])8XV.png](https://groups.google.com/group/suave-forum/attach/5333a049a6e00/LYVAVRZSRT%2520$OMX%5D)8%60XV.png?part=0.2&view=1)
But there are some results different from the tutorial in SUAVE website.
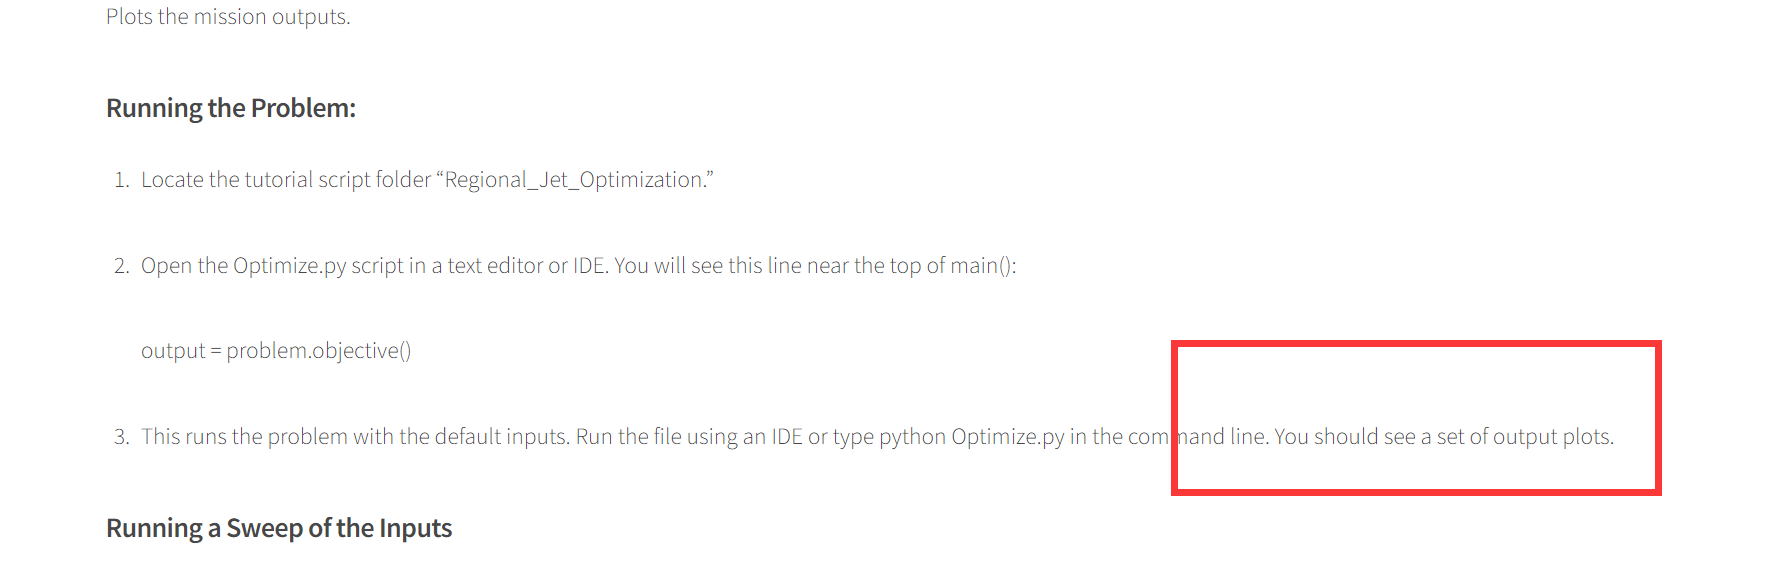
Firstly, when I run this way, there are no plots.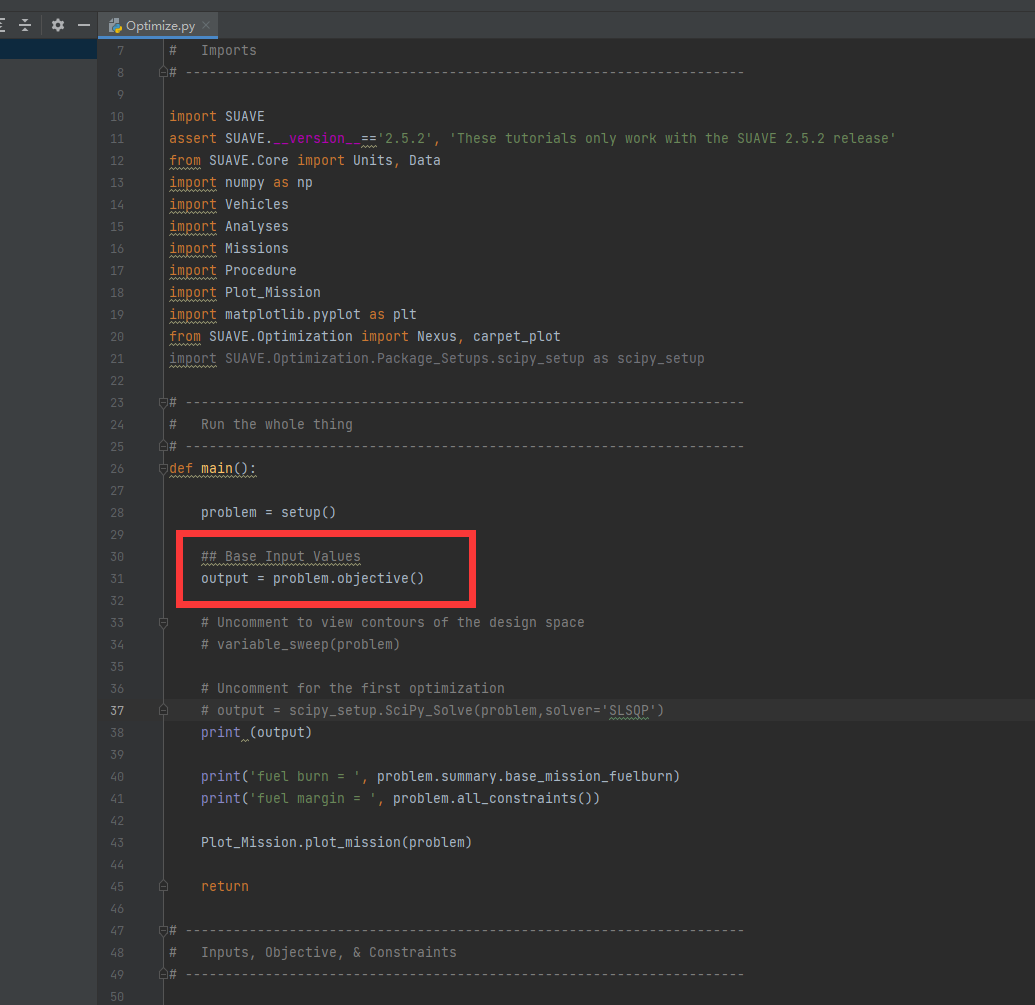
But the Tutorial said that:'You should see a set of output plots.'
but there is nothing, but only like this, no plots.
and when I run the third case. using SLSQP opt.There also results "result.txt" in the file folder.But no plots.
And there is also a question for the second case. the result as follows:
Left is the result by run the script.
Right is tutorial case figure.
I think the valne of 'fuel margin' should be larger in the blue area, not like the left one.
So are there somethings wrong?
Mank thanks,
Knight.

Emilio
Feb 19, 2023, 8:43:11 PM2/19/23
to SUAVE FORUM
Hi,
I just ran this and got the same contour plots you got. I think this tutorial needs some updating. We're close to a new release anyways.
We're also making new plots to go along with this.
-Emilio
Reply all
Reply to author
Forward
0 new messages