Plotting and combining raster maps of wolfAlps module
53 views
Skip to first unread message

claram...@googlemail.com
Nov 12, 2020, 5:01:56 AM11/12/20
to SpaDES Users
Hi everyone,
I've been having some problems with the plotting of raster maps output from the wolfAlps module and would be very grateful for any advice.
I wanted to do something similar to what is described in the chapter Summaries of the wolfAlps html page:
https://htmlpreview.github.io/?https://github.com/PredictiveEcology/wolfAlps/blob/master/wolfAlps.html
Except I didn't do the replicates with experiment but with foreach(..) %dopar% {spades(..)}. And I want to include some border lines of regions (or maybe even some major cities or rivers) to make it easier to see where things are exactly.
My problem is that the rasters suitabilityRaster and TerritoryProb (which is the mean over replicates of out_terr) don't contain information about extent and projection, so I don't know how to combine the plots with country borders or other geographic data. I don't know if the problem is that I started with input maps without projections - but I think it isn't part of the wolfAlps program. And it shouldn't really be necessary during the simulation, either, but I definitely need it now for the analysis. I tried assigning the extent and projection from the borders to the extent of the rasters, but that didn't help.
I tried to do it with the SpaDES function Plot or with generic plot, but neither really worked for me. This is my "best" option:
library(SpaDES)
library(NetLogoR)
library(quickPlot)
library(raster)
library(maptools)
library(maps)
library(mapdata)
library(ggmap)
Borders <- getData('GADM', country="DEU", level=1) #level 0: border of Germany, level 1: border of regions.
Borders
TerritoryProb1[[1]] # this is my data, mean over many replicates of out_terr
r <- TerritoryProb1[[1]]
r[r==0]<-NA #replace zero with NA to make transparency easier
projection(r) <- "+proj=longlat +datum=WGS84 +no_defs"
#extent are not the same:
extent(r)
extent(Borders)
#change extent for r
extent(r) <- extent(Borders)
habitatmap <- Versuch2A[[1]][["suitabilityRaster"]] #this is the suitabiliy raster, comes directly from input
extent(habitatmap) <- extent(Borders)
projection(habitatmap) <- "+proj=longlat +datum=WGS84 +no_defs"
plot(Borders, border = "red", col= "transparent");par(new=TRUE)
plot(habitatmap, col = grey.colors(20, start=0, end=1));par(new=TRUE)
plot(r)
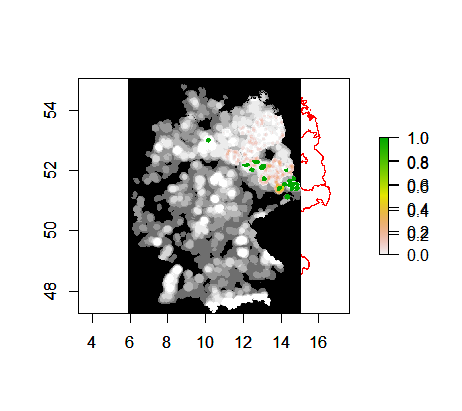
As you can see the result is kind of horrible. Another problem is that the legends are plotted one on top of the other.. I think I have completely the wrong idea of how to solve this issue, so any suggestions are welcome.
Please write if it isn't clear what I mean :)
Cheers, Clara
I've been having some problems with the plotting of raster maps output from the wolfAlps module and would be very grateful for any advice.
I wanted to do something similar to what is described in the chapter Summaries of the wolfAlps html page:
https://htmlpreview.github.io/?https://github.com/PredictiveEcology/wolfAlps/blob/master/wolfAlps.html
Except I didn't do the replicates with experiment but with foreach(..) %dopar% {spades(..)}. And I want to include some border lines of regions (or maybe even some major cities or rivers) to make it easier to see where things are exactly.
My problem is that the rasters suitabilityRaster and TerritoryProb (which is the mean over replicates of out_terr) don't contain information about extent and projection, so I don't know how to combine the plots with country borders or other geographic data. I don't know if the problem is that I started with input maps without projections - but I think it isn't part of the wolfAlps program. And it shouldn't really be necessary during the simulation, either, but I definitely need it now for the analysis. I tried assigning the extent and projection from the borders to the extent of the rasters, but that didn't help.
I tried to do it with the SpaDES function Plot or with generic plot, but neither really worked for me. This is my "best" option:
library(SpaDES)
library(NetLogoR)
library(quickPlot)
library(raster)
library(maptools)
library(maps)
library(mapdata)
library(ggmap)
Borders <- getData('GADM', country="DEU", level=1) #level 0: border of Germany, level 1: border of regions.
Borders
TerritoryProb1[[1]] # this is my data, mean over many replicates of out_terr
r <- TerritoryProb1[[1]]
r[r==0]<-NA #replace zero with NA to make transparency easier
projection(r) <- "+proj=longlat +datum=WGS84 +no_defs"
#extent are not the same:
extent(r)
extent(Borders)
#change extent for r
extent(r) <- extent(Borders)
habitatmap <- Versuch2A[[1]][["suitabilityRaster"]] #this is the suitabiliy raster, comes directly from input
extent(habitatmap) <- extent(Borders)
projection(habitatmap) <- "+proj=longlat +datum=WGS84 +no_defs"
plot(Borders, border = "red", col= "transparent");par(new=TRUE)
plot(habitatmap, col = grey.colors(20, start=0, end=1));par(new=TRUE)
plot(r)
Please write if it isn't clear what I mean :)
Cheers, Clara

Alex Chubaty
Nov 12, 2020, 1:19:13 PM11/12/20
to SpaDES Users
Hi Clara,
It's hard to pinpoint what's wrong without a speroducible example, but a few things I noticed about your approach need to be checked.
When you try to change the extent or projection of a spatial object on raster like this, you are simply overwriting metadata, instead of actually changing the underlying spatial layer. To change extent, you should `crop`; to change projection you should `projectRaster` or equivalent.
Plot the raster first, then plot the administrative boundaries overtop. Something like:
plot(habitatmap, col = grey.colors(20, start=0, end=1))
plot(r, add = TRUE)
plot(Borders, border = "red", col= "transparent", add = TRUE)
Just make sure the extent of the first object plotted will encompass the others.
Alex
claram...@googlemail.com
Nov 23, 2020, 8:02:47 AM11/23/20
to SpaDES Users
Hi Alex,
thank you so much for your answer! The part about plot with add=TRUE helped a lot - don't know why I didn't do it like that, especially since I had something similar in a previous attempt. I also managed to solve the problem with the overlapping legends:
plot(habitatmap, col = grey.colors(60, start=0, end=1), legend=FALSE, axes=FALSE)
plot(habitatmap, legend.only=TRUE, col = grey.colors(60, start=0, end=1),
horizontal=TRUE,
legend.args=list(text='Habitat Suitability', side=1, font=2, line=2.5, cex=0.8),
)
plot(r, legend=FALSE, axes=FALSE, add = TRUE)
plot(r, legend.only=TRUE, # colours work
horizontal=FALSE,
legend.args=list(text='Probability for Territory Presence', side=4, font=2, line=2.5, cex=0.8),
)
Unfortunately, I am still completely lost when it comes to extent and projection. Basically, I want to combine two objects, a SpatialPolygonsDataFrame and a RasterLayer. They look like this:
>Borders
class : SpatialPolygonsDataFrame
features : 16
extent : 5.866251, 15.04181, 47.27012, 55.05653 (xmin, xmax, ymin, ymax)
crs : +proj=longlat +datum=WGS84 +no_defs
variables : 10
names : GID_0, NAME_0, GID_1, NAME_1, VARNAME_1, NL_NAME_1, TYPE_1, ENGTYPE_1, CC_1, HASC_1
min values : DEU, Germany, DEU.1_1, Baden-Württemberg, Bavaria, NA, Freie Hansestadt, State, 01, DE.BE
max values : DEU, Germany, DEU.9_1, Thüringen, Thuringia, NA, Land, State, 16, DE.TH
> TerritoryProb1[[4]] # this is my data, mean over many replicates of out_terr
class : RasterLayer
dimensions : 867, 643, 557481 (nrow, ncol, ncell)
resolution : 1, 1 (x, y)
extent : 0.5, 643.5, 0.5, 867.5 (xmin, xmax, ymin, ymax)
crs : NA
source : memory
names : Year2026
values : 0, 1 (min, max)
Since my RasterLayer doesn't have a projection (or does it?) I guess I would need to project it somehow. While making sure that the projection fits the one of the SpatialPolygonsDataFrame. In the original ascii files I have extra information:
xllcorner 3279642.6028546
yllcorner 5237006.2964934
Do you think there is an easy way, preferably without using ArcGIS, to get extent and projection from this? Because if not, I think I will just give up on the borders and count on people's imagination of the country's geography..
And I am sorry about not including a reproducible example, I don't know how I could do that without uploading way too much data..
Cheers, Clara
Reply all
Reply to author
Forward
Message has been deleted
0 new messages