
Paul Schoolden
Hi, I'm moving this from the GitHub as I accidentally posted it in the Sonar Lint Issues as was hoping that someone may have some insight.
Description
We have been using dotCover which feeds into our Sonar Analysis for a little while without issue. To help resolve an issue we had with Sonar Lint we updated the the Sonar C# plugin last week to version 6.6. Immediatley after this update our code coverage metrics drastically changed. We did have coverage of 93% which then dropped to 73%. We utilize a dot cover configuration xml file to detail any module and class filter masks, as there is a reasonable amount of configuration classes or data access classes which are not covered by unit tests we need to filter these types out to not affect the actual coverage metric. On face value it appears that a lot of our filters are no longer always being taken into consideration in Sonar,where as in the past they always were and missing coverage for the filtered types was not reported.
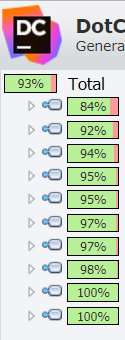
As a first step I looked at the outputted dotCover HTML report (the file fed into Sonar) and it was detailing the same coverage as we were expecting (93% overall) and was not reporting classes that had been masked in the configuration file. I then tried a different version of dotCover, we were using 2017.1.3 on the build agent which was upgraded to 2017.2.2 which does generate a sligtly different report but the result in Sonar was the same, 73% opposed to the 93% shown in the dot cover report.
The image below shows the html report outputted by dotCover:
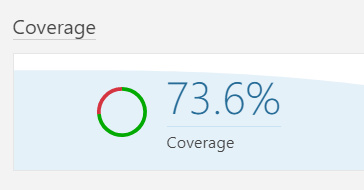
The image below shows the coverage stat in Sonar:
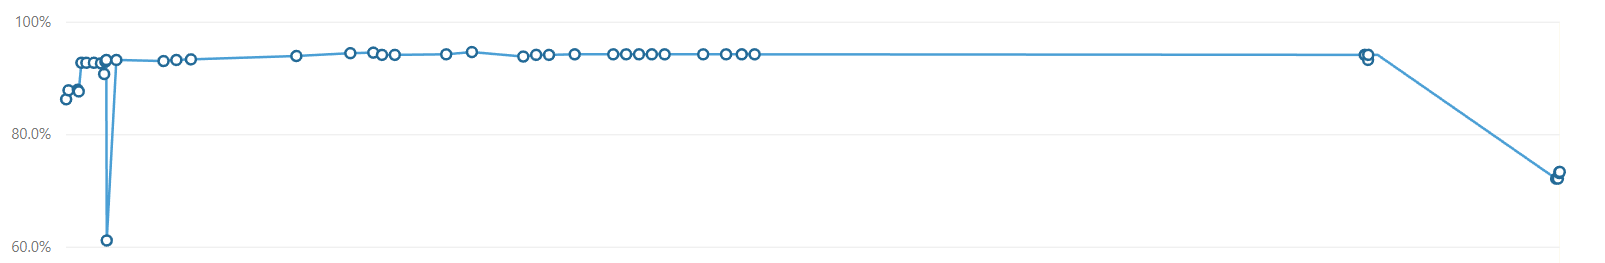
The image below shows our test coverage history in Sonar, as you can see, apart from a dip caused by a bad check in, after we configured our class masks our coverage stat was quite high and stable until the final analysis which is the date that we updated the plugin. This may be unrelated as there was around two weeks where that code base had not been worked on and analysed but it seems coincidental that it occurred the day that the plugin was updated along with fact that the coverage report from dot cover seems the same as before.
Repro steps
Run dotCover as part of the analysis and feed the output HTML report into Sonar.
Expected behavior
The test coverage metrics match the output of the dotCover report.
Actual behavior
The coverage metrics differ to the output of dotCover with missing coverage detailed for classes excluded by dot cover in the dot cover configuration file.
Known workarounds
None known.
Related information
VS 2017 - V15.2,
Sonar Lint V3.7.0.2645
Sonar Qube V6.4.0.25310.
Sonar C# Plugin V6.6
Tested with same results using dotCover:
dotCover V2017.1.3
dotCover V2017.2.2
Thanks
Paul

G. Ann Campbell
Paul Schoolden
Hi Ann,
Many thanks for your reply, it is greatly appreciated. It’s not a surprise to me, I had wondered if Sonar was doing some kind of intersect on the coverage results from dotCover with what it had deemed as executable lines of code. Apologies, I should have read the documentation in depth to understand that this was actually the case. Whilst I think I can understand the value of this feature, sadly, this is not desired functionality for us.
What we are trying to achieve is to have friction-less analysis with local and server results to match as closely as possible. The reason we are using Sonar Lint is so that if an engineer writes some code which is deemed as a code smell they have immediate feedback which will match the build server’s analysis. One reason that we have not yet fully embraced Sonar is that we were waiting for an upgrade to Sonar Lint for it to sync with resolved issues so that the code smells reported by Sonar Qube and Sonar Lint matched one to one. We have been able to mostly achieve the concept with test coverage up to now. Before an engineer commits code we want them to have the option to run dotCover to see if they have impacted test coverage and we wanted that to match any server analysis. To achieve that with dotCover we used the xml config file which is used by the console runner locally and the console runner on the server.
We wanted to use dotCover in the IDE but sadly it did not use the xml file for coverage exclusions as it uses its own settings file instead which cannot be used by the console runner. We did not want to have to maintain multiple places for exclusions as this increases possible drift and friction for the developers which will ultimately lead to apathy to the tooling and process. We have used a Sonar analysis exclusion on a module that is both non-test and non-production code but this is definitely the exception and not the rule. I really want to avoid having to manage exclusions in dotCover and in Sonar, especially as this aspect was working perfectly for us until we upgraded the Sonar Plugin, in the past if dotCover reported 0% coverage for a type then the Sonar 65% coverage rule was reported to the team until that was either covered or the dotCover configuration file was amended. I’m not sure if I am missing something?
Hope that all makes sense.
Many Thanks
Paul

devesh.a...@gmail.com
Paul Schoolden
Paul Schoolden
On Thursday, November 30, 2017 at 2:01:32 PM UTC, G. Ann Campbell wrote:

michal....@sonarsource.com
An option more convenient than maintaining two lists is to mark the code you don't want to cover with ExcludeFromCodeCoverage attribute. That gets you consistent results across the board:
- Code on SonarQube won't be marked as uncovered.
- dotCover in the IDE understands this attribute with no extra configuration (as you pointed out, this does not seem configurable anyway)
- dotCover command line runner won't report it as uncovered either (although you need to manually configure exclusion filter for that attribute)
Thanks,
Michal

Wilhelm S. Teinitz
Paul Schoolden
1. We agreed to avoid littering our code with attributes. This is not a big issues but we did all agree that this was something we would avoid, some people were more vocal than others but ultimately we agreed to use dotCover exclusions as it kept this concern out of our code and in the actual code coverage tool of our choice. This is a subjective opinion and choice, not every will agree but ultimately it was our decision and we do not really want to be forced to revert this decision simply because we upgraded a tool to a new version.
To view this discussion on the web visit https://groups.google.com/d/msgid/sonarqube/cb2f3cab-5130-4d0f-8a50-f7b2e4bbdeaf%40googlegroups.com.--
You received this message because you are subscribed to a topic in the Google Groups "SonarQube" group.
To unsubscribe from this topic, visit https://groups.google.com/d/topic/sonarqube/lz9lz3jVWyE/unsubscribe.
To unsubscribe from this group and all its topics, send an email to sonarqube+unsubscribe@googlegroups.com.
michal....@sonarsource.com
We had a long internal discussion, weighted the solutions and decided not to change the current model.
The executable lines metric should be calculated for all plugins. We at SonarSource do not want to provide a way to opt-out of that.
We considered options such as parsing the exclusions file and applying the exclusions ourselves. However, current scanning pipeline makes that change quite hard, because our exclusions are file-based, but the dotCover exclusions format is code syntax-based (attributes/classes/namespaces) rather than file based, and as you know the two aren't always the same thing. Trying to translate would require quite a lot of work. We feel that time can be spent better on providing value in other areas.
To recap, there are two ways to exclude code from coverage:
- Use ExcludeFromCodeCoverage attribute.
- Specify exclusion list in SonarQube UI (file path-based exclusions).
Thank you for raising this feedback. Even though the solution may not be what you'd ideally want, we are listening.
The way the metrics are calculated probably wouldn't be much of an issue if it was done from the start and not introduced without warning. We apologize for not communicating it clearly. We will put more effort to avoid similar problems in the future.
Thanks,
Michal
To unsubscribe from this group and all its topics, send an email to sonarqube+...@googlegroups.com.
