Refering back to MS spectrum
25 views
Skip to first unread message

Sean Davidson
Nov 27, 2019, 11:36:41 AM11/27/19
to SIM-XL Group
Diogo,
I would like to be able to select a cross-link hit from the dynamic result report and see the actual MS spectrum. How can I do that? Also, I am having trouble determining what the XIC value means. Is this a true MS1 extracted ion chromatogram across the whole column run or is this number just generated from the individual scan number? I am trying to figure out a way to get an intensity value for ranking the abundance of different cross-links. Thanks Sean

Diogo Borges
Dec 2, 2019, 11:45:12 AM12/2/19
to SIM-XL
Dear Sean,
Sorry for the late reply, but I was traveling.
So, the current version of SIM-XL is able to access the MS1 of an identified cross-linked peptide if the quantitation was performed.
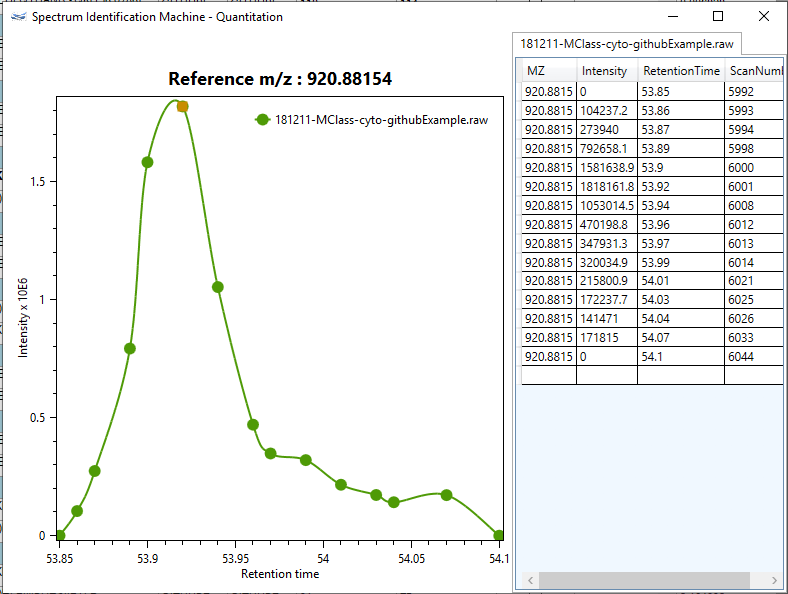
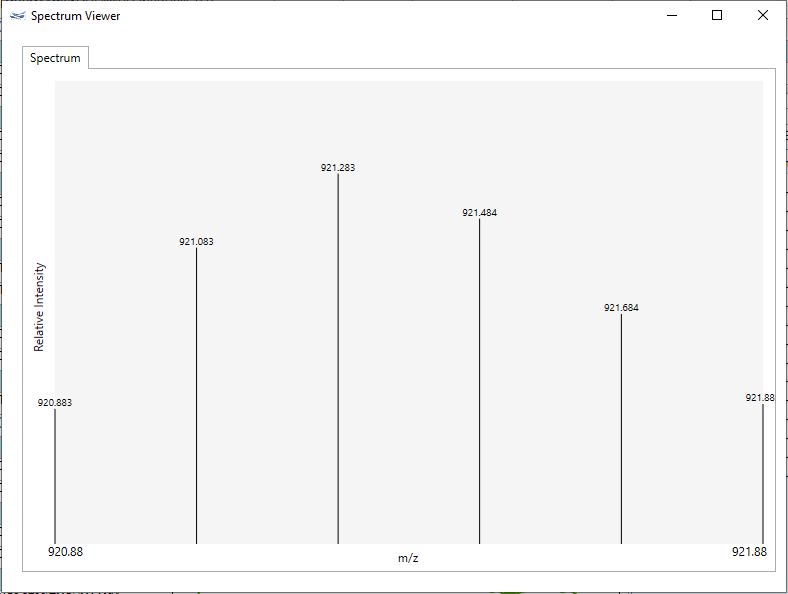
Well, for that you can double-click on a specific XIC value. A new window will be opened, showing the XIC curve (as you can see in the attached figure1), and then you can click on the yellow dot. The MS1 will be automatically plotted (figure 2), actually, the isotopic envelope that references the cross-linking identification.
Well, for that you can double-click on a specific XIC value. A new window will be opened, showing the XIC curve (as you can see in the attached figure1), and then you can click on the yellow dot. The MS1 will be automatically plotted (figure 2), actually, the isotopic envelope that references the cross-linking identification.
The XIC value means the area under the curve based on a specific m/z (according to the precursor mass of the identified cross-linked peptide - represented by yellow dot) and retention time. So, as you can see in the figure 1, all scan numbers that contain the same precursor mass and are in a range of retention time are shown. In addition, SIM-XL shows to you an absolute value, that is exactly the area under the curve; and a normalized value, which means the area under the curve divided by total ion chromatogram value.
If you have any doubts, email us.
Cheers,
Diogo
Figure 1:
Figure 2:
Le mer. 27 nov. 2019 à 17:36, Sean Davidson <bird...@gmail.com> a écrit :
Diogo,I would like to be able to select a cross-link hit from the dynamic result report and see the actual MS spectrum. How can I do that? Also, I am having trouble determining what the XIC value means. Is this a true MS1 extracted ion chromatogram across the whole column run or is this number just generated from the individual scan number? I am trying to figure out a way to get an intensity value for ranking the abundance of different cross-links. Thanks Sean
--
You received this message because you are subscribed to the Google Groups "SIM-XL Group" group.
To unsubscribe from this group and stop receiving emails from it, send an email to simxl+un...@googlegroups.com.
To view this discussion on the web visit https://groups.google.com/d/msgid/simxl/d1f8f9e9-363a-4f00-aea8-7f08163dee22%40googlegroups.com.
Reply all
Reply to author
Forward
0 new messages