[SIM-XL] New version 1.5.1.1
24 views
Skip to first unread message

Diogo Borges
Jun 25, 2018, 4:55:28 AM6/25/18
to SIM-XL
Dear all,
We've released a new version of SIM-XL (v.1.5.1.1).
Please update your current version or download at http://patternlabforproteomics.org/sim-xl.
To update your current version, click on Help menu -> Check for updates.
We've released a new version of SIM-XL (v.1.5.1.1).
Please update your current version or download at http://patternlabforproteomics.org/sim-xl.
To update your current version, click on Help menu -> Check for updates.
We are fulfilling suggestions of some users, and we are working to turn SIM-XL more robust and sensitive. Continue giving us your feedback about our search engine.
The release notes are:
Version 1.5.1.1
June 25th, 2018
- Bug-fixed: The fusion method was optimized for files of older versions.
- Bug-fixed: The protein identification and quantitation features were optimized.
- Bug-fixed: The export method for TopoLink was reorganized.
- (NEW) Result Browser: Species Count - The results can be filtered by species count.
- (NEW) Result Browser: Protein Domain - The user can specify a domain for each identified protein according to some parameters: protein region, name, and color. For it, the user needs to go to Utils menu -> Protein Domain (or pressing ALT + D), as shown in Figure 1.
A new window will be opened (Figure 2); a ProteinID, a range of the protein domain, a name, and a color need to be filled.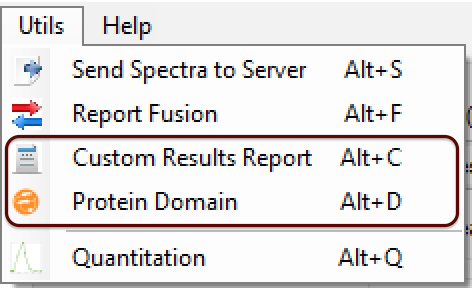
Figure 1
After that, a new 2D map will be plotted, as can be shown in Figure 3. When the user mouse over the domain, its name is shown.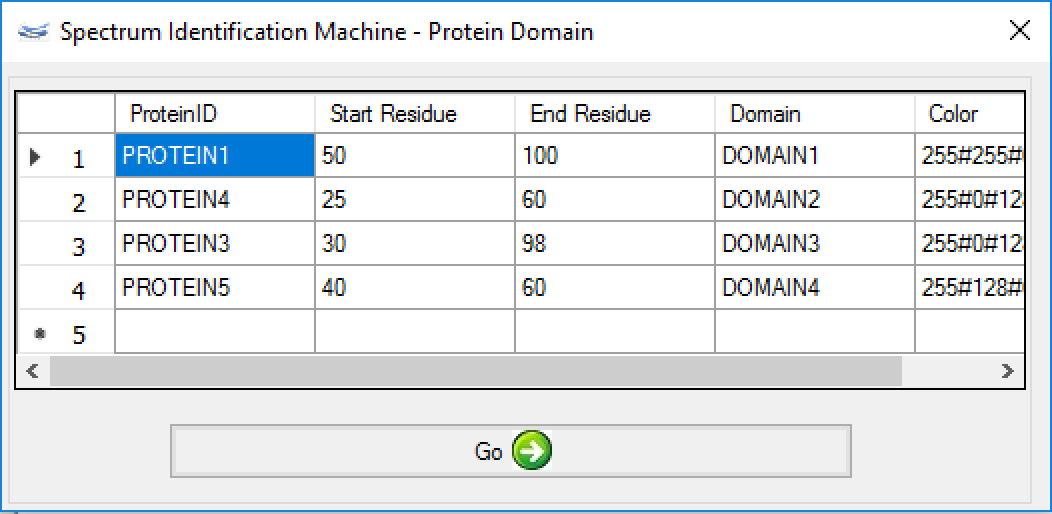
Figure 2 - (NEW) Result Browser: Cross-linker color change - Now, it's possible to change the intralink color for each cross-linker. For it, the user needs to go to Utils menu -> Custom Results Report (or pressing ALT + C) and (Figure 1) changes the Color field (Figure 4).
After to choose the color, press the 'OK' button. A new 2D map will be plotted with the new colors (Figure 5).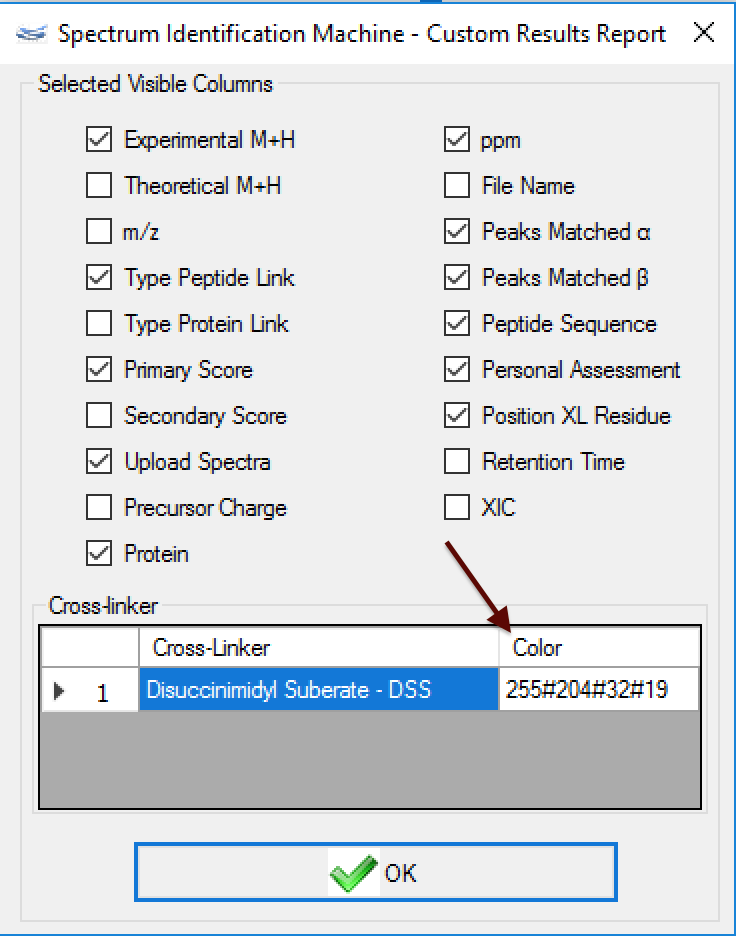
Figure 4
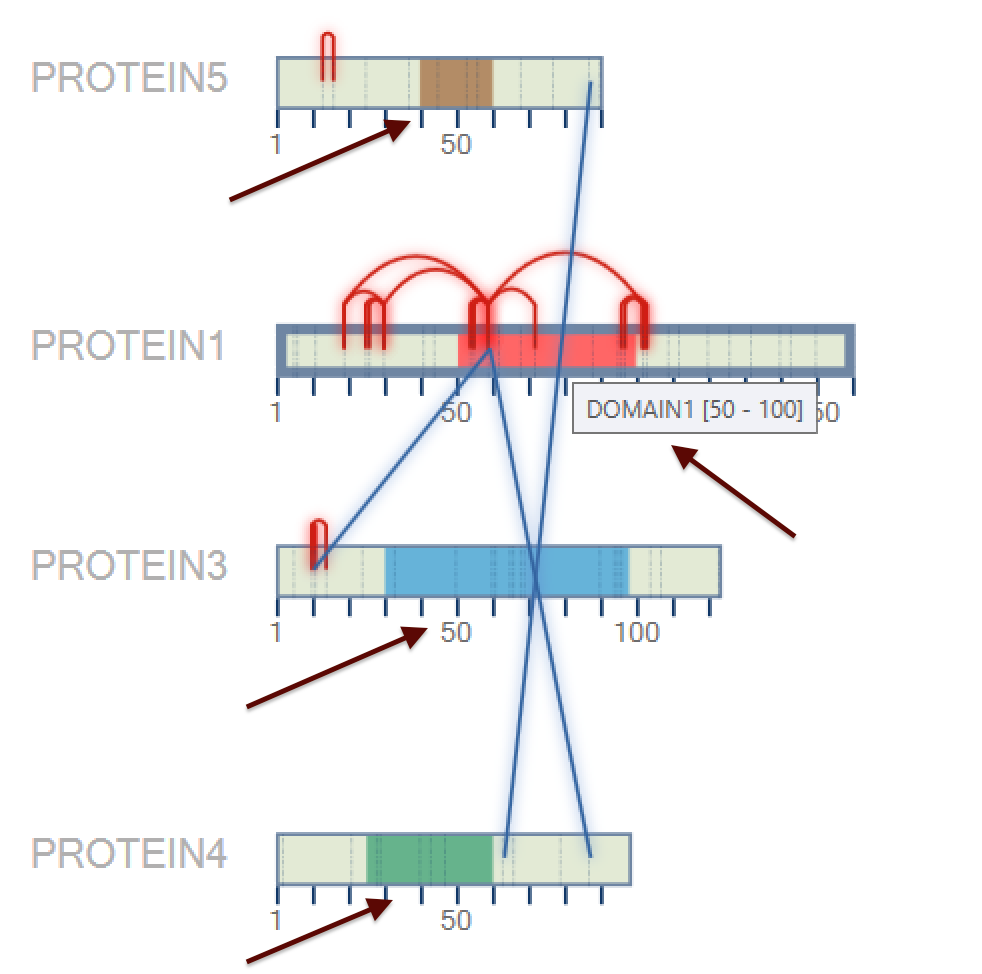
Figure 3
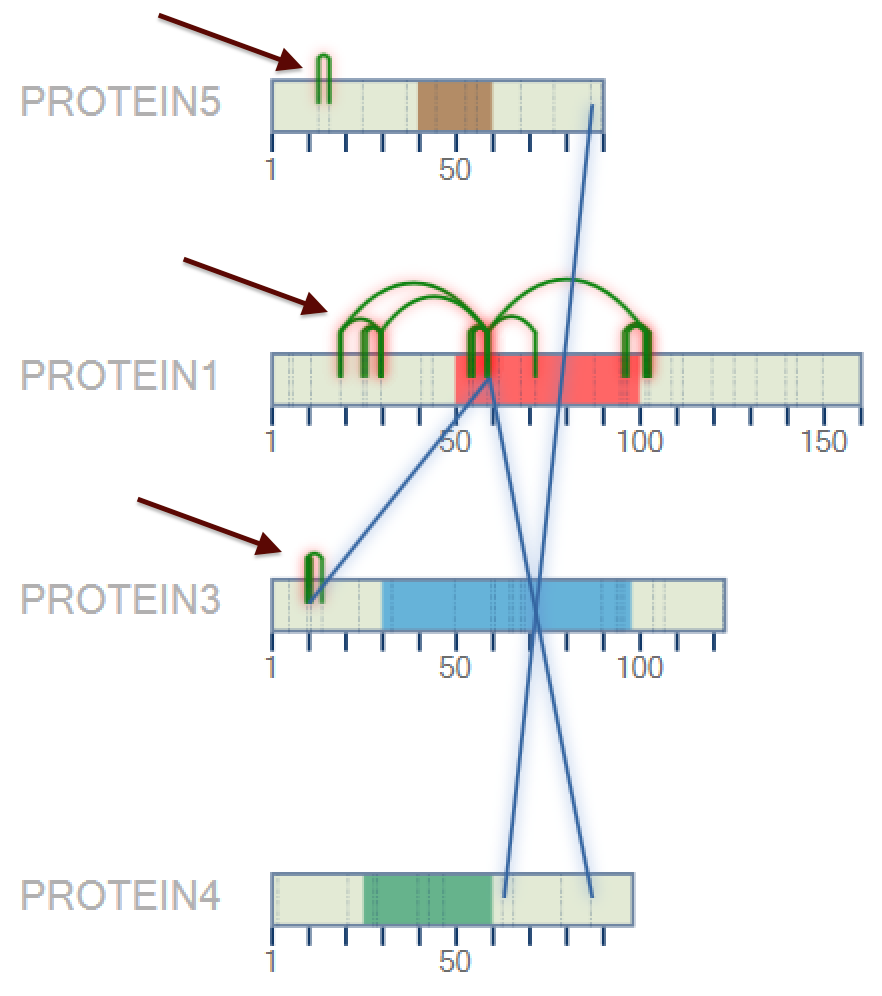
Figure 5
You can visit our webpage to visualize other notes.
Should you have any question, please email us.
Best regards,
Developer Team
Reply all
Reply to author
Forward
0 new messages