Using Shiny to plot plotly and non-plotly plots in the same app
1,373 views
Skip to first unread message

dividor
Jan 26, 2016, 11:55:17 AM1/26/16
to Shiny - Web Framework for R
Hi There,
I have shiny working nicely with some plotly plots, where the user chooses a plot type via a drop-down and a lovely plotly plot is created. However, though most of my plots use plotly and work perfectly, there is one which uses wordcloud.R which doesn't work.
My ui.R (below) is using plotlyOutput, so I can understand why any other plot types won't work. My non-plotly plots work perfectly if using plotOutput.
Is there a way I might be able to mix plotly and non-plotly type plots?
thanks.
ui.R
library(shiny)library(plotly)
shinyUI(fluidPage(  titlePanel("Help Library Analysis"),  sidebarPanel(    selectInput("plot_type", "Plot Type:",                c("Page views by ION area" = "ua_views_by_area",                  "Legacy Content Age vs. UA Page Views" = "ua_age_access",                  "Site Voumes by Time" = "ua_vols_time_series"                  )),    dateRangeInput("dates",                    "Date range",                   start = "2015-12-01",                    end = as.character(Sys.Date()))  ),  mainPanel(    plotlyOutput("trendPlot")   )))
server.R
library(shiny)library(plotly)source("helpers.R")
shinyServer(function(input, output) {    output$trendPlot <- renderPlotly({        switch(input$plot_type,           ua_views_by_area = ua_views_by_area(input$dates[1],input$dates[2]),              ua_age_access = ua_age_access(input$dates[1],input$dates[2]),           ua_vols_time_series = ua_vols_time_series(input$dates[1],input$dates[2])    )      })})
Joe Cheng
Jan 26, 2016, 12:59:29 PM1/26/16
to dividor, Shiny - Web Framework for R
You'd have to have two different elements, one plotOutput and one plotlyOutput. In your ui.R:
conditionalPanel("output.plot",
plotOutput("plot")
),
conditionalPanel("output.plotly",
plotlyOutput("plotly")
),
In your server.R (assuming ua_vols_time_series is the non-plotly one):
output$plot <- renderPlot({
switch(input$plot_type,
ua_vols_time_series = ua_vols_time_series(input$dates[1],input$dates[2]),
req(FALSE)
)
})
output$plotly <- renderPlotly({
switch(input$plot_type,
ua_views_by_area = ua_views_by_area(input$dates[1],input$dates[2]),
ua_age_access = ua_age_access(input$dates[1],input$dates[2]),
req(FALSE)
)
})
The req(FALSE) call aborts the rendering of that output. See http://shiny.rstudio.com/articles/req.html.
--
You received this message because you are subscribed to the Google Groups "Shiny - Web Framework for R" group.
To unsubscribe from this group and stop receiving emails from it, send an email to shiny-discus...@googlegroups.com.
To view this discussion on the web visit https://groups.google.com/d/msgid/shiny-discuss/3a73bef7-66a7-46e3-897d-a3bb00d2993e%40googlegroups.com.
For more options, visit https://groups.google.com/d/optout.
dividor
Jan 26, 2016, 2:13:01 PM1/26/16
to Shiny - Web Framework for R
Hi Joe,
Wow, thanks for the super fast reply!
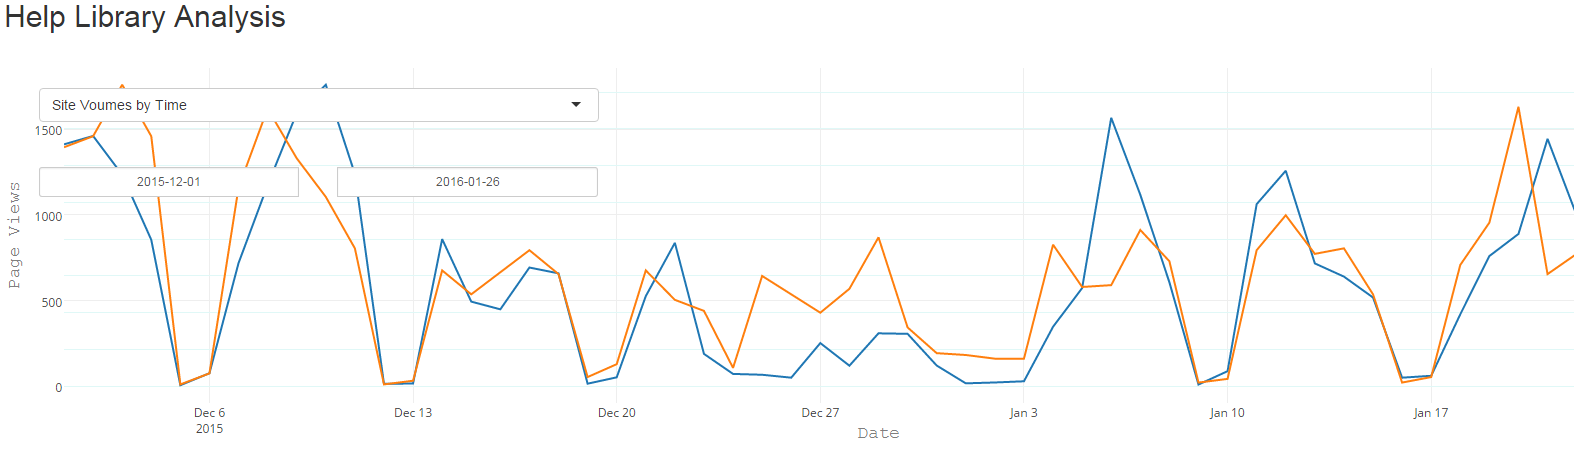
I must be doing something wrong. If I use this setup, when my application first runs (with a plotly plot), the graph is superimposed over the user interface area (please image see below). Also, it stops working after this, selecting other plot types does nothing with no errors output.
If I change the calls in ui.R to use mainPanel instead of conditionalPanel everything works, plotly and non-plotly, but as you'd expect the positioning is off - the plotly plots are to the right-hand side of the UI fields and the non-plotly plots are below the UI.
ui.R
library(shiny)library(plotly)
shinyUI(fluidPage(  titlePanel("Help Library Analysis"),  sidebarPanel(    selectInput("plot_type", "Plot Type:",
c("Site Voumes by Time" = "ua_vols_time_series", "Page views by ION area" = "ua_views_by_area", "Legacy Content Age vs. UA Page Views" = "ua_age_access", "Word Cloud" = "ua_search_word_cloud" )), dateRangeInput("dates", "Date range", start = "2015-12-01", end = as.character(Sys.Date())) ), conditionalPanel("output.plot", plotOutput("plot") ), conditionalPanel("output.plotly", plotlyOutput("plotly") )))server.R
library(shiny)library(plotly)source("helpers.R")
shinyServer(function(input, output) {
output$plot <- renderPlot({ switch(input$plot_type, ua_search_word_cloud = ua_search_word_cloud(input$dates[1],input$dates[2]), req(FALSE) ) }) output$plotly <- renderPlotly({ switch(input$plot_type, ua_views_by_area = ua_views_by_area(input$dates[1],input$dates[2]), ua_age_access = ua_age_access(input$dates[1],input$dates[2]), ua_vols_time_series = ua_vols_time_series(input$dates[1],input$dates[2]), req(FALSE) ) }) })thanks!
Joe Cheng
Jan 26, 2016, 2:14:57 PM1/26/16
to dividor, Shiny - Web Framework for R
Can you show your app in an external browser and see if there are any JavaScript errors in the browser's error console?
--
You received this message because you are subscribed to the Google Groups "Shiny - Web Framework for R" group.
To unsubscribe from this group and stop receiving emails from it, send an email to shiny-discus...@googlegroups.com.
To view this discussion on the web visit https://groups.google.com/d/msgid/shiny-discuss/91fc63c6-7e43-42ca-8225-6210afe0fdf3%40googlegroups.com.
dividor
Jan 26, 2016, 2:57:04 PM1/26/16
to Shiny - Web Framework for R
I am already running in a browser, but I'm afraid I don't see any console errors.
A few more details about behavior:
- With conditionalPanel, it plots plotly plots but the plot is overlaid on top of the UI dropdowns
- If I then select a non-plotly plot, it hangs - no errors in R session or browser console
- Everything works with mainPanel, but plot positions are off

On Tuesday, 26 January 2016 11:55:17 UTC-5, dividor wrote:
Message has been deleted
dividor
Jan 28, 2016, 5:20:55 PM1/28/16
to Shiny - Web Framework for R
Enter code here...
Ok, I figured out the problem.
Ok, I figured out the problem.
Firstly, The conditionalPanels needed a condition. Sorry for not spotting that sooner, this is my first foray into Shiny (which is AWESOME!).
Secondly, to get around the plot overlapping the UA areas, I put them on different rows ...
So I needed something like this in ui.R ...
conditionalPanel("output.plot",
condition = "input.plot_type == 'ploty_plot',
plotOutput("plot")
),
conditionalPanel("output.plotly",
condition = "input.plot_type != 'ploty_plot',
plotlyOutput("plotly")
),
fluidRow(
plotting panels here
),
hr()
fluidRow(
UI here
)
Columns worked too, but the above looks nicer.
Thanks for the pointers Joe!
Joe Cheng
Jan 28, 2016, 5:46:56 PM1/28/16
to dividor, Shiny - Web Framework for R
Oh, it was my mistake. "output.plot" / "output.plotly" were supposed to be the conditions (so you can remove them if you want to use the conditions you came up with instead).
My mistake was that output.plot will never be true because output$plot isn't executing because the conditionalPanel is hidden because output.plot is false because the conditionalPanel is hidden... it's circular. This is because Shiny doesn't bother updating outputs that aren't visible. You can break this circular logic with outputOptions(output, "plot", suspendWhenHidden=FALSE) and outputOptions(output, "plotly", suspendWhenHidden=FALSE), then my "output.plot"/"output.plotly" should work.
But you could ignore that and just use your solution as well, maybe better your way anyway.
--
You received this message because you are subscribed to the Google Groups "Shiny - Web Framework for R" group.
To unsubscribe from this group and stop receiving emails from it, send an email to shiny-discus...@googlegroups.com.
To view this discussion on the web visit https://groups.google.com/d/msgid/shiny-discuss/d5953724-48d3-49c1-89b2-7bb848e8fd85%40googlegroups.com.
Reply all
Reply to author
Forward
0 new messages