About top-flows and error margin
55 views
Skip to first unread message

Murat Inal
Apr 27, 2022, 11:40:35 AM4/27/22
to sFlow-RT
Dear All,
My test system for sFlow consists a host running sFlow-RT with top-flows app and two other hosts with Host sFlow (hsflowd) probe. All hosts are Linux.
In order to experience real-time ops, I started continuous traffic from one host to other using iPerf. Details;
- Traffic is limited to 100Mbps with the relevant iPerf option.
- Tests are done over UDP and TCP.
- All physical network interfaces are 1Gbps.
- Throughput is exactly 100Mbps, monitored at iPerf client & server, checked real-time with iftop.
- Test is repeated with sample rates N=400, 1000, 40 and 1.
- Test is repeated with polling period=10, 5, 1 seconds.
top-flows' real-time display fluctuates heavily, ranging from 20Mbps to 200Mbps. I increased sampling frequency, adjusted polling period and tried with TCP & UDP. Heavy fluctuation exists at all combinations.
I did check Packet Sampling Basics page. Unfortunately could not reason or correlate my findings.
I will be glad if you comment on the above.
Thanks,

Peter Phaal
Apr 27, 2022, 11:59:12 AM4/27/22
to sFlow-RT
Could you share your Host sFlow configuration?
If you have both ends of the iperf test (client and server) sending sFlow then you may be over counting (depending on the sFlow-RT flow definition). What flow definition are you using? Have you used any customer settings in the top-flows app? I would recommend trying the browse-flows (https://github.com/sflow-rt/browse-flows) - it's simpler and is actively supported.
You can use an "agent=<ip>" filter to select one of the sFlow agents. This should improve the accuracy of your topN chart.
Murat Inal
Apr 28, 2022, 9:54:39 AM4/28/22
to sFlow-RT
Hello Peter,
2022-04-28T15:48:00+03:00 INFO: Version check, running latest
2022-04-28T15:48:00+03:00 INFO: Listening, sFlow port 6343
2022-04-28T15:48:00+03:00 INFO: Listening, HTTP port 8008
2022-04-28T15:48:00+03:00 INFO: app/browse-flows/scripts/top.js started
Thanks for your reply. Please find my answers inline.
Could you share your Host sFlow configuration?
sflow {
polling = 10
sampling = 400
collector { ip=10.1.1.99 udpport=6343 }
pcap { dev = stg }
polling = 10
sampling = 400
collector { ip=10.1.1.99 udpport=6343 }
pcap { dev = stg }
}
hsflowd version is 2.0.36.
If you have both ends of the iperf test (client and server) sending sFlow then you may be over counting (depending on the sFlow-RT flow definition).
I ensured that there is ONLY a single hsflowd running and it is on iPerf server. In order to clarify the setup;
- iPerf server & client machines are physical. Both are running Ubuntu Server with kernel 5.13.0-40-generic.
- Sampled interface name is stg. It is a physical interface, no VLANs, not in an LACP bonding, etc. MTU size is 1500 bytes.
- Client interface MTU size is 1500 bytes.
- In-between switch is a Cisco Catalyst, unfortunately no sFlow capability for a cross-check.
What flow definition are you using? Have you used any customer settings in the top-flows app?
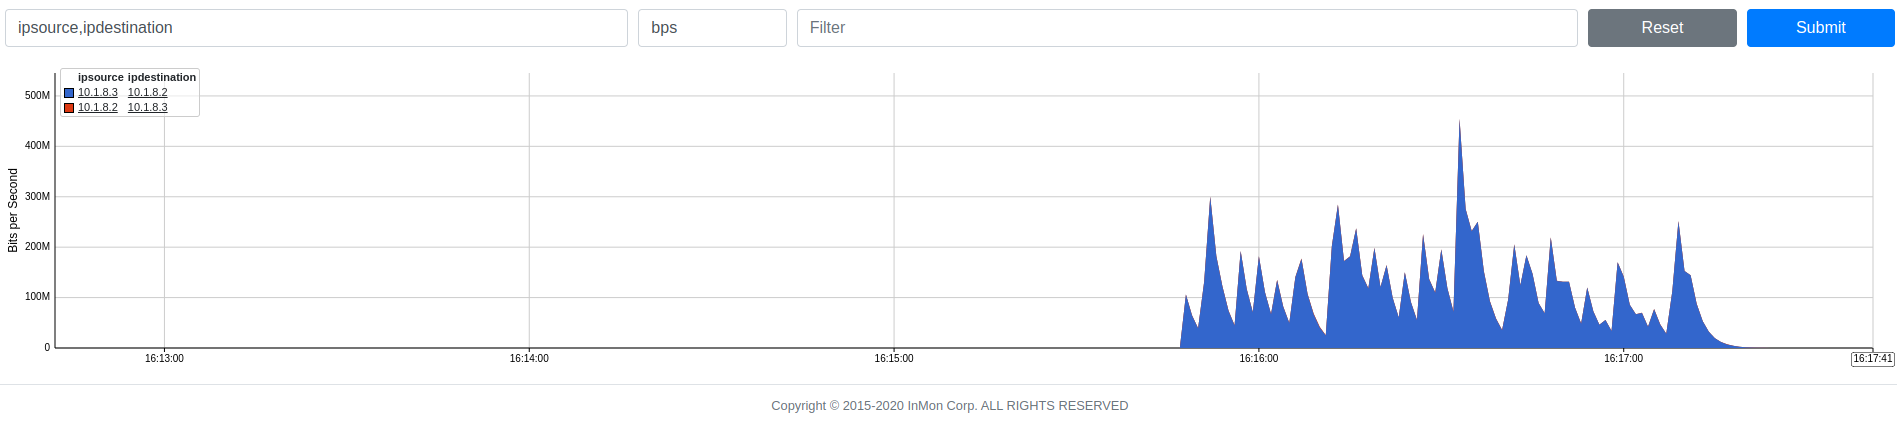
With top-flows, only setting I did is to choose ipsource, ipdestination pair. Nothing else.
I would recommend trying the browse-flows (https://github.com/sflow-rt/browse-flows) - it's simpler and is actively supported.
I did as suggested. New sFlow-RT instance is;
- A physical Ubuntu running computer with kernel 5.13.0-40-generic.
- sFlow-RT is running natively; not on VM/container.
- sFlow-RT launch output;
2022-04-28T15:48:00+03:00 INFO: Version check, running latest
2022-04-28T15:48:00+03:00 INFO: Listening, sFlow port 6343
2022-04-28T15:48:00+03:00 INFO: Listening, HTTP port 8008
2022-04-28T15:48:00+03:00 INFO: app/browse-flows/scripts/top.js started
iPerf is running as;
- server: iperf -s --bind 10.1.8.2
- client: iperf -t0 -b100M -c 10.1.8.2
I checked iPerf server output and traffic rate at client & server using iftop. There are NO fluctuations, TCP stream is 100Mbps straightforward.
Any suggestions?
Regards,
Peter Phaal
Apr 28, 2022, 10:37:36 AM4/28/22
to sFlow-RT
For a physical interface Host sFlow uses a default sampling rate of N=speed/1000000 (see https://sflow.net/host-sflow-linux-config.php), so for example, if you have a 10G interface the default sampling rate will be 1-in-10,000. These are the sampling rates recommended for sFlow-RT (https://sflow-rt.com/agents.php), ensuring that large flows (defined as consuming 10% of link bandwidth) are detected within approximately 1 second.
However, if you want accuracy for smaller flows, you have two choices:
1. Override the default sampling rate for the link speed in the Host sFlow config, e.g. sampling.10G=1000
2. Increase the smoothing time constant in sFlow-RT, https://blog.sflow.com/2018/04/flow-smoothing.html. The Browse Flows application lets you set the default smoothing time constant using a System Property (https://sflow-rt.com/reference.php#properties), for example, browse-flows.t=10, would increase the time constant from the default of 2 seconds to 10 seconds. The measurements should be less variable, but respond more slowly.
You can cross check the measurements against interface counters. If you also install the Browse Metrics app (https://github.com/sflow-rt/browse-metrics), you can trend ifinoctets for the interface and compare the results with Browse Flows. The sFlow Test application automates this validation process, https://blog.sflow.com/2015/11/sflow-test.html, and is a useful test for physical switches.
Reply all
Reply to author
Forward
0 new messages