Sflow-rt's In/outBound Throughput and cumulative traffic data collection are incorrect. Let me know how to solve it.

게발자 라스크
We tried to collect SRC / DST Throughput and accumulated traffic of each IP from routers and switches using Sflow-rt and visualized using Prometeus and Grafana.
We tried a 1GB data download test using curl, and we could see the download was performed at a constant bandwidth rate in the ssh terminal, but the sflow-rt data checked through the grafana graph showed an inconsistent bandwidth rate.
Also, the accumulated traffic must be 1 GB, but the actual accumulated traffic is 0.6 GB.
I want a solution to display the data accurately in the traffic and throughput speed described below.
Test Envirormnent
Sflow Version
[Attatchment : sflow-envirorment.png]
Prometheus metrics script
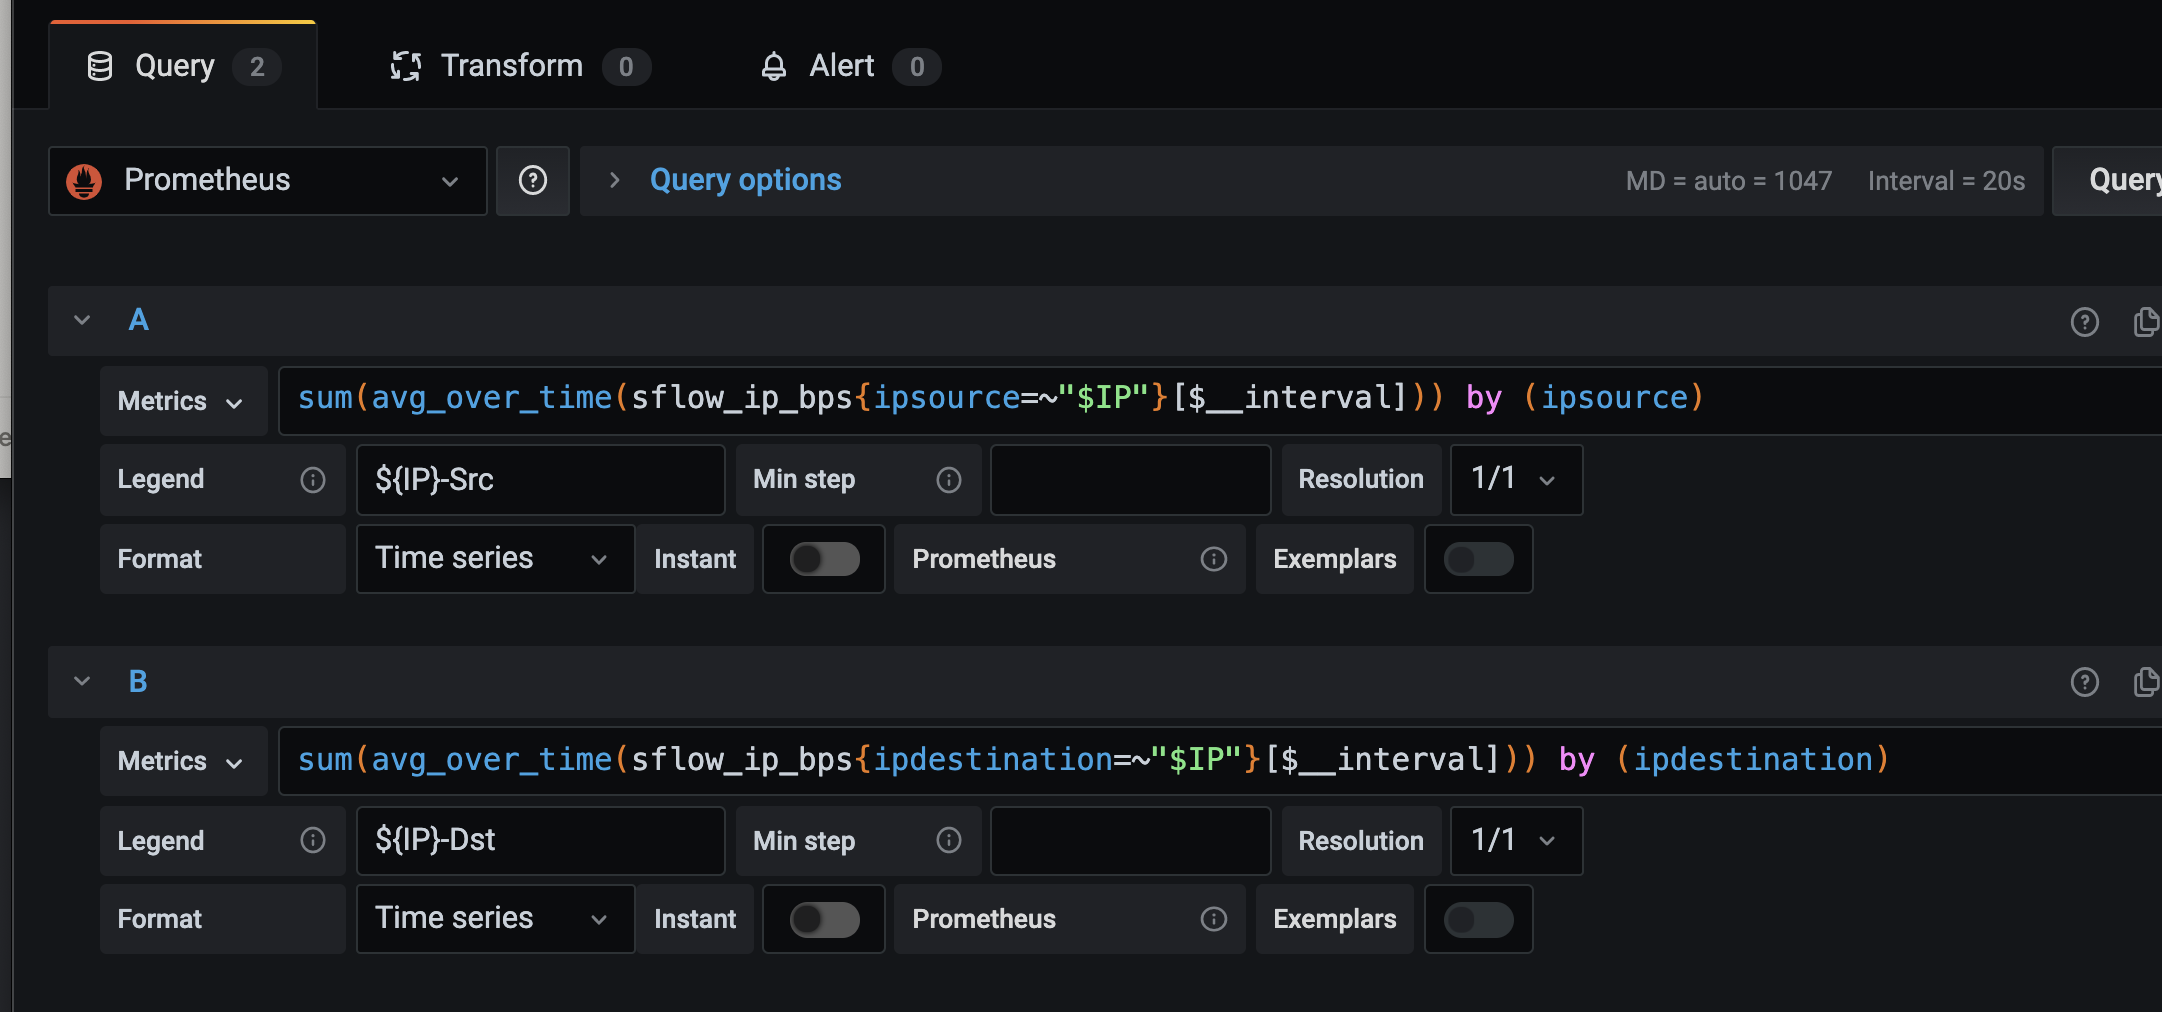
Traffic By specified by Ip metrics script
[Attatchment : prometeus-traffic-by-ip-metrics-script.png]
Throughput By specified by Ip metrics script
[Attatchment : throughput-by-specified-by-ip-metrics-script.png]
Switch configured settings
Switch Model : Cisco Nexus N3K-C3064PQ-10GE
sflow sampling-rate 50000 sflow max-sampled-size 256 sflow collector-ip {sflow-rt server ip} vrf default sflow agent-ip {cisco nexus ip} sflow data-source interface Ethernet1/47 sflow data-source interface Ethernet1/48
The ports configured as data-source are the uplink ports of the switch. (Switch's uplink is configured in static route mode)
Prometheus Job Setting
- job_name: 'sflow-rt-ip'
metrics_path: /app/prometheus/scripts/export.js/flows/ALL/txt
static_configs:
- targets: ['localhost:8008']
params:
metric: ['sflow_ip_bps']
key: ['ipsource','ipdestination']
label: ['ipsource','ipdestination']
value: ['bytes']
scale: ['8']
aggMode: ['sum']
minValue: ['0']
maxFlows: ['1000']
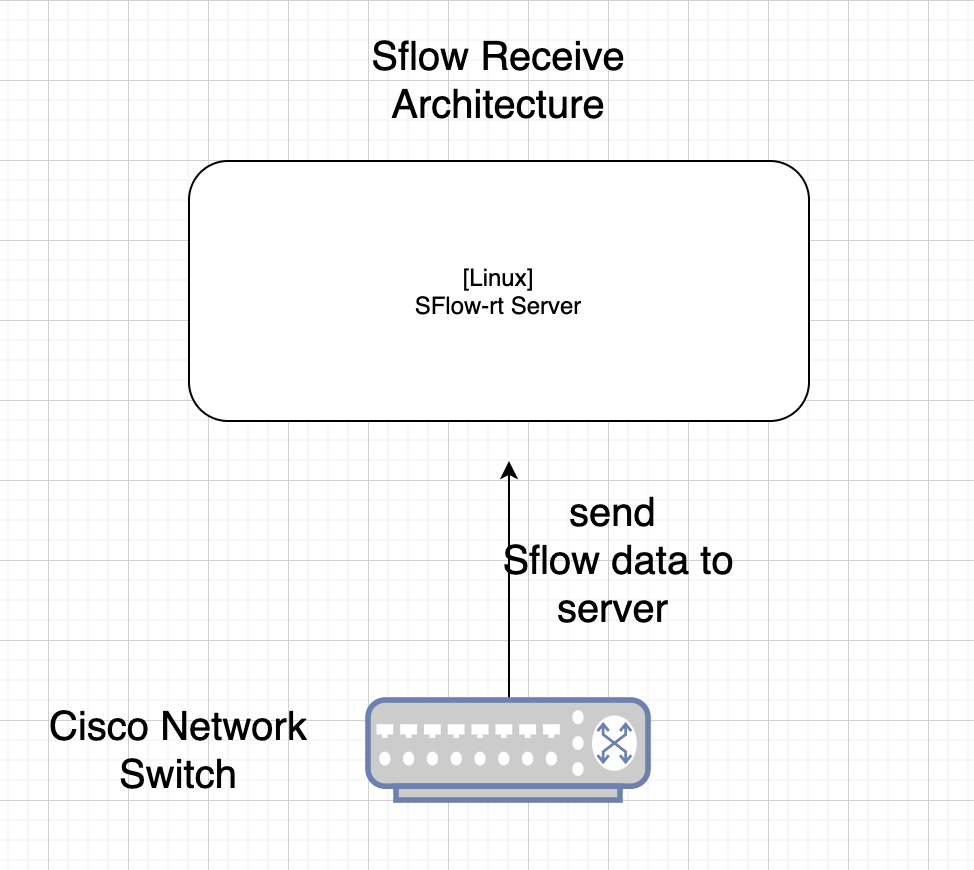
Sflow Receive Architecture
[Attatchment : sflow-receive-archietecture.png]
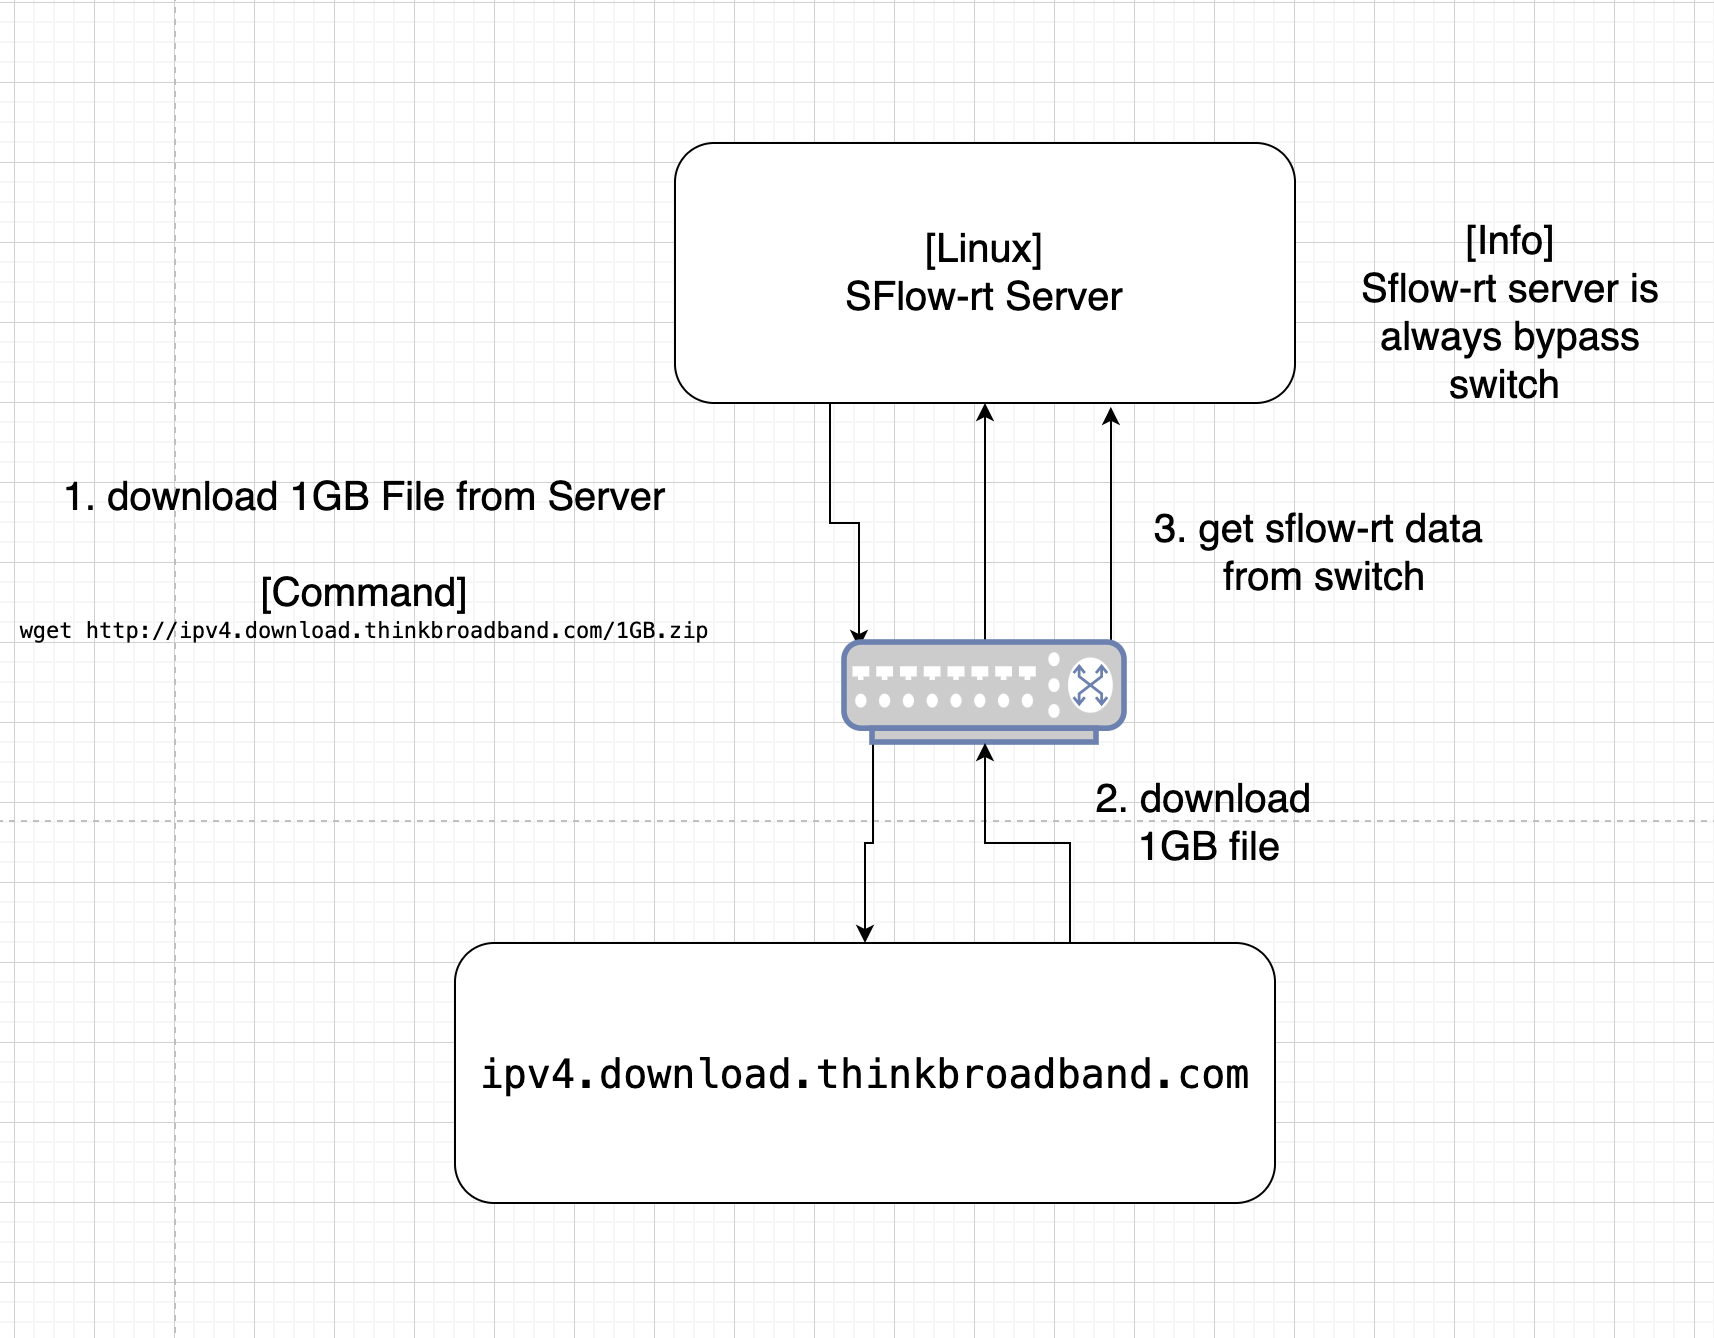
Test Process
[Attatchment : test-process.png]
Test Result and Compare
Before
Note : If you check the graph below, you can see that no traffic is occurring before the test.
[Attatchment : before-bandwidth-graph.png]
[Attatchment : befrore-traffic-by-specified-ip.png]
After
[Attatchment : after-bandwidth-graph.png]
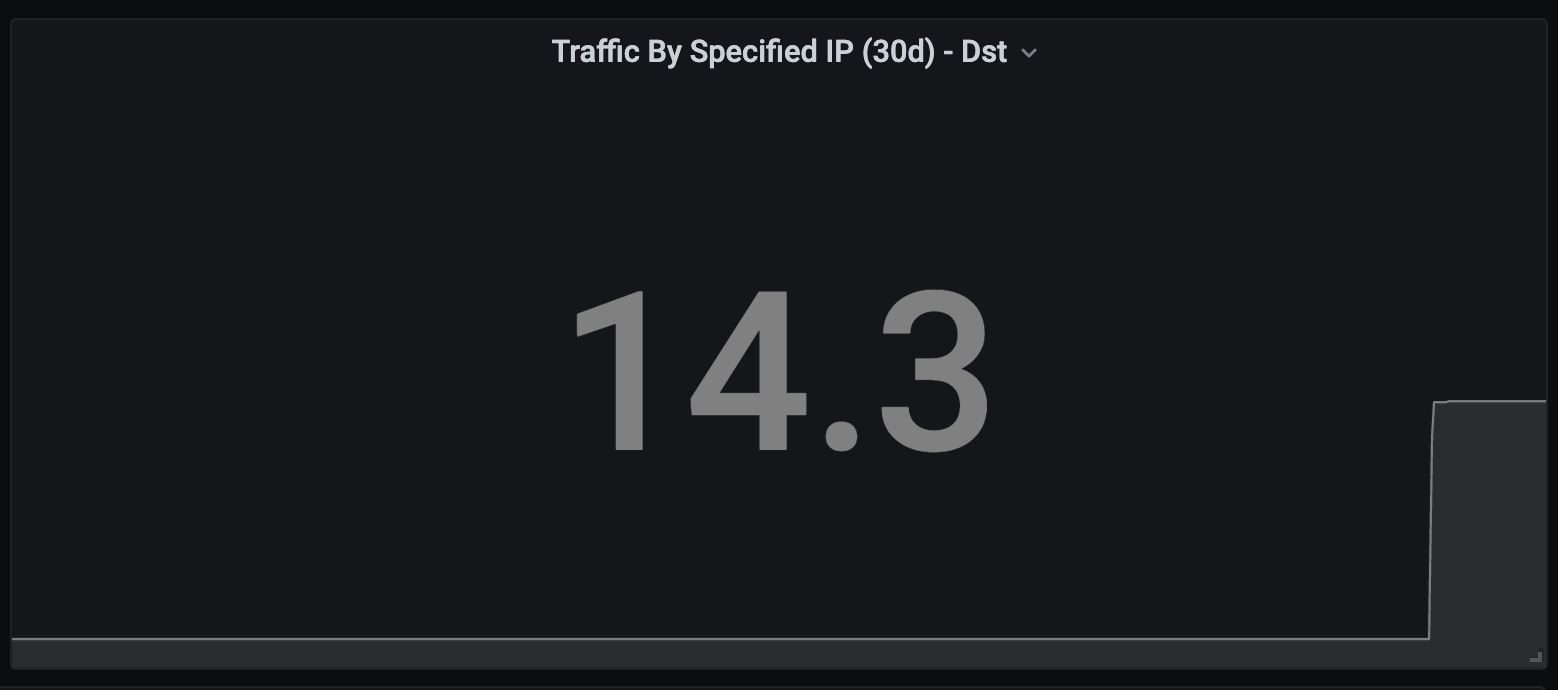
[Attatchment : after-traffic-by-specified-ip.png]
As you can see, the 1GB file was downloaded, but the actual incremented data amount is displayed as 0.6GB.
