Issues Found During Security Onion Testing
176 views
Skip to first unread message

Jim Hranicky
Oct 24, 2019, 5:22:21 PM10/24/19
to security-onion
We are currently running a POC of Security Onion. Our setup:
1 Bro/Zeek forward sensor (2x18 core Xeons/72 HT)
1 Suricata forward sensor (2x12 core Xeons/48 HT)
1 Master (2x12 core Xeons/48 HT)
5 Storage nodes (4-6 core VMware hosts)
All disks are either spinny drives or vmware virtual
disks.
As this is a Proof of Concept setup, this is not an ideal
hardware setup. However, I have been able to pinpoint some
possible areas for improvement in the SO setup.
(for reference, we are running the securityonionsolutionselas
docker images on the master and the storage nodes)
We currently have our border routers sending traffic
to a GigaMON. That traffic is then sent to the Zeek
SO sensor, the Suricata SO sensor, and one of our
production snort sensors (among other things).
I first noticed a problem with the bro events in SO
when looking at the graphs for daily traffic. As the
day progressed, the number of events went down, and
then went back up at night, in general, the opposite
of what is expected.
Also, when investigating events found in our snort setup,
it seemed that some of those events were missing corresponding
events in Bro.
After doing some checking, I found that during some parts
of the day, over 95% of our bro events were never making
it off the Bro sensor.
syslog-ng-ctl was reporting high numbers of event drops. I
set up a cron job to dump syslog-ng-ctl stats to a file
once per hour, and wrote up a little script to get stats
on hourly intervals (our time zone is EDT):
Morning:
Stats for Interval : 2019-09-18 10:00:01 (2019-09-18 06:00:01 EDT) - 2019-09-18 11:00:01 :
Seconds : 3600.0 (1 hour)
Processed : 34,877,990
Dropped : 27,882,494
Written : 6,995,496
Written/s : 1943.19
Processed/s : 9688.33
Drops/s : 7745.14
Drop % : 79.94%
Peak Time:
Stats for Interval : 2019-09-18 16:00:01 (2019-09-18 12:00:01 EDT) - 2019-09-18 17:00:01 :
Seconds : 3600.0 (1 hour)
Processed : 102,267,929
Dropped : 98,591,776
Written : 3,676,153
Written/s : 1021.15
Processed/s : 28407.76
Drops/s : 27386.60
Drop % : 96.41%
There are quite a few drops in the morning, but during peak traffic
time it's quite substantial.
According to Kibana, everything is working as expected.
In trying to pinpoint where issues are, we first made some
changes to syslog-ng. We enabled flow-control so syslog-ng
would try to ensure all the messages in the bro log files
would make it into Elastic. This worked after a fasion, as
all the logs were eventually ingested into Elastic, however,
it took hours to do so, so bro logs were rotated out several
times before syslog-ng could finish, leaving large gaps in
the events with some hours having large numbers of events.
Next, we turned out attention to the master to see if part
of the problem was happening there.
I installed the non-oss version of Kibana on our storage
nodes so I could check ingestion rates. With the default
syslog-ng setup, we were ingesting about 500 eps per node,
or roughly 2500 eps total.
On the master, we increased the variable
pipeline.batch.size
from 125 to 2048 and seemed to see some modest improvement in
the rate of ingestion. We eventally increased it to 40960 which
helped more, but the events ingested started falling behind.
This seemed to indicate that logstash was having trouble
ingesting events at the rate syslog-ng was sending them. However,
logstash seems to give no indication of processing problems,
even when increasing the logging level to "trace" .
The syslog-ng documentation seems to agree :
https://www.syslog-ng.com/technical-documents/doc/syslog-ng-open-source-edition/3.16/administration-guide/destination-queue-full
If flow-control is disabled, syslog-ng will drop messages if the destination queues are full
To further investigate this, I wrote a small perl script
("perlstash") that reads events on port 6050, "tags" them
with "syslogng" via search/replace, and pipes them into
redis-cli --pipe using the redis protocol. I then ran this
from a docker container.
The improvement was pretty significant. From syslog-ng :
Morning:
Stats for Interval : 2019-10-11 05:00:01 (2019-10-11 01:00:01 EDT) - 2019-10-11 06:00:01 :
Seconds : 3600.0 (1 hour)
Processed : 46,553,013
Dropped : 16,615,449
Written : 29,937,564
Written/s : 8315.99
Processed/s : 12931.39
Drops/s : 4615.40
Drop % : 35.69%
Peak Time:
Stats for Interval : 2019-10-11 16:00:01 (2019-10-11 12:00:01 EDT) - 2019-10-11 17:00:02 :
Seconds : 3601.0 (1 hour)
Processed : 84,793,371
Dropped : 54,784,684
Written : 30,008,687
Written/s : 8333.43
Processed/s : 23547.17
Drops/s : 15213.74
Drop % : 64.61%
The events now remain roughly constant through the day at
approximately 30M / hr. The storage node backends seem to
be reporting 8-10k eps, which roughly corresponds to this.
With this, it seems easy to conclude the master-node-as-queue
solution seems to be a pretty significant bottleneck in our
current setup.
Next, I set up a 3-node kafka cluster and setup syslog-ng
with kafka-c support. With this setup I was able to to improve
the numbers even further:
Stats for Interval : 2019-10-16 19:00:01 (2019-10-16 15:00:01 EDT) - 2019-10-16 19:25:55 :
Seconds : 1554.0 (25 minutes)
Processed : 37,587,448
Dropped : 7,423,401
Written : 30,164,047
Written/s : 19410.58
Processed/s : 24187.55
Drops/s : 4776.96
Drop % : 19.75%
Stats for Interval : 2019-10-16 19:25:55 (2019-10-16 15:25:55 EDT) - 2019-10-16 20:00:02 :
Seconds : 2047.0 (35 minutes)
Processed : 48,866,709
Dropped : 9,173,456
Written : 39,693,253
Written/s : 19390.94
Processed/s : 23872.35
Drops/s : 4481.41
Drop % : 18.77%
The storage nodes couldn't really keep up with this volume
and they seemed to max out at around 12.5k eps. I only kept
this setup running for about an hour, then re-enabled the
perl reader and let kafka drain out. Once all the events were
finally ingested it translated to roughly 2x the number of
events ingested by the perl reader.
I would also think sending bro logs straight to kafka could
improve performance even further, but I haven't tried the
plugin that could be found here:
https://github.com/apache/metron-bro-plugin-kafka
These are the issues I can see at this point:
1) There is no kind of alert reporting dropped syslog-ng
messages in the SO setup.
2) The master-as-queue seems to impose a significant bottlneck
on event processing
3) It's difficult to pinpoint what is causing the bottleneck as
logstash on the master doesn't seem to indicate any problems
ingesting the events.
4) logstash and redis on the master end up fighting each other
for resources.
Questions:
1) What would be the preferred method of getting syslog-ng stats
into SO. metricbeat module?
2) Would the SO group be interested in adding kafka clusters or
other queueing systems to the SO configuration?
There's no doubt our setup would benefit from hardware improvements,
but it seems with some adjustments an SO cluster would be able to
perform better than the default forward/master/storage setup.
With all that said, it's also entirely possible I've missed some
things or could do things differently. I welcome any and all
feedback, thanks.
(Attached are the perl program/Docker file I used for testing,
the kafka config I added to /etc/logstash/custom on the master,
and the syslog-ng kafka-c config example).
--
Jim Hranicky
Data Security Specialist
UF Information Technology
720 SW 2nd Avenue Suite 450, North Tower, Gainesville, FL 32605
352-273-1341

Doug Burks
Oct 25, 2019, 7:36:23 AM10/25/19
to securit...@googlegroups.com
Hi Jim,
Thanks for your detailed email.
Let's start off with a little more information about your environment and what tuning you've tried so far:
- How much traffic are you sending from the GigaMON to your sensors?
- You mention changing pipeline.batch.size on the master; have you tried tuning Logstash on the storage nodes?
- Have you tried tuning redis on your master server? If I remember correctly, it defaults to 10% of your total memory and once it reaches that limit, it will reject new logs.
--
Follow Security Onion on Twitter!
https://twitter.com/securityonion
---
You received this message because you are subscribed to the Google Groups "security-onion" group.
To unsubscribe from this group and stop receiving emails from it, send an email to security-onio...@googlegroups.com.
To view this discussion on the web visit https://groups.google.com/d/msgid/security-onion/dd651633-0ce3-2ca9-77c8-d4607c3fdfe8%40gmail.com.
Doug Burks
CEO
Security Onion Solutions, LLC
CEO
Security Onion Solutions, LLC
Jim Hranicky
Oct 25, 2019, 10:28:38 AM10/25/19
to securit...@googlegroups.com, Doug Burks
On 10/25/19 7:36 AM, Doug Burks wrote:
> Let's start off with a little more information about your environment and
> what tuning you've tried so far:
>
> - How much traffic are you sending from the GigaMON to your sensors?
We have 2 10g taps off our border routers that we then
> Let's start off with a little more information about your environment and
> what tuning you've tried so far:
>
> - How much traffic are you sending from the GigaMON to your sensors?
consolidate into 1 stream with the GigaMON. We only have
1 10g tap to the GM for each of our sensors currently.
> - You mention changing pipeline.batch.size on the master; have you tried
> tuning Logstash on the storage nodes?
changes I made were able to crank up the EPS from 2.5k
with the default setup to 12.5k using the kafka-based
solution.
> - Have you tried tuning redis on your master server? If I remember
> correctly, it defaults to 10% of your total memory and once it reaches that
> limit, it will reject new logs.
After running the perl test I eventually ran into memory issues,
so I increased it to 32G. However, the increase in EPS started
immediately, so I don't think the issue was redis when running
the default setup. As far as I can tell, the issue was logstash.
Unfortunately, it's difficult to pinpoint where the problems are,
so I just tackled them one at a time. Replacing logstash with
the perl program increased the EPS significantly, and simply
going around the master with the kafka-based solution did so
even more.
Doug Burks
Oct 28, 2019, 6:41:09 AM10/28/19
to securit...@googlegroups.com
Hi Jim,
Replies inline.
On Fri, Oct 25, 2019 at 10:28 AM Jim Hranicky <phra...@gmail.com> wrote:
On 10/25/19 7:36 AM, Doug Burks wrote:
> Let's start off with a little more information about your environment and
> what tuning you've tried so far:
>
> - How much traffic are you sending from the GigaMON to your sensors?
We have 2 10g taps off our border routers that we then
consolidate into 1 stream with the GigaMON. We only have
1 10g tap to the GM for each of our sensors currently.
In your original email, you had measurements at morning and peak time, so what is the average Gbps your sensors are receiving at those times?
> - You mention changing pipeline.batch.size on the master; have you tried
> tuning Logstash on the storage nodes?
I haven't seen the need to as yet for these tests as the
changes I made were able to crank up the EPS from 2.5k
with the default setup to 12.5k using the kafka-based
solution.
> - Have you tried tuning redis on your master server? If I remember
> correctly, it defaults to 10% of your total memory and once it reaches that
> limit, it will reject new logs.
Before the tests, we had increased the maxmemory to 16G.
After running the perl test I eventually ran into memory issues,
so I increased it to 32G. However, the increase in EPS started
immediately, so I don't think the issue was redis when running
the default setup. As far as I can tell, the issue was logstash.
On the master server, have you tried tuning pipeline.workers in /etc/logstash/logstash.yml and the JVM heap settings in /etc/logstash/jvm.options?
Jim Hranicky
Oct 28, 2019, 10:26:55 AM10/28/19
to securit...@googlegroups.com, Doug Burks
n 10/28/19 6:40 AM, Doug Burks wrote:
>> We have 2 10g taps off our border routers that we then
>> consolidate into 1 stream with the GigaMON. We only have
>> 1 10g tap to the GM for each of our sensors currently.
> In your original email, you had measurements at morning and peak time, so
> what is the average Gbps your sensors are receiving at those times?
It's pegged at 10gps.
>> We have 2 10g taps off our border routers that we then
>> consolidate into 1 stream with the GigaMON. We only have
>> 1 10g tap to the GM for each of our sensors currently.
> In your original email, you had measurements at morning and peak time, so
> what is the average Gbps your sensors are receiving at those times?
> On the master server, have you tried tuning pipeline.workers in
> /etc/logstash/logstash.yml and the JVM heap settings in
> /etc/logstash/jvm.options?
in logstash.yml :
# Set the number of workers that will, in parallel, execute the filters+outputs
# stage of the pipeline.
#
# This defaults to the number of the host's CPU cores.
#
# pipeline.workers: 2
We did modify the heap settings as follows:
-Xms30000m
-Xmx30000m
Thanks,
Jim
Doug Burks
Oct 29, 2019, 7:18:41 AM10/29/19
to securit...@googlegroups.com
Hi Jim,
Replies inline.
On Mon, Oct 28, 2019 at 10:26 AM Jim Hranicky <phra...@gmail.com> wrote:
n 10/28/19 6:40 AM, Doug Burks wrote:
>> We have 2 10g taps off our border routers that we then
>> consolidate into 1 stream with the GigaMON. We only have
>> 1 10g tap to the GM for each of our sensors currently.
> In your original email, you had measurements at morning and peak time, so
> what is the average Gbps your sensors are receiving at those times?
It's pegged at 10gps.
So just to make sure I understand, you're sending a full 10Gbps to your Bro/Zeek forward sensor and that same full 10Gbps to your Suricata forward sensor?
Is your Suricata forward sensor using the default config of just IDS alerts or have you configured it to send additional Suricata logs?
Are you just sending Bro/Zeek and Suricata logs to your master server, or are there any additional logs that you're sending?
> On the master server, have you tried tuning pipeline.workers in
> /etc/logstash/logstash.yml and the JVM heap settings in
> /etc/logstash/jvm.options?
I don't believe we changed pipeline.workers due to these comments
in logstash.yml :
# Set the number of workers that will, in parallel, execute the filters+outputs
# stage of the pipeline.
#
# This defaults to the number of the host's CPU cores.
#
# pipeline.workers: 2
In addition to that commented section of logstash.yml, the file may also have an appended pipeline.workers setting near the bottom of the file. What is the output of the following from your master server?
grep pipeline.workers /etc/logstash/logstash.yml
You might try increasing your logstash workers, perhaps even beyond your number of CPU cores, per the guidance here:
We did modify the heap settings as follows:
-Xms30000m
-Xmx30000m
Did you try any other heap sizes?
Have you verified that your setting of 30000m is not above the cutoff for compressed object pointers?
https://www.elastic.co/guide/en/elasticsearch/reference/6.8/heap-size.html
https://www.elastic.co/guide/en/elasticsearch/reference/6.8/heap-size.html
Have you tried removing unused inputs from /etc/logstash/conf.d.redis.output/?
If you think that your logstash input is being overwhelmed, have you considered creating additional inputs in /etc/logstash/conf.d.redis.output/ similar to 0000_input_syslogng.conf but using a different port number? You could then modify syslog-ng on your forward nodes to send a portion of logs to port 6050 and the remaining logs to the other port(s) to see if that makes any difference.
Jim Hranicky
Oct 29, 2019, 11:52:36 AM10/29/19
to securit...@googlegroups.com, Doug Burks
On 10/29/19 7:18 AM, Doug Burks wrote:
> So just to make sure I understand, you're sending a full 10Gbps to your
> Bro/Zeek forward sensor and that same full 10Gbps to your Suricata forward
> sensor?
Correct.
> So just to make sure I understand, you're sending a full 10Gbps to your
> Bro/Zeek forward sensor and that same full 10Gbps to your Suricata forward
> sensor?
> Is your Suricata forward sensor using the default config of just IDS alerts
> or have you configured it to send additional Suricata logs?
> Are you just sending Bro/Zeek and Suricata logs to your master server, or
> are there any additional logs that you're sending?
Bro logs are still the vast majority.
> In addition to that commented section of logstash.yml, the file may also
> have an appended pipeline.workers setting near the bottom of the file.
> What is the output of the following from your master server?
> grep pipeline.workers /etc/logstash/logstash.yml
# pipeline.workers: 2
However, I did get this log in logstash.log :
[2019-10-29T15:03:30,338][WARN ][logstash.javapipeline ] CAUTION:
Recommended inflight events max exceeded! Logstash will run with up to
1966080 events in memory in your current configuration. If your message
sizes are large this may cause instability with the default heap size.
Please consider setting a non-standard heap size, changing the batch
size (currently 40960), or changing the number of pipeline workers
(currently 48) {:pipeline_id=>"main", :thread=>"#<Thread:0x2d9cfd79 run>"}
So logstash by default is using all 48 cores.
> You might try increasing your logstash workers, perhaps even beyond your
> number of CPU cores, per the guidance here:
> https://www.elastic.co/guide/en/logstash/6.8/performance-troubleshooting.html
>> We did modify the heap settings as follows:
>>
>> -Xms30000m
>> -Xmx30000m
>>
>>
> Did you try any other heap sizes?
> Have you verified that your setting of 30000m is not above the cutoff for
> compressed object pointers?
> https://www.elastic.co/guide/en/elasticsearch/reference/6.8/heap-size.html
heap address: 0x00000000ad000000, size: 30000 MB,
Compressed Oops mode: Zero based, Oop shift amount: 3
> How much total memory do you have in your master server?
> Have you tried removing unused inputs
> from /etc/logstash/conf.d.redis.output/?
> If you think that your logstash input is being overwhelmed, have you
> considered creating additional inputs in /etc/logstash/conf.d.redis.output/
> similar to 0000_input_syslogng.conf but using a different port number? You
> could then modify syslog-ng on your forward nodes to send a portion of logs
> to port 6050 and the remaining logs to the other port(s) to see if that
> makes any difference.
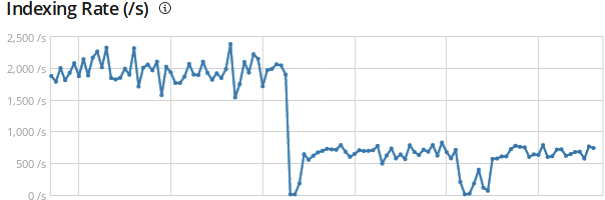
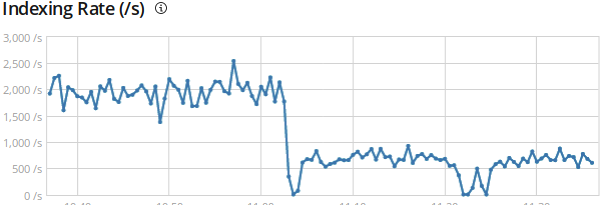
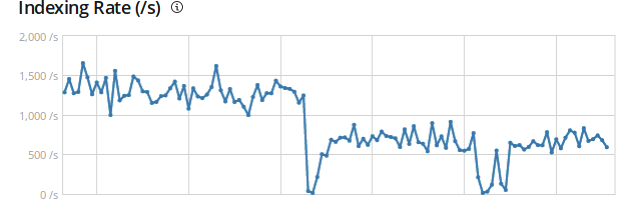
overwhelmed. I disabled the perl script and restarted logstash, and the
graphs attached show significant drops in EPS on all our storage nodes.
Note that even though logstash is complaining about the # of events,
the overly-large pipeline.batch.size showed an improvement over
both the default of 125 events and 2048 events in my previous
testing. It did start to fall behind, however.
I tried changing the workers from the default of 48 according
to the logs above to 72, it didn't seem to make any difference.
In the graphs, the first dip is changing from perl back to logstash.
The EPS stays noticeably lower than when using the perl script.
The second dip is upping the workers to 72, and it seems to make
little difference.
As I said initially, this is a POC on under-powered hardware, and
I'd expect new hardware with SSDs to perform much better, however,
it still seems like the addition of an separate queuing system
would allow for better performance/throughput and future growth.
Jim

Mike Reeves
Oct 29, 2019, 2:53:53 PM10/29/19
to security-onion, Doug Burks
Jim,
Great analysis I really appreciate the effort. Can you try something for me? Can you run the following script on the master while you are testing:
#!/bin/bash
while :
do
so-redis-count >> /tmp/redis.log
sleep 5
done
This will measure the queue length for redis and give us some additional data of what is going on.
Thanks
Mike
--
Follow Security Onion on Twitter!
https://twitter.com/securityonion
---
You received this message because you are subscribed to the Google Groups "security-onion" group.
To unsubscribe from this group and stop receiving emails from it, send an email to security-onio...@googlegroups.com.
To view this discussion on the web visit https://groups.google.com/d/msgid/security-onion/a1d902c0-8fc1-1938-5adf-bda5fde428dc%40gmail.com.
Jim Hranicky
Oct 29, 2019, 3:42:08 PM10/29/19
to securit...@googlegroups.com, Mike Reeves, Doug Burks
Ok, it's running now. How long would you like it to run?
Note, I'm currently running the perl script instead of
logstash. I can provide numbers for each if you'd like.
Jim
P.S. After running for a few minutes, I'm seeing this:
0
0
578
1768
1231
773
199
0
0
0
0
0
518
0
0
7
0
0
0
810
233
0
73
164
729
13
379
79
11
34
234
1087
1849
117
962
265
1722
362
634
11
0
130
So redis seems to be able to keep up. However, syslog-ng is still
reporting high levels of drops on the bro sensor:
(our TZ is EDT)
Stats for Interval : 2019-10-29 19:00:02 - 2019-10-29 19:32:07 :
Seconds : 1925.0
Processed : 54,719,482
Dropped : 40,036,886
Written : 14,682,596
Written/s : 7627.32
Processed/s : 28425.70
Drops/s : 20798.38
Drop % : 73.17%
Getting the events to the master seems to be the main problem
(even replacing logstash with a small perl script).
Doug Burks
Nov 1, 2019, 3:14:24 PM11/1/19
to securit...@googlegroups.com
Quick update for the rest of the community...we are currently working with Jim offlist to determine a solution and will provide more details later.
Doug Burks
Nov 7, 2019, 4:01:40 PM11/7/19
to securit...@googlegroups.com
As an update to this thread, we worked with Jim and made some tuning tweaks that resulted in major performance improvements!
We then updated our documentation and some of our default settings to make this a little easier for folks in the future:
https://securityonion.readthedocs.io/en/latest/logstash.html
https://securityonion.readthedocs.io/en/latest/syslog.html
https://securityonion.readthedocs.io/en/latest/syslog.html
securityonion-sostat: check for syslog-ng drops #1660
securityonion-elastic: master logstash output to redis should be batched by default #1661
securityonion-elastic: storage node redis input should be batched by default #1662
Reply all
Reply to author
Forward
0 new messages