Compactions not running?
12 views
Skip to first unread message

hor...@gmail.com
<horschi@gmail.com>May 20, 2022, 5:07:27 AM5/20/22
to ScyllaDB users
Hi,
I often see scylla nodes reporting pending compactions in nodetool, e.g.:
$ nodetool compactionstats
pending tasks: 1
- pc.blobs: 1
pending tasks: 1
- pc.blobs: 1
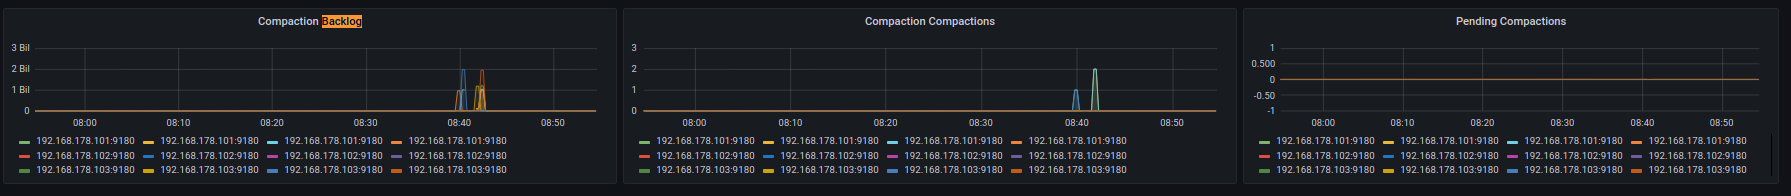
Interestingly the pending compactions in the scylla-advanced dashbaord show no pending compactions:
A restart of these particular nodes seems to solve the issue, as I can see many compactions being triggered after the restart.
I was never really concerned about this behaviour, but today I think it might have crashed a node, because too many sstables piled up. At least I saw various bad-alloc errors with it. One example:
May 20 08:33:11 lqa-2 scylla[2835]: [shard 0] storage_proxy - exception during mutation write to 10.4.43.8: std::bad_alloc (std::bad_alloc)
May 20 08:33:11 lqa-2 scylla[2835]: [shard 0] storage_proxy - exception during mutation write to 10.4.43.8: std::bad_alloc (std::bad_alloc)
May 20 08:33:11 lqa-2 scylla[2835]: [shard 0] storage_proxy - exception during mutation write to 10.4.43.8: std::bad_alloc (std::bad_alloc)
May 20 08:33:11 lqa-2 scylla[2835]: [shard 0] storage_proxy - exception during mutation write to 10.4.43.8: std::bad_alloc (std::bad_alloc)
May 20 08:33:11 lqa-2 scylla[2835]: [shard 0] storage_proxy - exception during mutation write to 10.4.43.8: std::bad_alloc (std::bad_alloc)
May 20 08:33:11 lqa-2 scylla[2835]: [shard 0] storage_proxy - exception during mutation write to 10.4.43.8: std::bad_alloc (std::bad_alloc)
May 20 08:33:11 lqa-2 scylla[2835]: [shard 0] storage_proxy - exception during mutation write to 10.4.43.8: std::bad_alloc (std::bad_alloc)
May 20 08:33:11 lqa-2 scylla[2835]: [shard 0] sstable - failed reading index for /var/lib/scylla/data/pc/lck4-e3f1e300676c11e9b751000000000000/md-7040-big-Data.db: std::bad_alloc (std::bad_alloc)
May 20 08:33:11 lqa-2 scylla[2835]: scylla: ./sstables/partition_index_cache.hh:71: sstables::partition_index_cache::entry::~entry(): Assertion `!is_referenced()' failed.
May 20 08:33:11 lqa-2 scylla[2835]: Aborting on shard 0.
May 20 08:33:11 lqa-2 scylla[2835]: Backtrace:
May 20 08:33:11 lqa-2 scylla[2835]: 0x3dbe2f8
May 20 08:33:11 lqa-2 scylla[2835]: 0x3def152
May 20 08:33:11 lqa-2 scylla[2835]: 0x7f55bf206a1f
May 20 08:33:11 lqa-2 scylla[2835]: /opt/scylladb/libreloc/libc.so.6+0x3d2a1
May 20 08:33:11 lqa-2 scylla[2835]: /opt/scylladb/libreloc/libc.so.6+0x268a3
May 20 08:33:11 lqa-2 scylla[2835]: /opt/scylladb/libreloc/libc.so.6+0x26788
May 20 08:33:11 lqa-2 scylla[2835]: /opt/scylladb/libreloc/libc.so.6+0x35a15
May 20 08:33:11 lqa-2 scylla[2835]: 0x1722ea7
May 20 08:33:11 lqa-2 scylla[2835]: 0x173db94
May 20 08:33:11 lqa-2 scylla[2835]: 0x173dcf1
May 20 08:33:11 lqa-2 scylla[2835]: 0x3dd0cc4
May 20 08:33:11 lqa-2 scylla[2835]: 0x3dd20b7
May 20 08:33:11 lqa-2 scylla[2835]: 0x3dd12fc
May 20 08:33:11 lqa-2 scylla[2835]: 0x3d7aaae
May 20 08:33:11 lqa-2 scylla[2835]: 0x3d79e26
May 20 08:33:11 lqa-2 scylla[2835]: 0xf41135
May 20 08:33:11 lqa-2 scylla[2835]: /opt/scylladb/libreloc/libc.so.6+0x27b74
May 20 08:33:11 lqa-2 scylla[2835]: 0xf3e2ed
May 20 08:33:11 lqa-2 scylla[2835]: [shard 0] storage_proxy - exception during mutation write to 10.4.43.8: std::bad_alloc (std::bad_alloc)
May 20 08:33:11 lqa-2 scylla[2835]: [shard 0] storage_proxy - exception during mutation write to 10.4.43.8: std::bad_alloc (std::bad_alloc)
May 20 08:33:11 lqa-2 scylla[2835]: [shard 0] storage_proxy - exception during mutation write to 10.4.43.8: std::bad_alloc (std::bad_alloc)
May 20 08:33:11 lqa-2 scylla[2835]: [shard 0] storage_proxy - exception during mutation write to 10.4.43.8: std::bad_alloc (std::bad_alloc)
May 20 08:33:11 lqa-2 scylla[2835]: [shard 0] storage_proxy - exception during mutation write to 10.4.43.8: std::bad_alloc (std::bad_alloc)
May 20 08:33:11 lqa-2 scylla[2835]: [shard 0] storage_proxy - exception during mutation write to 10.4.43.8: std::bad_alloc (std::bad_alloc)
May 20 08:33:11 lqa-2 scylla[2835]: [shard 0] sstable - failed reading index for /var/lib/scylla/data/pc/lck4-e3f1e300676c11e9b751000000000000/md-7040-big-Data.db: std::bad_alloc (std::bad_alloc)
May 20 08:33:11 lqa-2 scylla[2835]: scylla: ./sstables/partition_index_cache.hh:71: sstables::partition_index_cache::entry::~entry(): Assertion `!is_referenced()' failed.
May 20 08:33:11 lqa-2 scylla[2835]: Aborting on shard 0.
May 20 08:33:11 lqa-2 scylla[2835]: Backtrace:
May 20 08:33:11 lqa-2 scylla[2835]: 0x3dbe2f8
May 20 08:33:11 lqa-2 scylla[2835]: 0x3def152
May 20 08:33:11 lqa-2 scylla[2835]: 0x7f55bf206a1f
May 20 08:33:11 lqa-2 scylla[2835]: /opt/scylladb/libreloc/libc.so.6+0x3d2a1
May 20 08:33:11 lqa-2 scylla[2835]: /opt/scylladb/libreloc/libc.so.6+0x268a3
May 20 08:33:11 lqa-2 scylla[2835]: /opt/scylladb/libreloc/libc.so.6+0x26788
May 20 08:33:11 lqa-2 scylla[2835]: /opt/scylladb/libreloc/libc.so.6+0x35a15
May 20 08:33:11 lqa-2 scylla[2835]: 0x1722ea7
May 20 08:33:11 lqa-2 scylla[2835]: 0x173db94
May 20 08:33:11 lqa-2 scylla[2835]: 0x173dcf1
May 20 08:33:11 lqa-2 scylla[2835]: 0x3dd0cc4
May 20 08:33:11 lqa-2 scylla[2835]: 0x3dd20b7
May 20 08:33:11 lqa-2 scylla[2835]: 0x3dd12fc
May 20 08:33:11 lqa-2 scylla[2835]: 0x3d7aaae
May 20 08:33:11 lqa-2 scylla[2835]: 0x3d79e26
May 20 08:33:11 lqa-2 scylla[2835]: 0xf41135
May 20 08:33:11 lqa-2 scylla[2835]: /opt/scylladb/libreloc/libc.so.6+0x27b74
May 20 08:33:11 lqa-2 scylla[2835]: 0xf3e2ed
After a restart of that node, I can see that its compacting a lot now:
$ nodetool compactionstats
pending tasks: 19
- system.truncated: 1
- system.local: 1
- system_schema.dropped_columns: 1
- system_schema.tables: 1
- system_schema.types: 1
- system_schema.computed_columns: 1
- system_schema.keyspaces: 1
- system_schema.indexes: 1
- system_schema.columns: 1
- system_schema.view_virtual_columns: 1
- system_schema.aggregates: 1
- system_schema.triggers: 1
- system_schema.views: 1
- pc.jobq2: 1
- pc.property: 1
- pc.outintstates: 1
- pc.lck4: 1
- pc.qd2: 2
id compaction type keyspace table completed total unit progress
edfc5ff0-d817-11ec-8f6a-1cff7d48503f COMPACTION pc qd2 383730476 771587584 keys 49.73%
Active compaction remaining time : 0h00m00s
Could this be a bug, causing compactions not being triggered for some reason? Are there any metrics I can check?
Currently I am observing this with 4.6.3-0.20220414.8bf149fdd.
regards,
Christian
horschi
<horschi@gmail.com>May 20, 2022, 5:41:09 AM5/20/22
to ScyllaDB users
Hi,
I just saw that the node that was having a single pending compaction, is now having pending compactions for a different table:
$ nodetool compactionstats
pending tasks: 2
- pc.tntev2: 2
pending tasks: 2
- pc.tntev2: 2
So it seems the previous compaction was triggered.
What is the logic behind when these pending compactions are being executed?
regards,
Christian
--
You received this message because you are subscribed to the Google Groups "ScyllaDB users" group.
To unsubscribe from this group and stop receiving emails from it, send an email to scylladb-user...@googlegroups.com.
To view this discussion on the web visit https://groups.google.com/d/msgid/scylladb-users/33836bff-5f95-426f-a828-bcaa1ac9d3d2n%40googlegroups.com.

Benny Halevy
<bhalevy@scylladb.com>May 20, 2022, 6:01:18 AM5/20/22
to Christian, Tomasz Grabiec, Raphael S. Carvalho, scylladb-users@googlegroups.com
On Fri, 2022-05-20 at 02:07 -0700, hor...@gmail.com wrote:
> Hi,
>
> I often see scylla nodes reporting pending compactions in nodetool, e.g.:
>
> $ nodetool compactionstats
> pending tasks: 1
> - pc.blobs: 1
>
> Interestingly the pending compactions in the scylla-advanced dashbaord show no pending compactions:
> Hi,
>
> I often see scylla nodes reporting pending compactions in nodetool, e.g.:
>
> $ nodetool compactionstats
> pending tasks: 1
> - pc.blobs: 1
>
> Interestingly the pending compactions in the scylla-advanced dashbaord show no pending compactions:
for this assertion failure.
>
> Currently I am observing this with 4.6.3-0.20220414.8bf149fdd.
>
> regards,
> Christian
horschi
<horschi@gmail.com>May 20, 2022, 7:44:56 AM5/20/22
to Benny Halevy, Tomasz Grabiec, Raphael S. Carvalho, ScyllaDB users
Sorry for the confusion, I think this might be two separate issues/misconceptions:
A) The lqa-2 server might have ran out of disk space and therefore stopped compacting. But the number of sstables is not that high:
/var/lib/scylla/data# find . | wc -l
2754
It had about 100GB of data on it. It was configured to have 3GB of memory, with a smp=1. Once I updated to 5GB memory, the bad-alloc issues were gone. I would expect that scylla should be able to handle the data volume with these memory settings. (also mentioned in https://github.com/scylladb/scylla/issues/10617)
B) The other issue/misconception is why nodes often show pending compactions, e.g.:
$ nodetool compactionstats
pending tasks: 1
- pc.blobs: 1
(this is on an entirely different cluster)
Strangely, grafana is not showing any pending compactions here. This server has more than enough disk space, but it might be disk IO constrained. Might the compaction scheduler postpone compactions to preserve disk-IO?
Benny Halevy
<bhalevy@scylladb.com>May 20, 2022, 10:41:22 AM5/20/22
to horschi, Tomasz Grabiec, Raphael S. Carvalho, ScyllaDB users
On Fri, 2022-05-20 at 13:44 +0200, horschi wrote:
> Sorry for the confusion, I think this might be two separate issues/misconceptions:
>
>
> A) The lqa-2 server might have ran out of disk space and therefore stopped compacting. But the number of sstables is not that high:
> /var/lib/scylla/data# find . | wc -l
> 2754
> It had about 100GB of data on it. It was configured to have 3GB of memory, with a smp=1. Once I updated to 5GB memory, the bad-alloc issues were gone. I would expect that scylla should be able to
> handle the data volume with these memory settings. (also mentioned in https://github.com/scylladb/scylla/issues/10617)
>
>
> B) The other issue/misconception is why nodes often show pending compactions, e.g.:
> $ nodetool compactionstats
> pending tasks: 1
> - pc.blobs: 1
> (this is on an entirely different cluster)
> Strangely, grafana is not showing any pending compactions here. This server has more than enough disk space, but it might be disk IO constrained. Might the compaction scheduler postpone compactions
> to preserve disk-IO?
FWIW, the number returned to nodetool is an estimate
> Sorry for the confusion, I think this might be two separate issues/misconceptions:
>
>
> A) The lqa-2 server might have ran out of disk space and therefore stopped compacting. But the number of sstables is not that high:
> /var/lib/scylla/data# find . | wc -l
> 2754
> It had about 100GB of data on it. It was configured to have 3GB of memory, with a smp=1. Once I updated to 5GB memory, the bad-alloc issues were gone. I would expect that scylla should be able to
> handle the data volume with these memory settings. (also mentioned in https://github.com/scylladb/scylla/issues/10617)
>
>
> B) The other issue/misconception is why nodes often show pending compactions, e.g.:
> $ nodetool compactionstats
> pending tasks: 1
> - pc.blobs: 1
> (this is on an entirely different cluster)
> Strangely, grafana is not showing any pending compactions here. This server has more than enough disk space, but it might be disk IO constrained. Might the compaction scheduler postpone compactions
> to preserve disk-IO?
of the number of regular compaction jobs each table needs.
It is not the actual number of compaction jobs currently active in it.
Unfortunately the same term, "pending compactions" is used for a metric
exposed by Scylla and presented in Grafana, yet it counts something else.
quoting from its description, it
"Holds the number of compaction tasks waiting for an opportunity to run."
The discrepancy between those two numbers can be explained if there
are currently running compaction jobs on the table, which are counted
by the estimate returned to nodetool, yet they are not considered as pending
for the `pending_compaction` metrics counter, as they aren't blocked on anything.
The "compactions" metric counts the number of active compaction tasks.
It should correlate better the number reported by nodetool, BUT there is
no 1:1 correlation between the two, since may limit the number of compaction
jobs running parallel on the same table and on the same size bucket,
so that actual number of running tasks may be smaller than the estimated
number of tasks.
All in all, I think the user-interface can and should be simplified so it
would be clear what we're counting over each api.
Benny
Reply all
Reply to author
Forward
0 new messages