Clock Sensors
96 views
Skip to first unread message

sam...@intim8s.cc.cc
Apr 14, 2013, 4:17:38 PM4/14/13
to scrip...@googlegroups.com
I wanted to ask, how do the clock sensors work. The way I perceive them is as two sensors that contain random variables in order to get brain activity always. Do you allow your clock sensors to dip below 0 up to -1? and how much of a second is one time step in the simulation.

Julian Hershey
May 28, 2013, 11:54:47 PM5/28/13
to scrip...@googlegroups.com
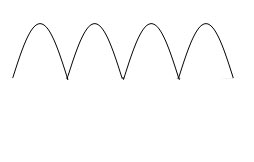
The clock sensors are simply the absolute value of sine or cosine (I don't remember which) functions of the modcounter (a constantly incremented variable). Effectively it looks like this through time, with a max of 1 and min of zero:
sam...@intim8s.cc.cc
May 29, 2013, 3:18:01 AM5/29/13
to scrip...@googlegroups.com
That's very smart. So basically it's the sine/cosine curve cut off at 0. Have u noticed any behaviour that clock sensors are responsible for? and why are there two?
sam...@intim8s.cc.cc
May 29, 2013, 3:28:12 AM5/29/13
to scrip...@googlegroups.com
Also, with ur diagram, it sort of confuses me. Shouldn't there be a gap between the points that touch 0?
On Wednesday, May 29, 2013 6:54:47 AM UTC+3, Julian Hershey wrote:
On Wednesday, May 29, 2013 6:54:47 AM UTC+3, Julian Hershey wrote:
Julian Hershey
Jun 3, 2013, 12:25:40 AM6/3/13
to scrip...@googlegroups.com
I quite frequently see clock-related behaviors, and in fact they are the most noticeable as they are periodic and you just need to watch for an action occurring over and over again. There are two simply for variety.
As for the diagram, I think it is accurate. When you take the absolute value of a number, you get the number back, but if it was negative, it is made positive. So, when the sine function returns a negative number as normal, the absolute value of it simply makes it positive instead. So any "wave troughs" become "wave crests." Normal "wave crests" remain the same, effectively making the resulting graph. If you have a graphing calculator or This beautiful tool, you can check it for yourself.
As for the diagram, I think it is accurate. When you take the absolute value of a number, you get the number back, but if it was negative, it is made positive. So, when the sine function returns a negative number as normal, the absolute value of it simply makes it positive instead. So any "wave troughs" become "wave crests." Normal "wave crests" remain the same, effectively making the resulting graph. If you have a graphing calculator or This beautiful tool, you can check it for yourself.
Reply all
Reply to author
Forward
0 new messages