IHC Image color deconvolution
230 views
Skip to first unread message

Koundinya Desiraju
Aug 23, 2016, 1:40:06 AM8/23/16
to scikit-image
In this tutorial, http://scikit-image.org/docs/dev/auto_examples/color_exposure/plot_ihc_color_separation.html#sphx-glr-auto-examples-color-exposure-plot-ihc-color-separation-py
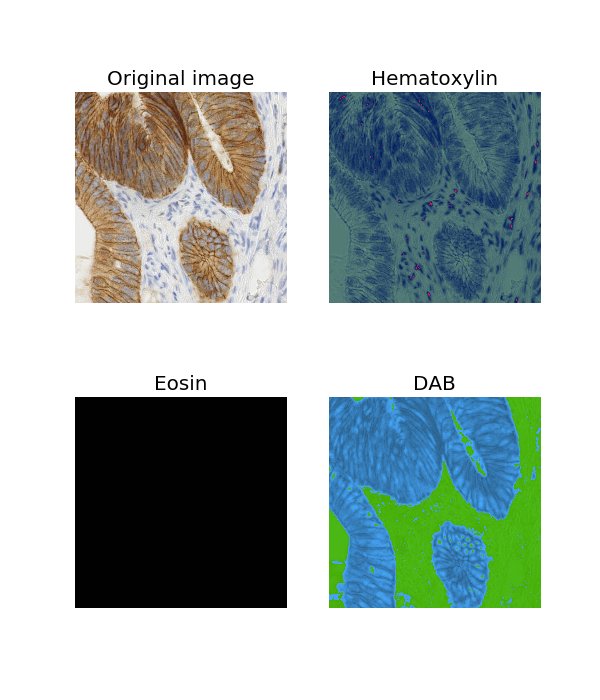
After color deconvolution the haematoxylin and DAB channels were plotted in grayscale but I want to show them in respective colors. For example, I want to show DAB channel in brown. Can anyone kindly post How to do that?
Thanks,
Koundinya

Juan Nunez-Iglesias
Aug 23, 2016, 10:08:03 PM8/23/16
to scikit...@googlegroups.com
Hi Koundinya,
It looks like this is not a trivial question, because the conversion between the two spaces is nonlinear. See the code here:
I originally thought that it would be possible to convert each channel separately, but the `exp` call makes this either difficult or impossible (I haven't yet decided which, but I wasn't able to get it to work in a short amount of time).
Here's my initial attempt, which was a complete failure, for the record:
In [1]: from skimage import data
In [2]: from skimage.color import rgb2hed
In [3]: from skimage.color import hed2rgb
In [4]: import matplotlib.pyplot as plt
In [5]: ihc_rgb = data.immunohistochemistry()
In [6]: ihc_hed = rgb2hed(ihc_rgb)
In [8]: import numpy as np
In [9]: h, e, d = np.transpose(ihc_hed, (2, 0, 1))
In [10]: empty = np.zeros_like(h)
In [11]: h_rgb = hed2rgb(np.dstack((h, empty, empty)))
In [12]: e_rgb = hed2rgb(np.dstack((empty, e, empty)))
In [13]: d_rgb = hed2rgb(np.dstack((empty, empty, d)))
In [14]: fig, axes = plt.subplots(2, 2, figsize=(6, 7), sharex=True,
...: sharey=True,
...: subplot_kw={'adjustable': 'box-forced'})
In [15]: axes[0, 0].imshow(ihc_rgb); axes[0, 0].set_title('Original image')
Out[15]: <matplotlib.text.Text at 0x121357438>
In [16]: axes[0, 1].imshow(h_rgb); axes[0, 1].set_title('Hematoxylin')
Out[16]: <matplotlib.text.Text at 0x121371c18>
In [17]: axes[1, 0].imshow(e_rgb); axes[1, 0].set_title('Eosin')
Out[17]: <matplotlib.text.Text at 0x1210684e0>
In [18]: axes[1, 1].imshow(d_rgb); axes[1, 1].set_title('DAB')
Out[18]: <matplotlib.text.Text at 0x1219315f8>
In [19]: for ax in axes.ravel():
...: ax.axis('off')
Result:
Maybe someone else in the list has some ideas?
Juan.
--
You received this message because you are subscribed to the Google Groups "scikit-image" group.
To unsubscribe from this group and stop receiving emails from it, send an email to scikit-image...@googlegroups.com.
To post to this group, send email to scikit...@googlegroups.com.
To view this discussion on the web, visit https://groups.google.com/d/msgid/scikit-image/74882dde-6af5-4cb8-a02d-debd5e2e1678%40googlegroups.com.
For more options, visit https://groups.google.com/d/optout.
Message has been deleted

Cedric Espenel
Aug 26, 2016, 12:17:42 AM8/26/16
to scikit-image
Hi Koundinya,

I'm not sure if that will answer your question but if you try:

from matplotlib.colors import LinearSegmentedColormap
cmap_Hema = LinearSegmentedColormap.from_list('mycmap', ['white', 'navy'])
cmap_DAB = LinearSegmentedColormap.from_list('mycmap', ['white',
'saddlebrown'])
cmap_Eosin = LinearSegmentedColormap.from_list('mycmap', ['darkviolet',
'white'])

You won't be able to get back to the original color but it will do a descent job: 
Sincerely,

Cedric
Koundinya Desiraju
Aug 30, 2016, 3:56:19 AM8/30/16
to scikit-image
Thank you Cedric. That helped a lot.
Regards,
Koundinya
--
You received this message because you are subscribed to a topic in the Google Groups "scikit-image" group.
To unsubscribe from this topic, visit https://groups.google.com/d/topic/scikit-image/yumvSsa7irc/unsubscribe.
To unsubscribe from this group and all its topics, send an email to scikit-image...@googlegroups.com.
To post to this group, send email to scikit...@googlegroups.com.
To view this discussion on the web, visit https://groups.google.com/d/msgid/scikit-image/5394a2f0-98a1-4254-ac14-851e9c956bb7%40googlegroups.com.

Stefan van der Walt
Aug 30, 2016, 1:31:08 PM8/30/16
to scikit...@googlegroups.com
On Tue, Aug 30, 2016, at 00:56, Koundinya Desiraju wrote:
Thank you Cedric. That helped a lot.
Would you like to add this to the gallery example, so that other users can do the same?
Stéfan
Stefan van der Walt
Aug 31, 2016, 7:35:54 PM8/31/16
to scikit...@googlegroups.com
On Mon, Aug 22, 2016, at 22:40, Koundinya Desiraju wrote:
In this tutorial, http://scikit-image.org/docs/dev/auto_examples/color_exposure/plot_ihc_color_separation.html#sphx-glr-auto-examples-color-exposure-plot-ihc-color-separation-pyAfter color deconvolution the haematoxylin and DAB channels were plotted in grayscale but I want to show them in respective colors. For example, I want to show DAB channel in brown. Can anyone kindly post How to do that?
Cedric submitted a PR to add this to the examples gallery: https://github.com/scikit-image/scikit-image/pull/2279
Please review!
Thanks
Stéfan
Stéfan
Reply all
Reply to author
Forward
0 new messages