Sample Sufficiency and The number of modes to retain for analysis
173 views
Skip to first unread message

S Arbabi
Dec 16, 2021, 8:01:45 AM12/16/21
to scalismo
Dear Scalismo Community,
Once the shape model is generated, it's an important question, "how many of the shape modes of variations should be retained for later analysis?"
I see some studies proposing "parallel analysis" for this purpose and methods based on the level of noise.
I see some studies proposing "parallel analysis" for this purpose and methods based on the level of noise.
Also another question in studies involving statistical shape models is the sufficiency of the sample size, I also see some statistical methods based on bootstrap analysis.
I was wondering is there a straightforward part in scalismo implementation or documnetations or any useful resources here?
Best wishes,
Saeed
S Arbabi
Dec 16, 2021, 11:08:49 AM12/16/21
to scalismo
For instance in case of "Horn's parallel analysis", as applied in Paulsen et al. it says:
"the eigenvalues of shapes should be compared with those obtained for equivalent uncorrelated data, obtained by randomly scrambling each row in the shape matrix D."
There's a website for easily performing parallel analysis : https://smishra.ku.edu/parallelengine.htm
Let's say we created a shape model from 50 shapes each with 1000 points..
Can someone add what would be the variables it this website? there are two variables to set:
"
Number of Variables in your Dataset to be Factor Analyzed"
and
"
Sample Size of Your dataset "
so is the number of variables 1000 and the sample size 50?
Can someone elaborate a bit on it?
Best wishes,
Saeed

Max
Dec 16, 2021, 12:15:14 PM12/16/21
to scalismo
Hi Saeed,
without looking into details I would say that the number of variables is 50, and the sample size is 3 * 1000 = 3000. This is because your data matrix D (on which you apply PCA) is of size nd x m, where n is the number of points per shape, d is the dimension of the points (d = 3 here), and m is the number of shapes. As far as I understand Horn's method generates a random matrix of same dimension as the data matrix and computes its eigenvalues. Thus, the variables from the website must be chosen from {50, 3000}.
It would be really cool if you could share your code/experience if you make it work as I haven't tested this method yet.
It would be really cool if you could share your code/experience if you make it work as I haven't tested this method yet.
Best
Max
P.S.: For those who don't know the paper from Paulsen et al. -- it's here: https://link.springer.com/content/pdf/10.1007/3-540-45787-9_47.pdf.
P.S.: For those who don't know the paper from Paulsen et al. -- it's here: https://link.springer.com/content/pdf/10.1007/3-540-45787-9_47.pdf.
S Arbabi
Dec 16, 2021, 1:28:27 PM12/16/21
to scalismo
Thank you Max for the discussion,
So let me share what I did:
attached is the screenshot of my calculations. I have 33 shapes, each with 5166 points which leads to 15498 sample size as you said. I put these numbers in the parallel analysis calculator and gives me the results as attached.
attached is the screenshot of my calculations. I have 33 shapes, each with 5166 points which leads to 15498 sample size as you said. I put these numbers in the parallel analysis calculator and gives me the results as attached.
then in my actually generated shape model I calculated the cumulative sum and all eigen values, which is shown in the second screenshot.
then for deciding till which shape mode to retain, in this video on youtube https://www.youtube.com/watch?v=K_1ReSJXXm8 it makes a comparison between results of the two for decision. it is said in minute 8:48 when it gets the results and compares. which is somehow confusing with the results that I have.
Could anyone shed some light on it?
Best,
Saeed
Max
Dec 16, 2021, 7:04:26 PM12/16/21
to scalismo
Hi Saeed,
after reading some papers I guess the problem is the following: the distribution from which the random data is drawn doesn't match the actual data distribution (from which D is drawn). I guess the distribution from which the random data is drawn is just a standard normal distribution (zero mean, unit variance). As such, you need to standardize the data matrix D before applying PCA. In other words, (1) calculate the mean over the columns of D (which is nothing but the mean shape), (2) subtract it from each column in D, (3) calculate the standard deviation over columns of D, and (4) divide each column by it. Finally, apply PCA to the standardized data matrix and compare its eigenvalues to those generated by the website.
As an alternative approach, you could also try to implement the 'random row shuffling' method as done by Paulsen et al. This was originally proposed by
Buja & Eyuboglu in 1992 (https://www.researchgate.net/profile/Nermin-Eyuboglu/publication/2623638_Remarks_on_Parallel_Analysis/links/004635324c3f90f004000000/Remarks-on-Parallel-Analysis.pdf). Besides, I found the following papers useful:
- Saccenti & Timmerman (2017).
Considering Horn’s Parallel Analysis from a Random Matrix Theory Point of View, see https://link.springer.com/content/pdf/10.1007/s11336-016-9515-z.pdf, and
- Timmerman & Lorenzo-Seva (2011). Dimensionality Assessment of Ordered Polytomous Items With Parallel Analysis, see https://www.researchgate.net/profile/Marieke-Timmerman/publication/51058719_Dimensionality_Assessment_of_Ordered_Polytomous_Items_With_Parallel_Analysis/links/5b4ee9de0f7e9b240fe913e9/Dimensionality-Assessment-of-Ordered-Polytomous-Items-With-Parallel-Analysis.pdf.
Best
Max
S Arbabi
Dec 17, 2021, 9:15:45 AM12/17/21
to scalismo
Thank you so much Max for the discussion,
The first approach like step by step you mentioned, means I would change the data (normalizing all point data of all shapes by subtracting from mean, and dividing by std), then applying PCA, which will mean the eigenvalues I will get at the end will not be the ones that I'm having now in my shape model. So that result will not be useful for my current study? is that right? or is it like I will be able to say I will retain the same number of shape modes from my non-normalized shape model?
for the second approach (row permutation), I see an algorithm in the paper you shared like this:
Initialization:
g Read data into an N×P matrix x.
g Compute the eigenvalues, and store them in a vector of length P.
g Initialize an integer vector nge of length P to zero (intended to count how often permutation eigen-
values exceed the observed ones).
g Allocate auxiliary data structures for permuted data, their eigenvalues, etc.
Repeat R times:
g Permute columns 2, ..., P of x, leaving the first column unchanged, using a separate random permuta-
tion for each column (see Noreen, 1989, for code).
g Obtain the eigenvalues of the permuted data.
g For i =1, ..., P, increase the count nge[i ] by one if the i-th eigenvalue is greater than or equal the ob-
served i-th eigenvalue.
Finally:
g Obtain p-values for each eigenvalue: ( nge[i ] + 1 ) / ( R + 1 ), (i =1, ..., P).
But still far from how to implement it for the case of shapes and SSM.
Do you have some ideas how to do that on SSM and shapes like the one we do in Scalismo?
BEst,
Saeed
S Arbabi
Jan 11, 2022, 7:06:58 AM1/11/22
to scalismo
Dear Scalismoers,
I was wondering if you have a suggestion regarding an approach for finding the most significant shape modes of variations in SSM we create using Scalismo?
I see some studies use methods like parallel analysis but is there any implementation of it in Scalismo? I honestly have little clues how to implement it for my model and I still need to make sure I'm taking just the meaningful shape modes for later analyses. Before, I was thinking of using just the shape modes that show more than some specific amount of total variance in the population (found in compactness test) but the threshold as well as correctness of such approach is something I couldn't test. So that's why I was thinking of a more formal method for this purpose.
I would be thankful if you could give some advice on this.
Best wishes,
Saeed
Saeed
S Arbabi
Jan 13, 2022, 11:06:14 AM1/13/22
to scalismo
Dear Marcel and Scalismo team,
I would be thankful if I can have your comment on this.
To me it seem like this is a point that anyone who uses a shape model in a publication, needs to address in some form. Discussing how many shape modes we used for later analysis and how many of them carry the most relevant information over noise and why!
Do you suggest any straightforward way for doing this? is it maybe implemented somewhere in Scalismo?
Best wishes,
Saeed
Saeed

Marcel Luethi
Jan 14, 2022, 10:21:06 AM1/14/22
to S Arbabi, scalismo
Dear Saeed,
I have not a very well informed opinion about these points. My background in geometric morphometry and formal shape statistics is pretty weak and it is likely that I am missing some important points.
Anyway, here are some of my thoughts on the topic:
In my own work I always use all the modes of the model. The example meshes that I use for building the models are usually obtained from a GPMM based registration, which itself regularizes the results already quite strongly. As there is not much noise in the data from which I build the model, I don't see a reason to throw away components with small eigenvalues. To test the validity of the models, I usually sample shapes from the model and see if the samples look reasonable. I also think a simple leave one out test to see if the model can represent the shapes is very useful. However, also here I find it more informative to visualize areas where the model does not fit we, rather than just reporting (and optimizing) a number such as the square error integrated over the surface.
I think much more interesting than obsessing about the measures of model quality, it is to do a thorough analysis of the result after you applied the model to a particular fitting task. Does your fitted model provide a good explanation for the missing data that you would like to explain using your model? Does it represent the uncertainty you would expect? Is your method sensitive to small changes in the parameter values? Does slightly changing your model result in totally different results?
I very much like the workflow outlined in the paper "Bayesian workflow" by Gelman et al. https://arxiv.org/abs/2011.01808 . The paper talks about statistical analysis in general, but I think many of the lessons can be carried over to our domain.
I would be curious to hear what others think.
Best,
Marcel
--
You received this message because you are subscribed to the Google Groups "scalismo" group.
To unsubscribe from this group and stop receiving emails from it, send an email to scalismo+u...@googlegroups.com.
To view this discussion on the web visit https://groups.google.com/d/msgid/scalismo/509f84f0-570c-4f62-bb17-9d8aa4a47e73n%40googlegroups.com.
S Arbabi
Jan 30, 2022, 10:57:57 AM1/30/22
to scalismo
Dear Max, Marcel, all,
Just to share my experience with parallel analysis, in case anyone else also wants to use a systematic method for finding the number of shape modes to retain:
-I extracted the shape matrix from my registered dataset to a csv file using this small scala code (I have 33 shapes, including reference, each having 5166 points in their pointset):
package com.example
import java.io.{BufferedWriter, File, FileWriter, FilenameFilter}
import scalismo.io.MeshIO
object extractShapeMatrix {
def main(args: Array[String]): Unit = {
scalismo.initialize()
implicit val rng = scalismo.utils.Random(42)
val shapesDir = "E:\\data\\"
val shapes = new File(shapesDir).listFiles(new FilenameFilter {
override def accept(dir: File, name: String): Boolean = name.endsWith(".stl")
}).map(shapeFile=>
MeshIO.readMesh(shapeFile).get
)
var result = ""
(0 to shapes.length-1 by 1).foreach { shapeNum =>
println("processing shape #"+shapeNum)
val shapePointsIterator = shapes(shapeNum).pointSet.points.zipWithIndex.map{case(p,i) => (p.x, p.y, p.z)}
while(shapePointsIterator.hasNext){
val next = shapePointsIterator.next()
result = result + next._1 + ","+ next._2 + "," + next._3 + ","
}
result = result + "\n"
}
val outputFile = new File(shapesDir+"shapeMatrix.csv")
val bw = new BufferedWriter(new FileWriter(outputFile))
bw.write(result)
}
}
then in this piece of python code, I'm reading this shape matrix in a pandas dataframe, mean-std normalize it, then generate a random shape matrix from the same distribution and the same size and calculate the PCA for both real and random dataset.
import pandas as pd
import numpy as np
from sklearn.decomposition import PCA
import matplotlib.pyplot as plt
shapeMatrix = pd.read_csv("E:\\data\\shapeMatrix.csv")
shapeMatrix.dropna(axis=1, inplace=True)
normalized_shapeMatrix=(shapeMatrix-shapeMatrix.mean())/shapeMatrix.std()
pca = PCA(shapeMatrix.shape[0]-1)
pca.fit(normalized_shapeMatrix)
transformedShapeMatrix = pca.transform(normalized_shapeMatrix)
#np.savetxt("pca_data.csv", pca.explained_variance_, delimiter=",")
random_eigenvalues = np.zeros(shapeMatrix.shape[0]-1)
for i in range(10):
random_shapeMatrix = pd.DataFrame(np.random.normal(0, 1, [shapeMatrix.shape[0], shapeMatrix.shape[1]]))
pca_random = PCA(shapeMatrix.shape[0]-1)
pca_random.fit(random_shapeMatrix)
transformedRandomShapeMatrix = pca_random.transform(random_shapeMatrix)
random_eigenvalues = random_eigenvalues+pca_random.explained_variance_ratio_
random_eigenvalues = random_eigenvalues / 10
#np.savetxt("pca_random.csv", random_eigenvalues, delimiter=",")
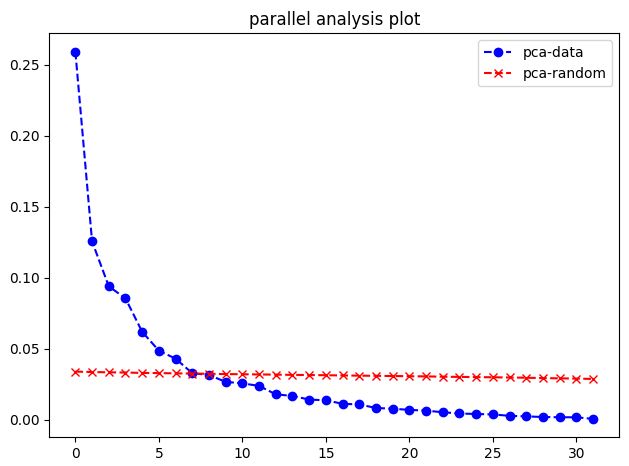
plt.plot(pca.explained_variance_ratio_, '--bo', label='pca-data')
plt.plot(random_eigenvalues, '--rx', label='pca-random')
plt.legend()
plt.title('parallel analysis plot')
plt.show()
import numpy as np
from sklearn.decomposition import PCA
import matplotlib.pyplot as plt
shapeMatrix = pd.read_csv("E:\\data\\shapeMatrix.csv")
shapeMatrix.dropna(axis=1, inplace=True)
normalized_shapeMatrix=(shapeMatrix-shapeMatrix.mean())/shapeMatrix.std()
pca = PCA(shapeMatrix.shape[0]-1)
pca.fit(normalized_shapeMatrix)
transformedShapeMatrix = pca.transform(normalized_shapeMatrix)
#np.savetxt("pca_data.csv", pca.explained_variance_, delimiter=",")
random_eigenvalues = np.zeros(shapeMatrix.shape[0]-1)
for i in range(10):
random_shapeMatrix = pd.DataFrame(np.random.normal(0, 1, [shapeMatrix.shape[0], shapeMatrix.shape[1]]))
pca_random = PCA(shapeMatrix.shape[0]-1)
pca_random.fit(random_shapeMatrix)
transformedRandomShapeMatrix = pca_random.transform(random_shapeMatrix)
random_eigenvalues = random_eigenvalues+pca_random.explained_variance_ratio_
random_eigenvalues = random_eigenvalues / 10
#np.savetxt("pca_random.csv", random_eigenvalues, delimiter=",")
plt.plot(pca.explained_variance_ratio_, '--bo', label='pca-data')
plt.plot(random_eigenvalues, '--rx', label='pca-random')
plt.legend()
plt.title('parallel analysis plot')
plt.show()
comparing the eigenvalue ratios for the first components shows till which component the eigenvalue of data is greater than eigenvalue of random samples, which is an indicator of the number of shape modes to retain (8 modes in this example). this is the chart that this code generates (figure in the attachment)
I'd be grateful if you can share your opinion with me in this regard.
Best wishes,
Saeed
Saeed
Reply all
Reply to author
Forward
0 new messages