Local Standard of Rest
176 views
Skip to first unread message

Kevin Wilson
Jul 4, 2021, 3:13:32 AM7/4/21
to Society of Amateur Radio Astronomers
This conversation started in another thread, where I received helpful input from several people. One thing that Wolfgang had note was that I needed to take account for the earth's rotation and motion around the sun, both of which would contribute to the shift of the spectrum of the H1 line.
In other words, I needed to shift the graph in the frame of the local standard of rest velocity (VSLR).
I've noticed several other people talking about VSLR, so I thought I would start another thread on the subject to show my rudimentary attempts to address it. I'm also hoping Wolfgang will take a look at it to correct any problems with my understanding of the subject, and I thought my attempt with the code might help him with the article he is writing on this subject.
I found that Astropy has a new class in v.4.1 that facilitates the transform from a relative framework to the VLSR. It is still experimental, but I am working to see if I can integrate it into the Virgo Project (https://github.com/0xCoto/Virgo), which is the package I use for observation and digital signal processing.
Here is the code I wrote. An explanation follows.
from astropy import units as u
from astropy.coordinates import SpectralCoord, EarthLocation, SkyCoord
from astropy.time import Time
obs_location = EarthLocation.from_geodetic(39.007381, -76.865123, 47.8536)
obs_location = obs_location.get_itrs(obstime=Time('2021-06-29T03:51:00'))
obs_coord = SkyCoord('19h18m50.0s 11d38m04.3s', frame='icrs')
frequency = SpectralCoord(1420e6 * u.MHz, observer=obs_location, target=obs_coord)
frequency = frequency.with_observer_stationary_relative_to('lsr')
The first section imports the classes that are needed for the transform.
In line 5, I create an EarthLocation object by providing the latitude, longitude, and elevation of the place where I made my observations.
In line 6, I use that location and the time of the observation to create a location in the International Terrestrial Reference System (ITRS). This location is stationary with respect to the sun, so it effectively makes the observation spot motionless with respect to the sun (i.e., it compensates for earth's orbital and rotational velocities).
Line 7 creates a SkyCoord object for the target I was viewing. It creates this from the RA and Dec. The object is in the International Celestial Reference System (ICRS). so its location is plotted with respect to the sun.
I then create a SpectralCoord by passing in the center frequency of my observation (I could also have passed in an array of all frequencies I was observing), along with my EarthLocation and SkyCoord. This creates an object that holds all the information about my observation. The frequency is the center frequency expected if both the target and the location site are moving relative to the sun.
In line 9, I do the last bit of the transform. Taking the SpectralCoord object created in the previous step, I shift the reading into the frame of the VLSR, which takes into account the standard motion of our local area so that the frequency is adjusted to compensate for the motion of both the sun and the target, which should give the precise reading I need.
The Virgo program takes bins of readings and knows what their frequencies are. The frequencies are not stored with the data, so they are recreated for the plot using the center frequency and numpy's linspace method. By passing in the expected center frequency with respect to the VLSR, it shifts the frequencies of the individual bins to the proper frame of reference.
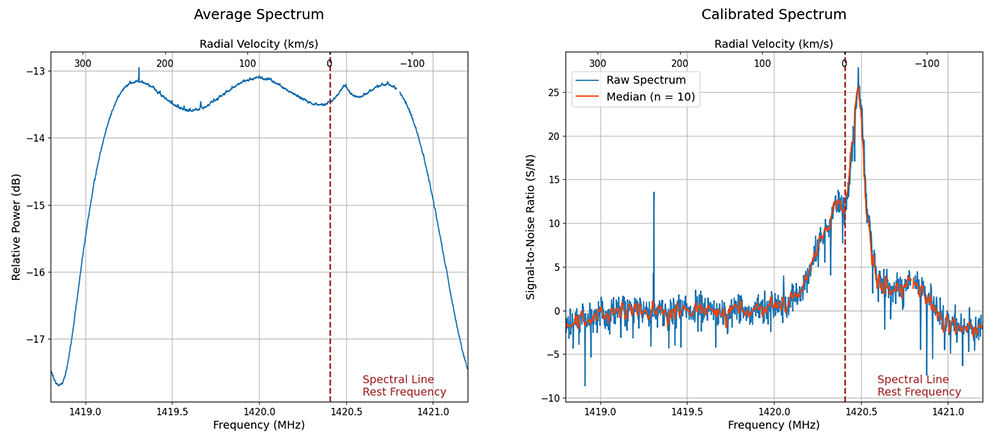
To test whether I had done the transform correctly, I used a 5-minute integration I had taken on June 28 at 23:51 EDT (which is the date I used above in the time step but adjusted to UTC). First, here is the uncorrected spectrum in both uncalibrated and calibrated form. Although I was scanning in galactic quadrant 1, much of the reading is blue shifted. As Wolfgang noted in a previous thread, this is the shape of the spectrum we would expect in that area, but it is too far to the right. (Sorry, Wolfgang, but I haven't worked on reversing the plot for the radial velocity yet.)
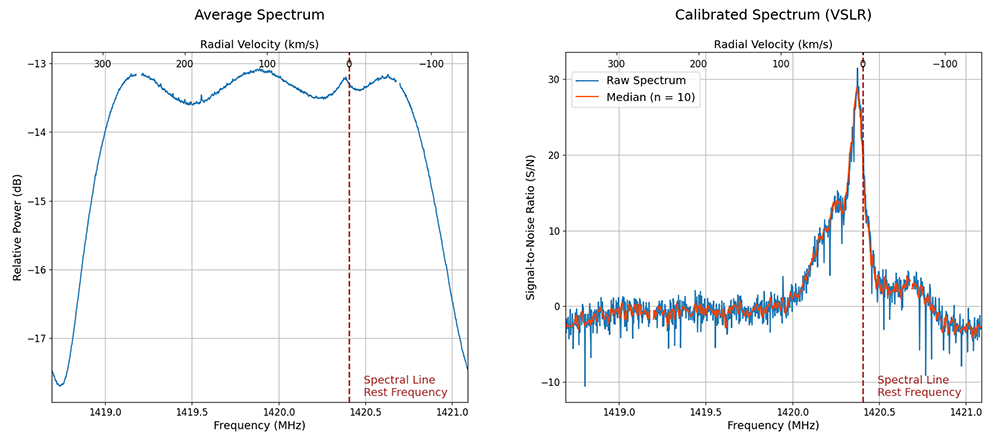
The graph below shows the same data plotted with compensation for the earth's motion. You will notice that the plot has moved to the right, and now shows the main spike with the expected red shift (Sagittarius Arm) and the smaller spike with a blue shift (Perseus Arm).
Since this aligns with what would be expected for this region, I take that as a good sign. Of course, I need to test it on multiple sets of data to confirm it, but I'm hoping this is at least a step in the right direction.

fasleitung3
Jul 5, 2021, 9:15:33 AM7/5/21
to sara...@googlegroups.com
From a fist look this should work. However, there is one caveat: Astropy uses a definition of the peculiar motion of the sun which is not standard in radio astronomy. This results in velocities not beeing in line with radio astronomy conventions (I found differences up to 3 km/s). So probably the last line needs to be modified.
I will deal with this in my upcoming article.
Cheers,
Wolfgang
--
--
You received this message because you are subscribed to the Google
Groups "Society of Amateur Radio Astronomers" group.
To post to this group, send email to sara...@googlegroups.com
To unsubscribe from this group, send email to
sara-list-...@googlegroups.com
For more options, visit this group at
http://groups.google.com/group/sara-list?hl=en
---
You received this message because you are subscribed to the Google Groups "Society of Amateur Radio Astronomers" group.
To unsubscribe from this group and stop receiving emails from it, send an email to sara-list+...@googlegroups.com.
To view this discussion on the web visit https://groups.google.com/d/msgid/sara-list/1fd793fd-48e3-4368-b6c3-1a1368f120a3n%40googlegroups.com.
Kevin Wilson
Jul 5, 2021, 12:45:39 PM7/5/21
to sara...@googlegroups.com
Astropy defines three different lsrs: lsr, lsrk, and lsrd. Is any of these more standard than the others?
You received this message because you are subscribed to a topic in the Google Groups "Society of Amateur Radio Astronomers" group.
To unsubscribe from this topic, visit https://groups.google.com/d/topic/sara-list/w1NuJk2bLCM/unsubscribe.
To unsubscribe from this group and all its topics, send an email to sara-list+...@googlegroups.com.
To view this discussion on the web visit https://groups.google.com/d/msgid/sara-list/0f25f886c54a8b0e1ad73add9ef06a118852c215.camel%40googlemail.com.
fasleitung3
Jul 5, 2021, 2:27:18 PM7/5/21
to sara...@googlegroups.com
I checked in the source code of Astropy and it seems that lsrk has the normally used set of parameters.
Wolfgang
Am Montag, den 05.07.2021, 12:45 -0400 schrieb Kevin Wilson:
Astropy defines three different lsrs: lsr, lsrk, and lsrd. Is any of these more standard than the others?
On Mon, Jul 5, 2021, 9:15 AM 'fasleitung3' via Society of Amateur Radio Astronomers <sara...@googlegroups.com> wrote:
From a fist look this should work. However, there is one caveat: Astropy uses a definition of the peculiar motion of the sun which is not standard in radio astronomy. This results in velocities not beeing in line with radio astronomy conventions (I found differences up to 3 km/s). So probably the last line needs to be modified.I will deal with this in my upcoming article.Cheers,WolfgangAm Sonntag, den 04.07.2021, 00:13 -0700 schrieb Kevin Wilson:
This conversation started in another thread, where I received helpful input from several people. One thing that Wolfgang had note was that I needed to take account for the earth's rotation and motion around the sun, both of which would contribute to the shift of the spectrum of the H1 line.In other words, I needed to shift the graph in the frame of the local standard of rest velocity (VSLR).
I've noticed several other people talking ab'out VSLR, so I thought I would start another thread on the subject to show my rudimentary attempts to address it. I'm also hoping Wolfgang will take a look at it to correct any problems with my understanding of the subject, and I thought my attempt with the code might help him with the article he is writing on this subject.

Marcus D Leech
Jul 5, 2021, 4:20:11 PM7/5/21
to sara...@googlegroups.com
So anyone know how to make an older version of Astropy fetch that IERS data from somewhere other than the navy.mil server that no longer is reachable?
Sent from my iPhone
On Jul 5, 2021, at 2:27 PM, 'fasleitung3' via Society of Amateur Radio Astronomers <sara...@googlegroups.com> wrote:
To view this discussion on the web visit https://groups.google.com/d/msgid/sara-list/7f3638fb59c982d40a3eff8e409047164b47f9f6.camel%40googlemail.com.
Kevin Wilson
May 17, 2022, 1:34:53 PM5/17/22
to sara...@googlegroups.com
Wolfgang,
Did you ever get around to writing that article on using Astropy to calculate VLSR?
You received this message because you are subscribed to a topic in the Google Groups "Society of Amateur Radio Astronomers" group.
To unsubscribe from this topic, visit https://groups.google.com/d/topic/sara-list/w1NuJk2bLCM/unsubscribe.
To unsubscribe from this group and all its topics, send an email to sara-list+...@googlegroups.com.
To view this discussion on the web visit https://groups.google.com/d/msgid/sara-list/7f3638fb59c982d40a3eff8e409047164b47f9f6.camel%40googlemail.com.
fasleitung3
May 18, 2022, 3:47:38 PM5/18/22
to sara...@googlegroups.com
Yes, it was published in the July-August 2021 issue of the SARA journal.
Wolfgang
Kevin Wilson
May 18, 2022, 7:02:38 PM5/18/22
to sara...@googlegroups.com
Thanks. I must have missed it. I'll check on it.
--
--
You received this message because you are subscribed to the Google
Groups "Society of Amateur Radio Astronomers" group.
To post to this group, send email to sara...@googlegroups.com
To unsubscribe from this group, send email to
sara-list-...@googlegroups.com
For more options, visit this group at
http://groups.google.com/group/sara-list?hl=en
---
You received this message because you are subscribed to a topic in the Google Groups "Society of Amateur Radio Astronomers" group.
To unsubscribe from this topic, visit https://groups.google.com/d/topic/sara-list/w1NuJk2bLCM/unsubscribe.
To unsubscribe from this group and all its topics, send an email to sara-list+...@googlegroups.com.
To view this discussion on the web visit https://groups.google.com/d/msgid/sara-list/fc7e278ba8ea5e07859d89b76ceacf2794c59884.camel%40googlemail.com.
Reply all
Reply to author
Forward
0 new messages