Data Post Processing
108 views
Skip to first unread message

49j...@gmail.com
Apr 13, 2021, 12:55:32 PM4/13/21
to Society of Amateur Radio Astronomers
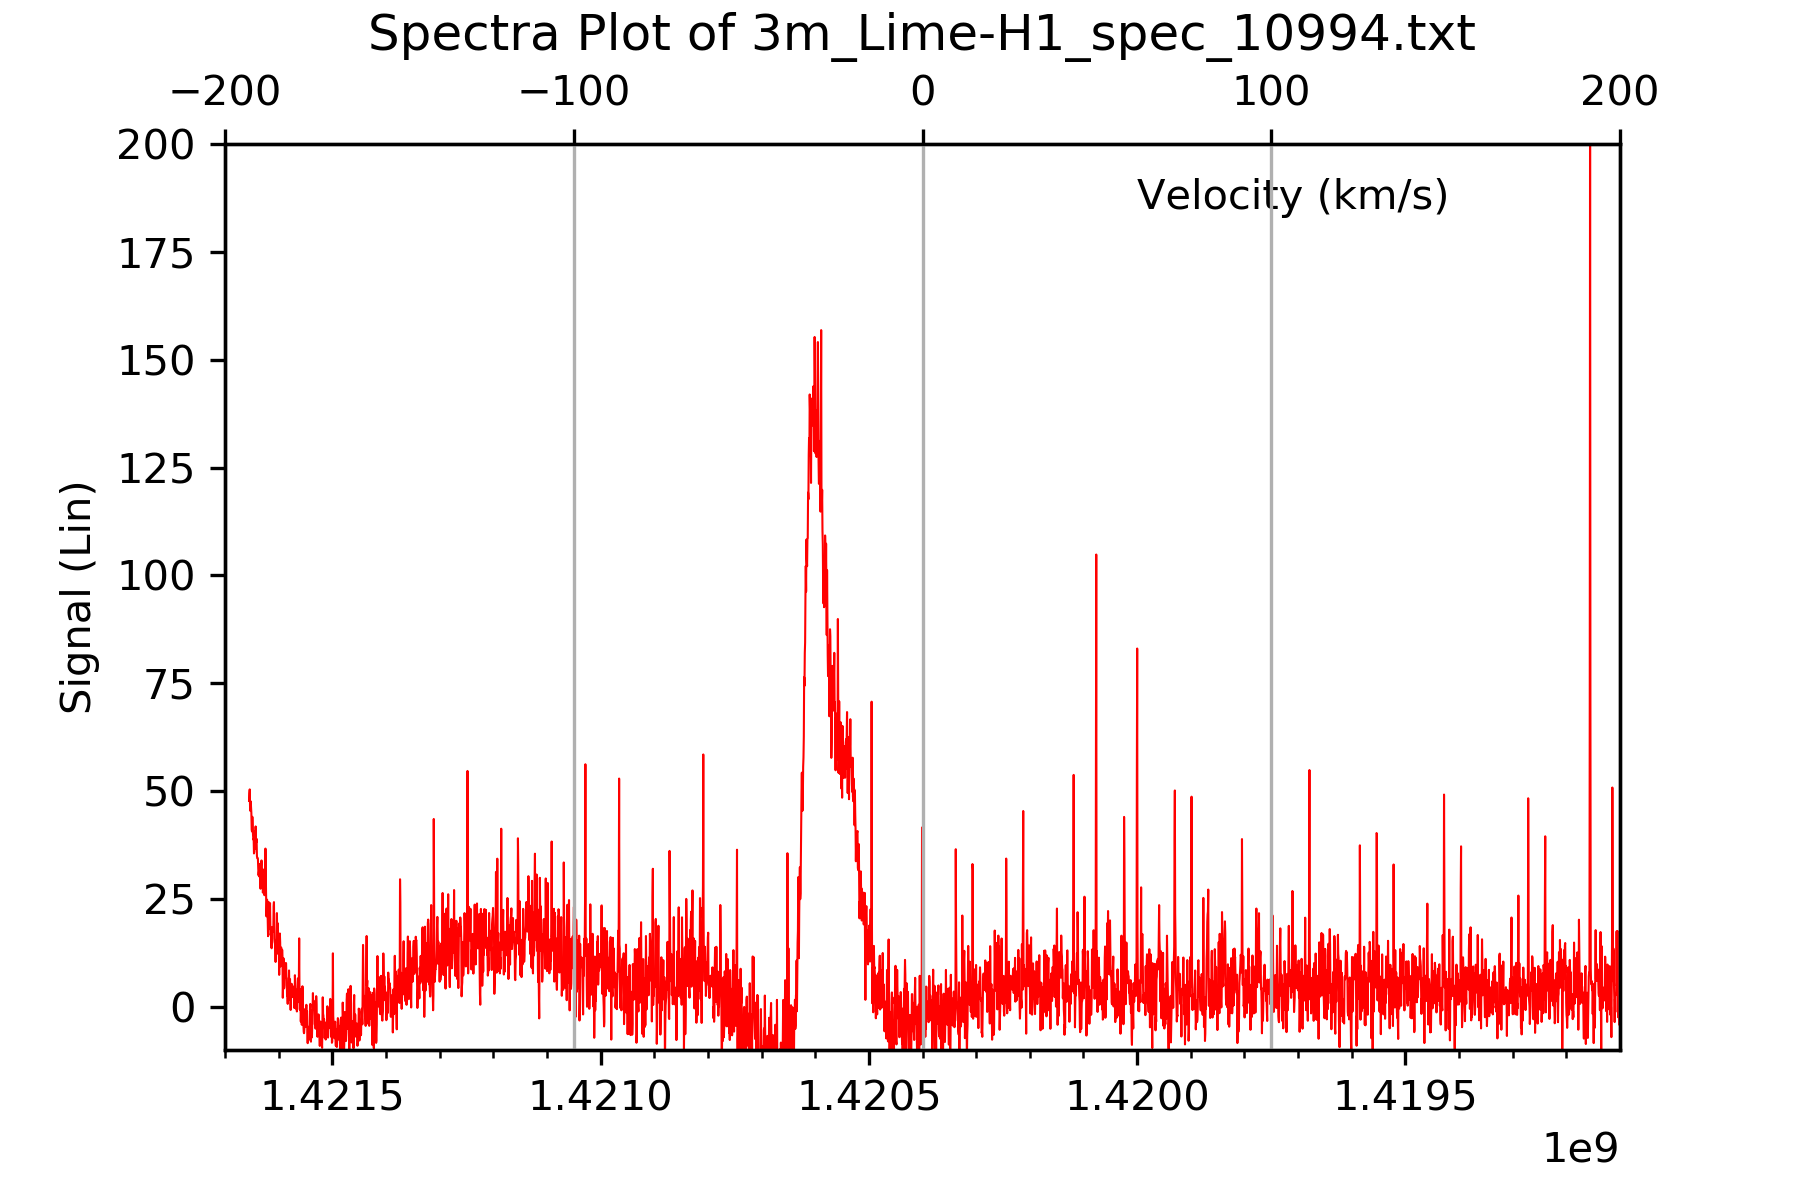
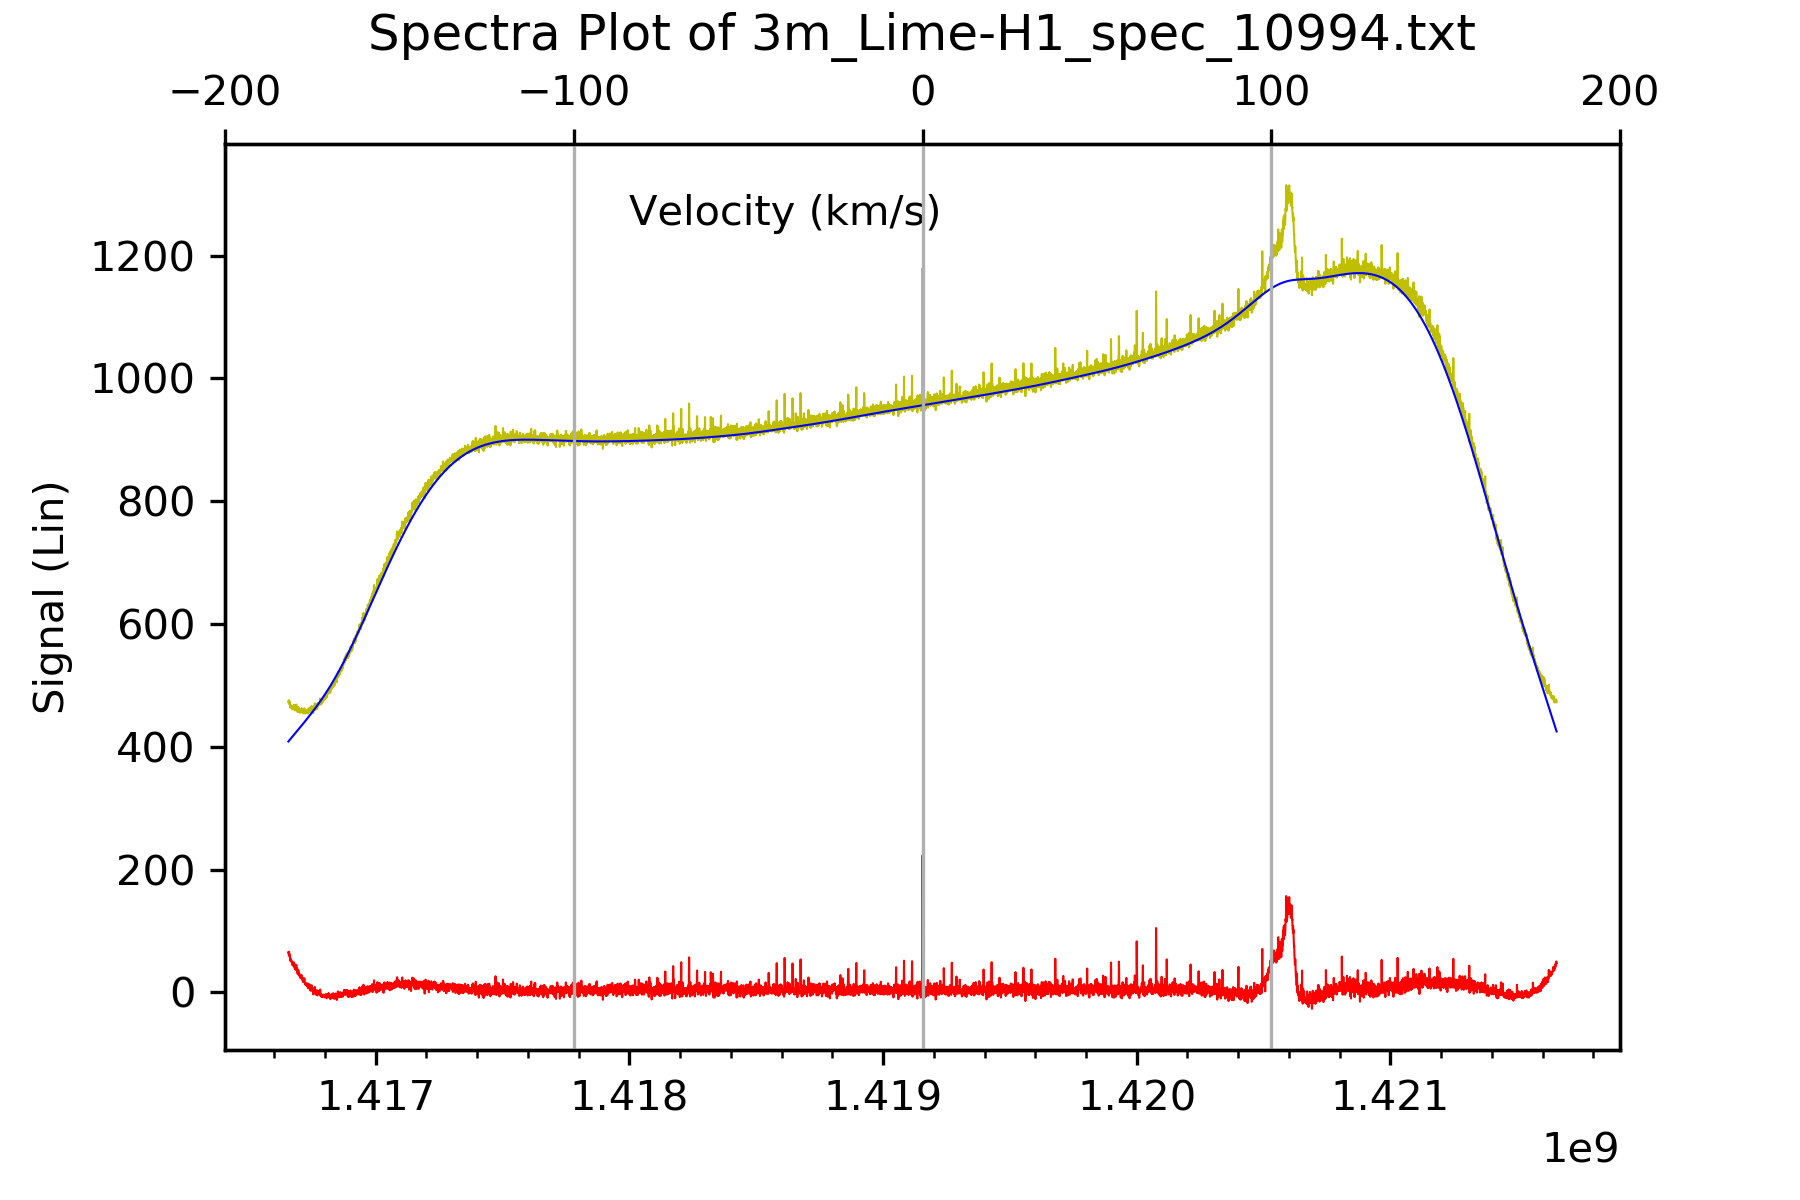
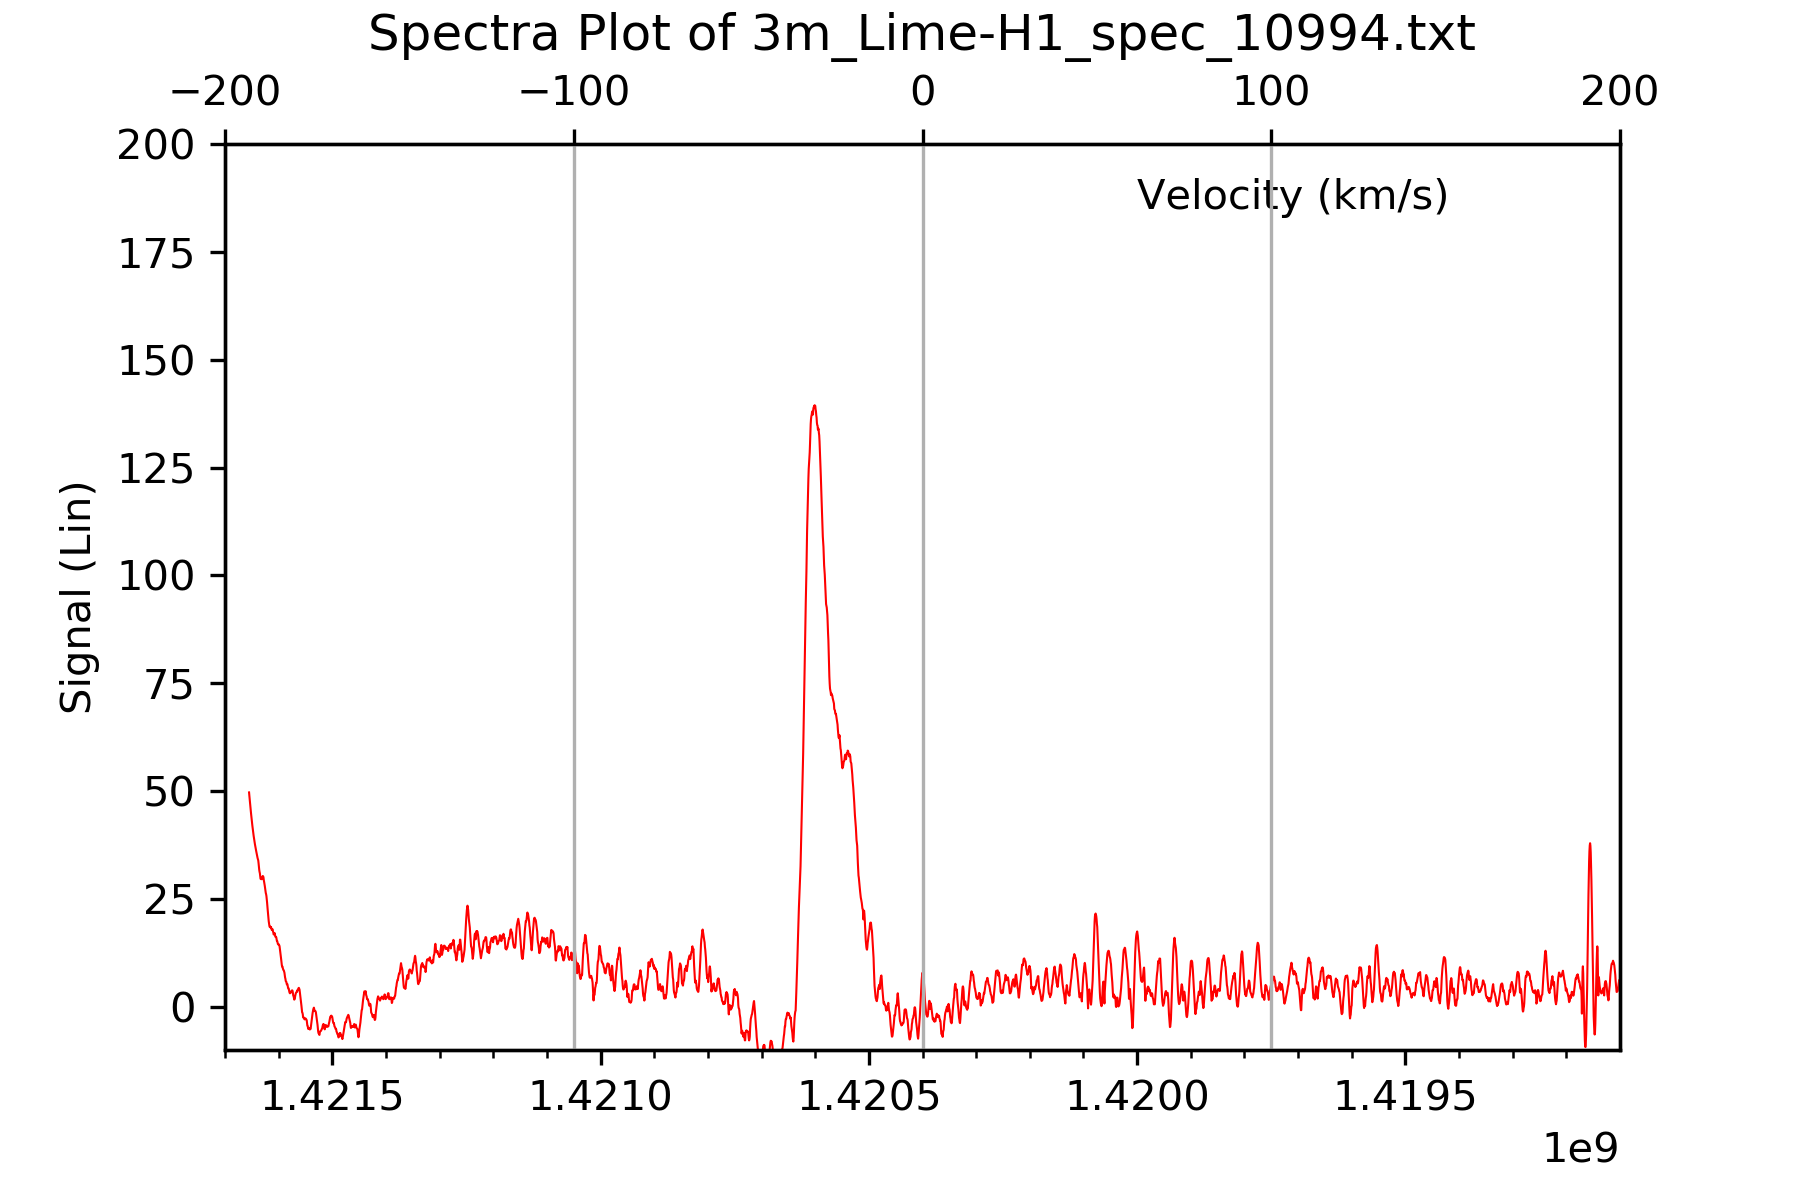
I know that the attached information may be old hat to some of you in this Group, however there are most likely those who are new to processing data, like myself, that will hopefully find this useful. There are two Python programs here that first extract signal and frequency data from an H1 spectra FITS file, in an 8192x2 array. The second program uses that data to plot an H1 spectra, correcting for baseline and smoothing the data. The baseline correction is based on the scipy library and is from a paper by P. Eilers and H. Boelens in 2005. The smoothing is part of the scipy.signal package and is a Savitzky-Golay filter. The first plot shows the uncorrected data, the derived baseline and the corrected plot. The second plot is the corrected data without smoothing, and the last plot is the corrected and smoothed data. I have compared this to the results that I get from the GILDAS/CLASS program, and to me, it looks good. If you find this helpful please feel free to use it. Also, any critique is welcomed.
Jack

fasleitung3
Apr 15, 2021, 3:57:57 AM4/15/21
to sara...@googlegroups.com
Thank you Jack, for sharing your code.
While GILDAS/CLASS do a god job in working with single spectra, it is too cumbersome to use on large number of spectra. At least I have not yet found a good method to process a large number of spectra. I should probably dig deeper into scripting within CLASS.
Due to this, I have written a Python script which is somewhat similar to yours. In my case I am using "lmfit" to do the baseline fitting. There is one challenge with fitting the baseline which can also be seen in your example: One needs to exclude the range of the actual signal from the fit, otherwise one will get a "bump" in the area of the actual signal. This can be seen in your 3m_Lime-H1_spec_10994_1.png plot. I avoid this by setting a window around the signal where the weighting of data points is set to zero. This is pretty much the same as one does when using CLASS.
The problem with that, however, is that the window needs to be placed differently depending on the doppler shift of the line. I still need to do some work to see how this could be done automatically in a reliable fashion.
My code is not in a state yet where I can share it. There are too many things which are specific to our data and too many places where the code needs to be adapted depending on circumstances.
So there is still some work ahead.....
Wolfgang
Am Dienstag, den 13.04.2021, 09:55 -0700 schrieb 49j...@gmail.com:
I know that the attached information may be old hat to some of you in this Group, however there are most likely those who are new to processing data, like myself, that will hopefully find this useful. There are two Python programs here that first extract signal and frequency data from an H1 spectra FITS file, in an 8192x2 array. The second program uses that data to plot an H1 spectra, correcting for baseline and smoothing the data. The baseline correction is based on the scipy library and is from a paper by P. Eilers and H. Boelens in 2005. The smoothing is part of the scipy.signal package and is a Savitzky-Golay filter. The first plot shows the uncorrected data, the derived baseline and the corrected plot. The second plot is the corrected data without smoothing, and the last plot is the corrected and smoothed data. I have compared this to the results that I get from the GILDAS/CLASS program, and to me, it looks good. If you find this helpful please feel free to use it. Also, any critique is welcomed.Jack
--
--
You received this message because you are subscribed to the Google
Groups "Society of Amateur Radio Astronomers" group.
To post to this group, send email to sara...@googlegroups.com
To unsubscribe from this group, send email to
sara-list-...@googlegroups.com
For more options, visit this group at
http://groups.google.com/group/sara-list?hl=en
---
You received this message because you are subscribed to the Google Groups "Society of Amateur Radio Astronomers" group.
To unsubscribe from this group and stop receiving emails from it, send an email to sara-list+...@googlegroups.com.
To view this discussion on the web visit https://groups.google.com/d/msgid/sara-list/4e4ba9cf-64c9-4669-9543-f100663e7280n%40googlegroups.com.
Jack Lobingier
Apr 15, 2021, 11:24:31 AM4/15/21
to Society of Amateur Radio Astronomers
Wolfgang, thank you for taking the time to look at this. First,
the three attachments, for use with CLASS as a script, allow me to read
in up to 1000 FITS files and to automate the processing of the data. If
this is the processing you are looking for, please feel free to modify
it and use it.
With respect to the baseline correction, like
you I have noticed that the correction should not be correcting in the
area of the actual signal. CLASS does a very good job of allowing us to
exclude that area. I have not yet figured out how to do that in
Python. I suppose that I could manually identify that segment in the
plot and substitute a straight line segment, or something like that,
into the baseline curve. The other issue that is a confusing one for me
is the generation and placement of the radial velocity axis plot on the
top x axis. To be honest, I understand Doppler shift and Radial
velocity, but I am not sure about all that should go into the
calculations for those top axis numbers to make them correct. Right now
I just tried to put numbers in there that copied what CLASS plotted.
Also, I have already made changes to the plotting program I attached
yesterday, as it now extracts the RA and DEC from the FITS header and
puts it on the plot. I have attached those as well. Thanks again for
looking at the stuff I sent yesterday.
Jack

Hamish Barker
Apr 16, 2021, 9:08:03 AM4/16/21
to sara...@googlegroups.com
if you are using a linux or raspberry pi, for large number of spectra, rtl-power-fftw is excellent and very fast.
you have to compile from source, here it is
no graphics/python overhead, it's a command line program so can feed gnuplot or other files. I get great results on 1420Mhz with an 85cm offset feed dish. Noise ripple in the spectra is down at about 0.01dB when averaging 400,000 spectra of 512 bins at 2.5Mhz sampling (about 20 minutes total integration), while peak signal when the milky way core is passing is about 0.8dB. the program takes the IQ feed from the rtl dongle continuously so no huge files are stored. I run mine on a very old raspberry pi 1B and it works fine at 2.5Mhz sampling, the maximum which the rtl-sdr dongle can do.
To view this discussion on the web visit https://groups.google.com/d/msgid/sara-list/d611b12b776c7501c7d6e2d50d601591415ede73.camel%40googlemail.com.
Jack Lobingier
Apr 16, 2021, 9:08:03 AM4/16/21
to sara...@googlegroups.com
Wolfgang, thank you for taking the time to look at this. First, the three attachments, for use with CLASS as a script, allow me to read in up to 1000 FITS files and to automate the processing of the data. If this is the processing you are looking for, please feel free to modify it and use it.
With respect to the baseline correction, like you I have noticed that the correction should not be correcting in the area of the actual signal. CLASS does a very good job of allowing us to exclude that area. I have not yet figured out how to do that in Python. I suppose that I could manually identify that segment in the plot and substitute a straight line segment, or something like that, into the baseline curve. The other issue that is a confusing one for me is the generation and placement of the radial velocity axis plot on the top x axis. To be honest, I understand Doppler shift and Radial velocity, but I am not sure about all that should go into the calculations for those top axis numbers to make them correct. Right now I just tried to put numbers in there that copied what CLASS plotted. Also, I have already made changes to the plotting program I attached yesterday, as it now extracts the RA and DEC from the FITS header and puts it on the plot. I have attached those as well. Thanks again for looking at the stuff I sent yesterday.
Jack
To view this discussion on the web visit https://groups.google.com/d/msgid/sara-list/d611b12b776c7501c7d6e2d50d601591415ede73.camel%40googlemail.com.
Reply all
Reply to author
Forward
0 new messages