Scope in a Box (upgraded) Data
96 views
Skip to first unread message

Alex P
May 21, 2022, 7:35:30 AM5/21/22
to Society of Amateur Radio Astronomers
This is probably the last data 'till the Fall as the rainy season has kicked in here in Orlando Fla.
This data is via the standard 1.0m x 0.6m WiFi grid antenna with side panels. I'm pleased with the improved S/N and resultant signal strength from this modification.
Data in the 2D plots are 12 ea 5 min data sets of 876K averages.
Data in the 3D plot is 100 ea 5 min data sets 876K averages, Dec40 RA16-24 Hrs
Cheers,
Alex
KK4VB
Alex P
May 26, 2022, 11:45:45 AM5/26/22
to Society of Amateur Radio Astronomers
This is a plot using Matlab .. a 100 sample Drift Scan in RA 16 to 24 Hrs, Dec 40 degrees.
Color Amplitude is dB above the Background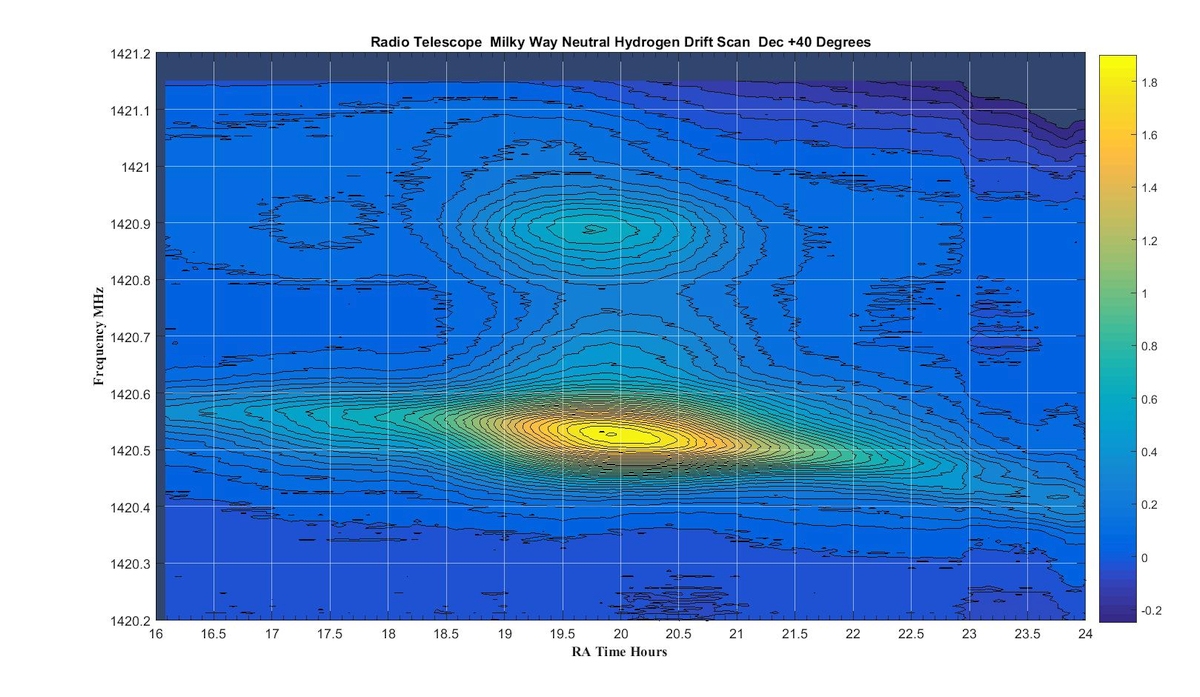

Alfred Aburto
May 26, 2022, 11:59:51 AM5/26/22
to sara...@googlegroups.com
Excellent work!
What is that at 1420.9 MHz and RA 19.8 Hours?
Al
--
--
You received this message because you are subscribed to the Google
Groups "Society of Amateur Radio Astronomers" group.
To post to this group, send email to sara...@googlegroups.com
To unsubscribe from this group, send email to
sara-list-...@googlegroups.com
For more options, visit this group at
http://groups.google.com/group/sara-list?hl=en
---
You received this message because you are subscribed to the Google Groups "Society of Amateur Radio Astronomers" group.
To unsubscribe from this group and stop receiving emails from it, send an email to sara-list+...@googlegroups.com.
To view this discussion on the web visit https://groups.google.com/d/msgid/sara-list/c654d59c-2879-4e4e-ba3d-f4bd0bff9020n%40googlegroups.com.

Dr. Rich Russel
May 26, 2022, 12:10:44 PM5/26/22
to sara...@googlegroups.com
Alex,
Try plotting velocity vs galactic longitude (see 1706.10084.pdf (arxiv.org))
Also, if you plot velocity vs range from galactic center - you have the galactic rotation curve and Milky Way Mass
Approach: See journal article:
Milky Way Rotation Rate and Mass Estimation Using HI Measurements, R. Russel, Radio Astronomy, November-December 2018, pp.77-83, radio-astronomy.org.
Great Work!
Rich
Dr. Rich Russel
May 26, 2022, 12:27:09 PM5/26/22
to sara...@googlegroups.com
Here is my paper on Velocity vs. Gal Longitude plotting
Profiling the Milky Way Structure by Plotting Neutral Hydrogen onto a Velocity-Galactic Longitude Map, R. Russel, Radio Astronomy Nov-Dec 2019, radio-astronomy.org.
b alex pettit jr
May 26, 2022, 12:29:32 PM5/26/22
to sara...@googlegroups.com
What you are referring is ~ this time slice ( vert raw linear ampl units )
What it IS ? someone else can answer that ..
I am pleased that this small system can acquire useful data.
Alex
KK4VB

Alfred Aburto
May 26, 2022, 12:45:33 PM5/26/22
to sara...@googlegroups.com
Ah, side lobe of antenna response (pattern)?
Al
--
--
You received this message because you are subscribed to the Google
Groups "Society of Amateur Radio Astronomers" group.
To post to this group, send email to sara...@googlegroups.com
To unsubscribe from this group, send email to
sara-list-...@googlegroups.com
For more options, visit this group at
http://groups.google.com/group/sara-list?hl=en
---
You received this message because you are subscribed to the Google Groups "Society of Amateur Radio Astronomers" group.
To unsubscribe from this group and stop receiving emails from it, send an email to sara-list+...@googlegroups.com.
To view this discussion on the web visit https://groups.google.com/d/msgid/sara-list/672697966.1890881.1653582558296%40mail.yahoo.com.
Dr. Rich Russel
May 26, 2022, 12:51:07 PM5/26/22
to sara...@googlegroups.com
The object is a hydrogen cloud that has a slightly closing relative velocity. (based on frequency being higher than 1420.406 MHz)
You can also use the SIMBAD Astronomical Database to find what objects are at those coordinates. Just realize that the objects are probably not the source of the HI frequency, they just are on the same celestial coordinates.
Go to SIMBAD: SIMBAD: Query by coordinates (unistra.fr)
Enter Celestial coordinates into Coordinate Query: 19 48 00.0 +40 00 0.0 (Note: RA Declination)
Submit query
You get a list of astronomical objects at those celestial coordinates. At this point you can determine if the object could be producing the signal.
--
--
You received this message because you are subscribed to the Google
Groups "Society of Amateur Radio Astronomers" group.
To post to this group, send email to sara...@googlegroups.com
To unsubscribe from this group, send email to
sara-list-...@googlegroups.com
For more options, visit this group at
http://groups.google.com/group/sara-list?hl=en
---
You received this message because you are subscribed to the Google Groups "Society of Amateur Radio Astronomers" group.
To unsubscribe from this group and stop receiving emails from it, send an email to sara-list+...@googlegroups.com.
To view this discussion on the web visit
Alfred Aburto
May 26, 2022, 1:35:35 PM5/26/22
to sara...@googlegroups.com
Yes, not sidelobe ... something at a different frequency
Al
To view this discussion on the web visit https://groups.google.com/d/msgid/sara-list/633606163.3439602.1653583862497%40mail.yahoo.com.
b alex pettit jr
May 26, 2022, 1:57:26 PM5/26/22
to 'Dr. Rich Russel' via Society of Amateur Radio Astronomers
Hi Dr Russel,
I need to research how to correct the data for Earth orbital/rotation V to get Galactic Velocity.
There are steep slopes associated with this 'hobby'.
Alex
b alex pettit jr
May 26, 2022, 4:11:34 PM5/26/22
to 'Dr. Rich Russel' via Society of Amateur Radio Astronomers
Are these values reasonable ?
|
|
UT time |
Right Ascension |
Declination |
V-Helio |
V_LSRK |
V_GAL |
|
|
|
|
|
-9.991 km/sec |
-28.212 km/sec |
-161.281 km/sec |
This gives the velocity in the direction (RA,Dec) from the point of view of
the GBT.
Positive means it is receding from us (redshift); negative, it is approaching
(blueshift).
V-Helio is the velocity due to the rotation of the Earth and the motion of the Earth in its orbit around the Sun.
V-LSRK is the velocity referenced to the local standard of rest, in addition to the motions of the Earth.
V-GAL is the velocity referenced to the center of the galaxy.
=========================================================
I should thus Subtract this value -161.281 from that data set ?
Over the 8 hour period, the velocity corrections are
-161 -191 -215 -232 - 239 -237 - 227 -208 -181 ??
Thanks,
Alex
===============================================================

fasleitung3
May 27, 2022, 2:57:58 AM5/27/22
to sara...@googlegroups.com
Alex,
Hydrogen spectra from our galaxy are usually referenced to the Local Standard of Rest, so you want to use V_LSRK for your correction.
Wolfgang
--
--
You received this message because you are subscribed to the Google
Groups "Society of Amateur Radio Astronomers" group.
To post to this group, send email to sara...@googlegroups.com
To unsubscribe from this group, send email to
sara-list-...@googlegroups.com
For more options, visit this group at
http://groups.google.com/group/sara-list?hl=en
---
You received this message because you are subscribed to the Google Groups "Society of Amateur Radio Astronomers" group.
To unsubscribe from this group and stop receiving emails from it, send an email to sara-list+...@googlegroups.com.
To view this discussion on the web visit https://groups.google.com/d/msgid/sara-list/650189162.1972922.1653595890297%40mail.yahoo.com.
b alex pettit jr
May 27, 2022, 10:22:54 AM5/27/22
to 'fasleitung3' via Society of Amateur Radio Astronomers
Hello Wolfgang,
Thank You.
LSR km/sec correction curve for RA16-24 ( 100 samples )

Data converted to Velocity and corrected via the derived LSR equation from that RA16-20 hr time segment
Yes/No/Maybe ?
Not Corrected for LSRK LSRK Corrected

Best Regards,
Alex KK4VB
fasleitung3
May 28, 2022, 4:01:34 AM5/28/22
to sara...@googlegroups.com
Hi Alex,
I had a closer look at your plots. A few remarks:
At the location RA 20:00 Dec 40:00 you expect to see a double peak, a stronger one at around 4 km/s and a weaker one at around -78 km/s (blue shifted). This double peak is what one can see in your plot. Looking at the original frequency plot, the second peak is seen at a higher frequency (about 370 kHz higher). This corresponds to -78 km/s (in radio astronomy blue shifted velocities have a negative sign) which is what you expect.
In your velocity plot, however, the difference is some 110 to 120 km/s. So there must be something not correct in your conversion from frequency to velocity.
Best regards,
Wolfgang
--
--
You received this message because you are subscribed to the Google
Groups "Society of Amateur Radio Astronomers" group.
To post to this group, send email to sara...@googlegroups.com
To unsubscribe from this group, send email to
sara-list-...@googlegroups.com
For more options, visit this group at
http://groups.google.com/group/sara-list?hl=en
---
You received this message because you are subscribed to the Google Groups "Society of Amateur Radio Astronomers" group.
To unsubscribe from this group and stop receiving emails from it, send an email to sara-list+...@googlegroups.com.
To view this discussion on the web visit https://groups.google.com/d/msgid/sara-list/1381421905.2131730.1653661310759%40mail.yahoo.com.
b alex pettit jr
May 28, 2022, 6:41:21 AM5/28/22
to 'fasleitung3' via Society of Amateur Radio Astronomers
Hello Wolfgang,
THANKS for reviewing the data.
Now, one pk is at (-)8.6 km/sec and the other at (-)85 km/s : delV = 76.4 km/s
Close, but not the 4 km/s & - 78 km/s delV = 82 km/s you stated .
yes, I need to make RedShifts Plus.
Regards,
Alex
b alex pettit jr
May 28, 2022, 11:09:32 AM5/28/22
to 'b alex pettit jr' via Society of Amateur Radio Astronomers
Got It ... I forgot to scale the array shift loop in ( my case ) the velocity increments of 0.619 km/sec

Thanks.
Alex
Alfred Aburto
May 28, 2022, 12:43:20 PM5/28/22
to sara...@googlegroups.com
Good work!
--
--
You received this message because you are subscribed to the Google
Groups "Society of Amateur Radio Astronomers" group.
To post to this group, send email to sara...@googlegroups.com
To unsubscribe from this group, send email to
sara-list-...@googlegroups.com
For more options, visit this group at
http://groups.google.com/group/sara-list?hl=en
---
You received this message because you are subscribed to the Google Groups "Society of Amateur Radio Astronomers" group.
To unsubscribe from this group and stop receiving emails from it, send an email to sara-list+...@googlegroups.com.
To view this discussion on the web visit https://groups.google.com/d/msgid/sara-list/1143971847.2340148.1653750501451%40mail.yahoo.com.
Reply all
Reply to author
Forward
0 new messages