How to plot regions?
70 views
Skip to first unread message

Victor Defontnouvelle
May 13, 2021, 8:23:59 PM5/13/21
to s2geom...@googlegroups.com
Hello, I have used S2 to divide the world into about 200 regions of varying sizes. I would love to be able to plot them, much like the main image on the homepage (https://s2geometry.io/). How do I do that?
I am using python, but am willing to switch to another language if need be.
Best,
Victor
Victor Defontnouvelle
May 13, 2021, 9:05:46 PM5/13/21
to s2geom...@googlegroups.com
I apologize, I have one more question actually.
The docs specify: "This class also defines a framework for decomposing the unit sphere into a hierarchy of 'cells'". How do I actually create the top-level cell to subdivide?
My current approach is to create six different top-level cells rather than just one using "from_face_pos_level" (note that my code is in python):
> top_level_cells = [cell = s2sphere.Cell.from_face_pos_level(i,0,0) for i in range(6)]
However, I think this is wrong, because one of these six cells contains a point in Ghana as well as a point in Guam (on opposite sides of the globe). Here is my code to repro that bug:
> p1 = s2sphere.LatLng(6.005519, 0.5326073).to_point() # Ghana
> p2 = s2sphere.LatLng(13.33591,144.7627).to_point() # Guam
> cell = s2sphere.Cell.from_face_pos_level(0,0,0)
> cell.contains(p1), cell.contains(p2)
> p2 = s2sphere.LatLng(13.33591,144.7627).to_point() # Guam
> cell = s2sphere.Cell.from_face_pos_level(0,0,0)
> cell.contains(p1), cell.contains(p2)
OUTPUT: True, True
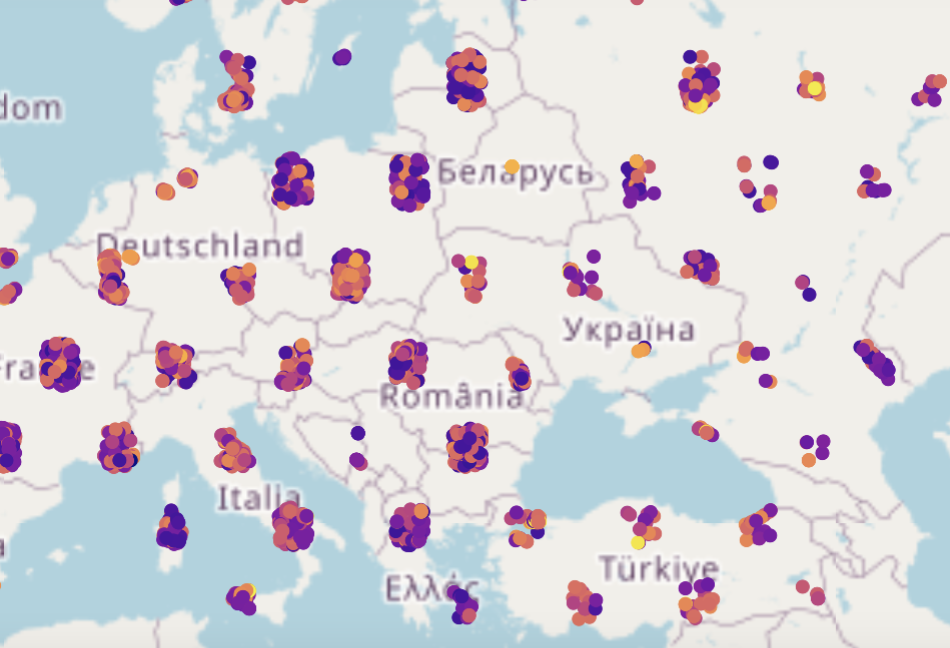
Plotting some points in "cell" (from above) yields this:
It thus seems that "s2sphere.Cell.from_face_pos_level(0,0,0)" is not the correct way to create a top-level cell. What is the correct way to create a top-level cell?
Sorry for the disturbance - I have been reading the docs and trying various things for a few hours, but to no avail. I would tremendously appreciate anyone who could help unblock me!

Steve Haflich
May 13, 2021, 9:12:14 PM5/13/21
to Victor Defontnouvelle, s2geom...@googlegroups.com
If your regions are reasonably describable, something like polygons, if I were facing this need I'd think about emitting the regions in KML and then viewers like Google Earth or Leaflet (perhaps with Open Street Map) should do the job easily. Sorry, haven't thought through the details how best to go about this, but that's the approach I'd start with.
On Thu, May 13, 2021 at 5:23 PM Victor Defontnouvelle <vde...@gmail.com> wrote:
--
You received this message because you are subscribed to the Google Groups "s2geometry-io" group.
To unsubscribe from this group and stop receiving emails from it, send an email to s2geometry-i...@googlegroups.com.
To view this discussion on the web visit https://groups.google.com/d/msgid/s2geometry-io/CACy1DXLxnHhd7xru%2B4HsaQYSj01VS3%2BGkGDFEG_y_q7d7bbAog%40mail.gmail.com.
Reply all
Reply to author
Forward
0 new messages