Dashboard Grafana for Rundeck
193 views
Skip to first unread message

olivie...@gmail.com
Apr 28, 2023, 8:49:32 AM4/28/23
to rundeck-discuss
Hello
I want to have a dashboard to monitor my rundeck instance
I'm using this link to do that
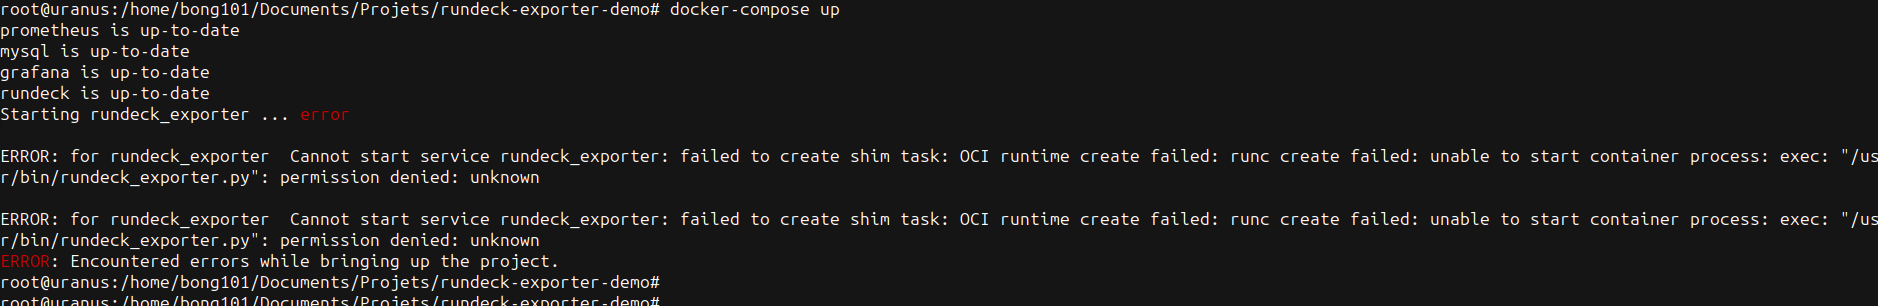
rundeck-export is working

in prometheus, metrics are here

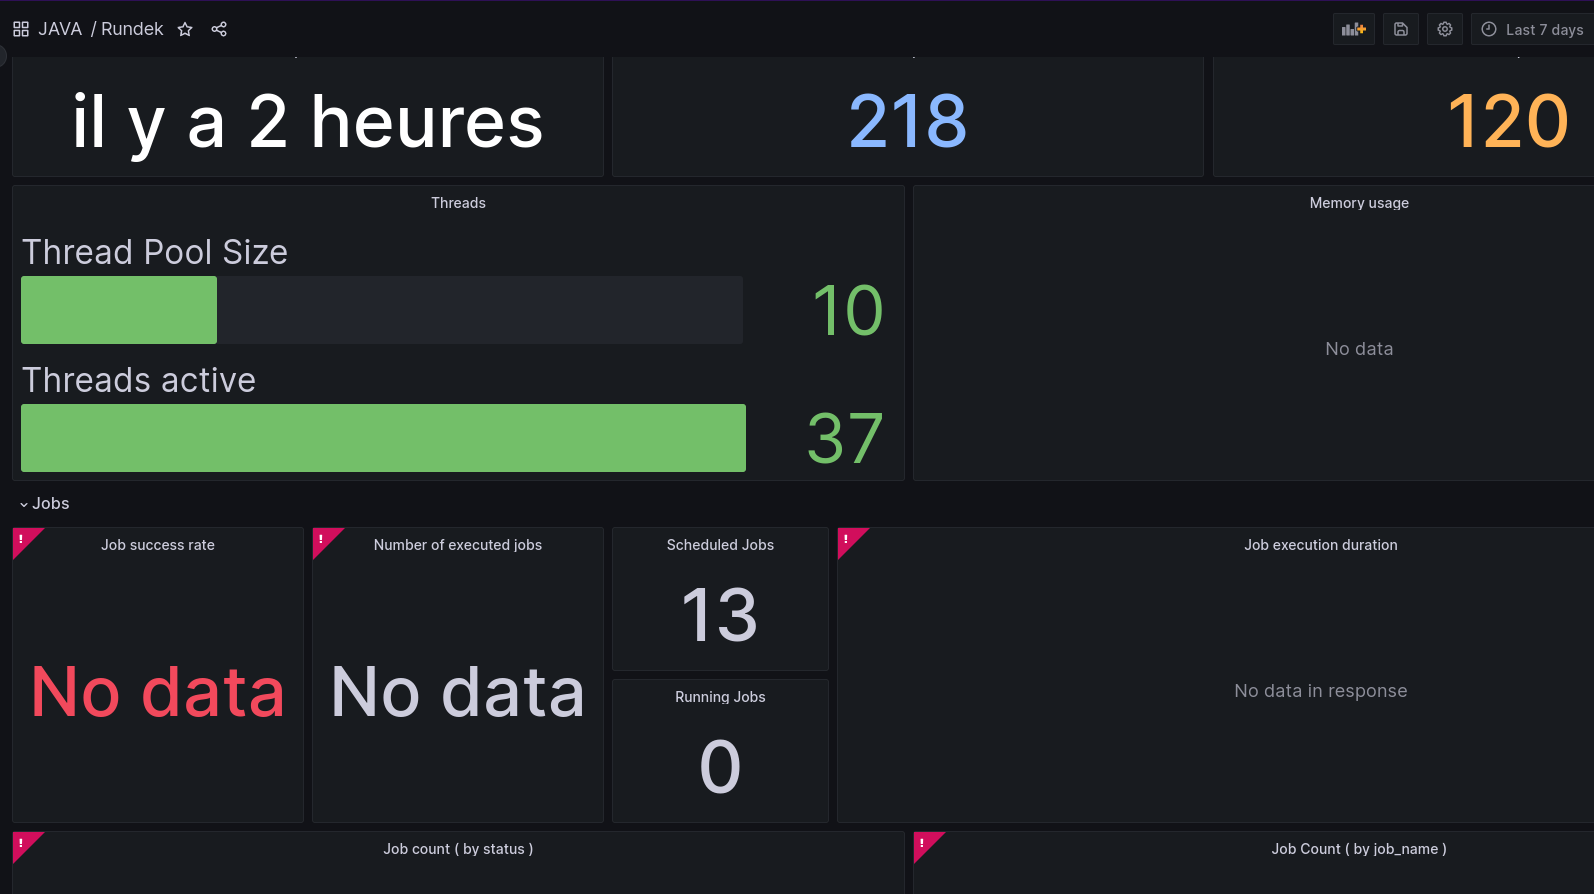
in grafana, import dashbord is easy, but there's nothing
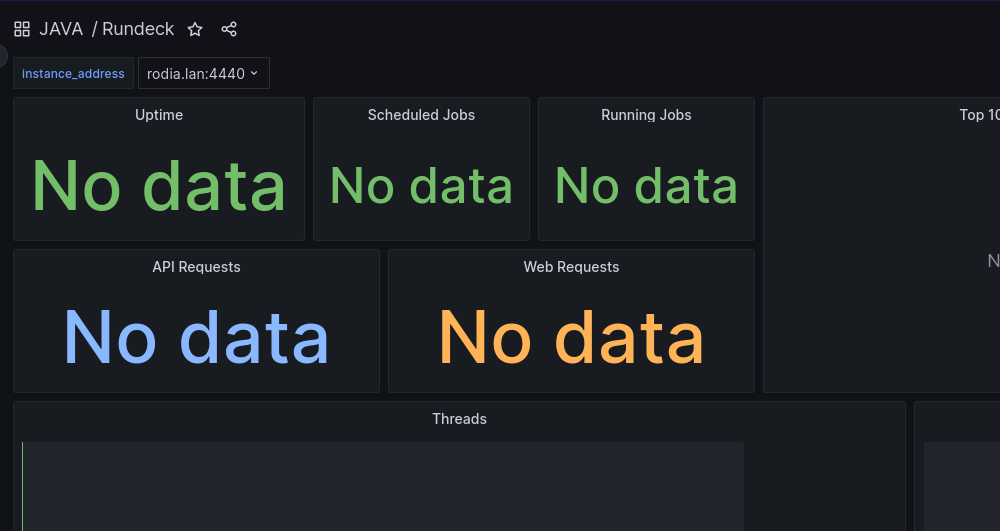
or data is incomplete
dashboards that I'm using are here
Do you have an idea to help me
Thanks in advance
Olivier

rac...@rundeck.com
Apr 28, 2023, 9:13:28 AM4/28/23
to rundeck-discuss
olivie...@gmail.com
Apr 28, 2023, 10:13:47 AM4/28/23
to rundeck-discuss
Thanks for your answer ...
No I can't try this..
On this branch, I understand that that'is an all-in-one solution...
Grafana, Rundeck and Mysql are already running well ...so It's complicated
but on another computer :
Regards
Reply all
Reply to author
Forward
0 new messages