Use of qtl2pleio for simple bi-parental
58 views
Skip to first unread message

Conor Simpson
Apr 26, 2021, 7:06:08 AM4/26/21
to R/qtl2 discussion
Hi all,
I have two traits that are highly correlated and are clearly associated with the same QTL. I understand qtl2pleio is designed for handling this in multi-parental traits however I am working with a simple F2 bi-parental population and am wondering if it can be used for this.
I have followed the "
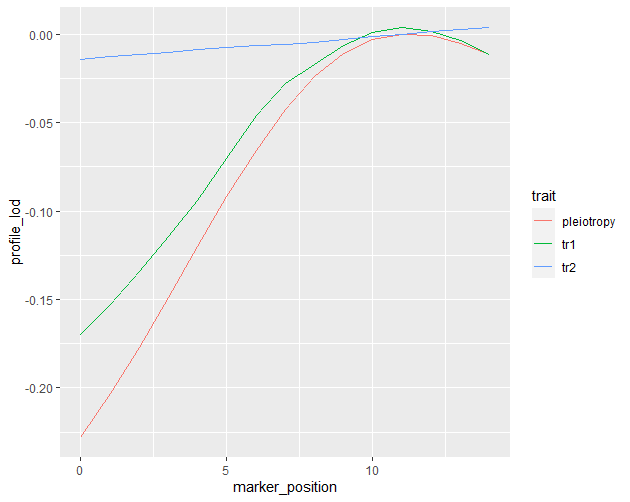
Multivariate analysis for two or more traits" vignette using my data whilst ignoring the steps for calculating kinship and allele contribution. Below is the lod profile for the two traits and pleiotropy.
I am quite alone in my analysis here and am no statistician so understanding this takes an immense amount of time. I essentially want to know if this is enough to show that the QTLs identified in single scan are likely to be pleiotropic and thus conclude my QTL analysis.
I have another slightly unrelated query about environmental location effects. A simple ANOVA shows that the plot in which a plant was grown is having a small but significant effect on my trait. Would it be wise to include this as a covariate in the scan1()?
Thanks and best wishes,
Conor

Fred Boehm
Apr 26, 2021, 9:16:18 AM4/26/21
to rqtl2...@googlegroups.com
Hi, Conor,
You might try expanding your scan region to the right. It looks like the profile lod for trait2 hasn't reached its peak in your plot. You'll want to include its peak in your two-dimensional scan.
I hope that this helps. You can also reach out to me at frederi...@gmail.com if you have more questions about qtl2pleio.
Cheers,
fred
--
You received this message because you are subscribed to the Google Groups "R/qtl2 discussion" group.
To unsubscribe from this group and stop receiving emails from it, send an email to rqtl2-disc+...@googlegroups.com.
To view this discussion on the web visit https://groups.google.com/d/msgid/rqtl2-disc/699736f7-a9c7-4436-8279-f60026a77f91n%40googlegroups.com.
Conor Simpson
Apr 26, 2021, 10:01:51 AM4/26/21
to R/qtl2 discussion
Hi Fred,
Thank you for such a swift response!
I will have a tinker around to do that - unfortunately there are few markers on that specific chromosome and in the single scan all of the markers bar one are above the significance threshold for that trait so that may be the reason. Does this mean that this method is acceptable for showing a QTL is having a pleiotropic effect on my two traits?
Additionally - I have had a look at your linked page and see that you also maintain qtlbim which is what I have been playing around with since I put this message up. If I may I would like to ask a question about that too - I have run my the following code for my data and model:
data <- qb.data(conor18, pheno.col = c(5,6,8), trait = "normal", multiple.trait = TRUE, multiple.type = "SUR", standardize = FALSE)
model <- qb.model(conor18, epistasis = FALSE, main.nqtl = 2, diff.loc = TRUE, interval = rep(1.2, nchr(conor18)))
Then when I run the qb.mcmc code I encounter the following error:
qbObject <- qb.mcmc(conor18, data, model, n.burnin = 5000, n.thin = 20, n.iter = 3000, genoupdate = FALSE)
Error in dir.create(traitDir) : invalid 'path' argument
If i define a directory then it tells me the output directory does not exist.
Would you be able to provide some help for these matters.
Thanks again,
Conor
Fred Boehm
Apr 26, 2021, 10:25:17 AM4/26/21
to rqtl2...@googlegroups.com
Hi, Conor,
In general, qtl2pleio's approach has the potential to give results that are consistent with a single pleiotropic QTL for your two traits. To quantify the evidence in support of the alternative hypothesis, ie, two distinct QTL, you would want to perform a bootstrap analysis to get a bootstrap p-value. Unfortunately, the bootstrap analysis can be computationally costly and time-consuming. If you don't have the resources to perform the bootstrap analysis, I'd still suggest that you expand your scan region to include more markers. Perhaps you'll want to include all of the markers on your chromosome of interest. Ideally, you'd want to be able to see well-defined peaks in both traits' profile lod plots. Alternatively, you could consider using the R package qtlpvl if you have your data in R/qtl format.
Regarding qtlbim, I'm not the official maintainer. I believe that one of the package authors, Brian Yandell, is still the maintainer. I've placed on my github account a copy of qtlbim that has a few minor updates to work with gcc10, but I don't mean to imply that I've taken over as maintainer of that package.
I'm not sure if this mailing list is the best forum for continuing to correspond about packages that aren't qtl2. I'm happy to try to address your questions via email to frederi...@gmail.com. You can also open github issues on the qtl2pleio and qtlbim repositories.
Thanks again,
To view this discussion on the web visit https://groups.google.com/d/msgid/rqtl2-disc/004cf3b8-28b9-4100-bfa1-1e45b712d8afn%40googlegroups.com.
Conor Simpson
Apr 26, 2021, 10:31:14 AM4/26/21
to R/qtl2 discussion
Hi Fred,
No worries I really appreciate the advice. This is not a major part of my PhD and has taken up a hugely disproportionate amount of time performing the analysis. I will stick with qtl2pleio as it seems to be doing the job and extend the extend the region to include all of my relevant chromosome and gives some insight as to how qtl2 works which is nice.
Thanks again,
Conor
Reply all
Reply to author
Forward
0 new messages