Dual peak for binary trait mapping

Maggie Johansen
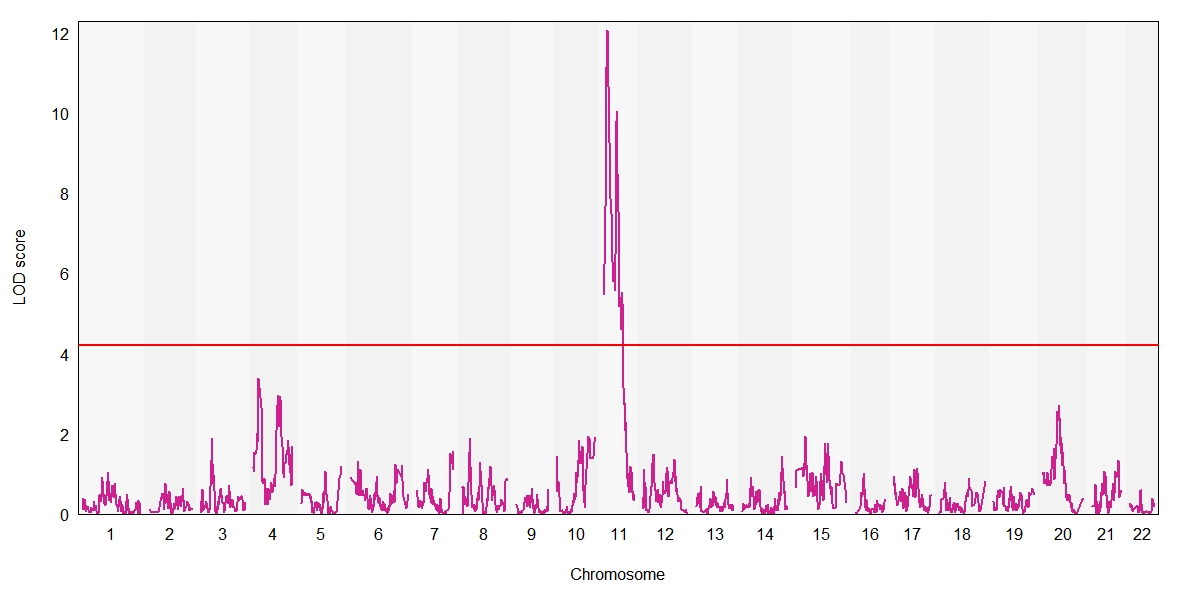
1 yellow 11 7.429 12.05108 7.429 7.429
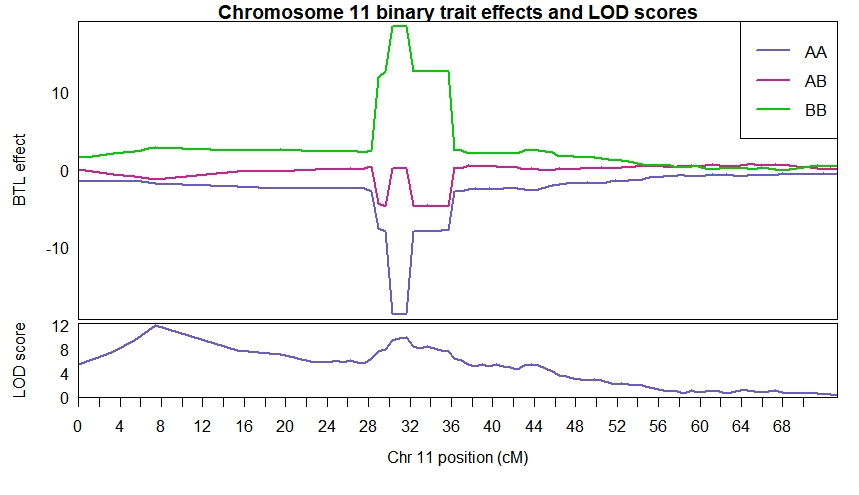
1 yellow 11 31.636 10.04166 30.294 32.307

Dan Gatti
I’m not entirely sure. Could the linkage map be wrong? Or is there correlation between the marker genotypes at the two peaks? That might lead to a “ghost peak”, but it’s strange that it’s LOD is higher than the LOD for the causal locus. Or there may be a second locus that is causal and you’re discovering it right now, but you’d have to rule out the first two questions before going down that path.
--
You received this message because you are subscribed to the Google Groups "R/qtl2 discussion" group.
To unsubscribe from this group and stop receiving emails from it, send an email to
rqtl2-disc+...@googlegroups.com.
To view this discussion on the web visit
https://groups.google.com/d/msgid/rqtl2-disc/7cc1cf20-f670-4101-9ea5-2b6ffbde01d7n%40googlegroups.com.
The information in this email, including attachments, may be confidential and is intended solely for the addressee(s). If you believe you received this email by mistake, please notify the sender by return email as soon as possible.
Maggie Johansen
Dan Gatti
Hmm. I’m not sure then. The LOD plot looks like there are a set of markers in LD around the first peak. So it’s not one marker being off. What does the effect plot look like at the first locus?
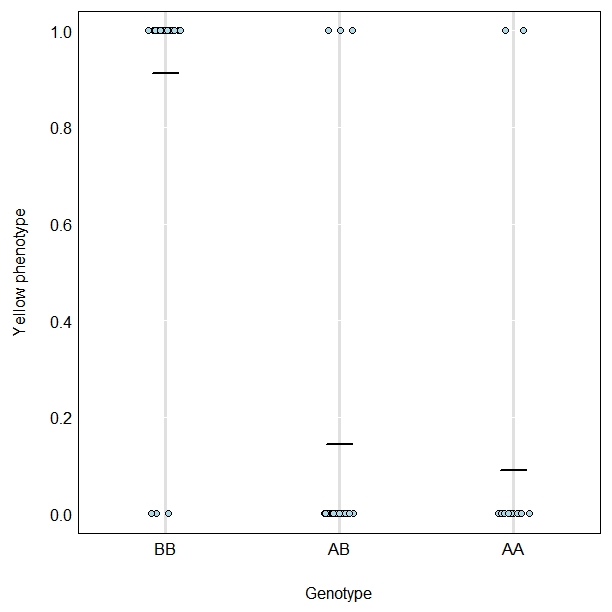
When I look at your LOD/founder effects plot, the effect size a the first locus is small, but you still get a large LOD. Can you see what the sample size is in each genotype class at the first peak? Maybe you have unbalanced allele groups sizes and that’s throwing things off?
Dan
To view this discussion on the web visit https://groups.google.com/d/msgid/rqtl2-disc/3b94fa51-e3df-4a1d-958d-0b020a39ecb5n%40googlegroups.com.
Maggie Johansen

Karl Broman
Dan Gatti
The sample sizes look OK. And I saw the you had the allele effects in your first post.
Karl had a suggestion about looking at the recombinants in detail. Maybe that’s that way to go.
To view this discussion on the web visit https://groups.google.com/d/msgid/rqtl2-disc/d0181d35-96d2-4948-9adc-20bd2a79d531n%40googlegroups.com.