CI issue with find_peaks
40 views
Skip to first unread message

Richard Radcliffe
Oct 5, 2021, 2:35:37 PM10/5/21
to R/qtl2 discussion
Hello,
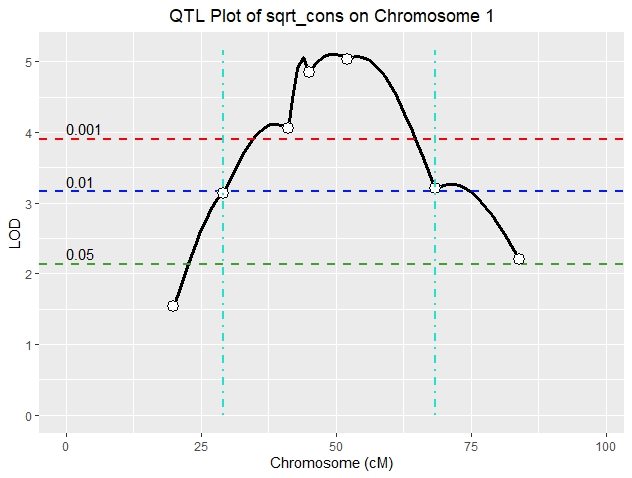
We're mapping mouse F2's derived from consomic x background crosses so we've only genotyped the single consomic chromosome for each F2. On chr 1, we've phenotyped 169 mice and genotyped 7 markers (~20 cM to ~84 cM) and have mapped a highly significant peak using the standard HK procedure (figure attached). The analysis included pseudomarkers spaced at 1 cM. I've tried finding the confidence intervals using find_peaks and no matter what I do, ci_lo and ci_hi always end up on a marker. For example, this is the code I used for the figure (ci shown as vertical turquoise lines):
find_peaks(out, map, threshold=4, peakdrop = 3, drop = 1)
ci_lo = 29.2
ci_hi = 68.5
I can change the values which can change ci_lo/hi, but they always end up on a marker. Same with lod_int and bayes_int.
Any thoughts?
Thanks,
Richard
(qtl2, v 0.24)

Karl Broman
Oct 5, 2021, 3:31:25 PM10/5/21
to R/qtl2 discussion
There's an argument expand2markers that defaults to TRUE. So try
find_peaks(out, map, threshold=4, peakdrop=3, drop=1, expand2markers=FALSE)
karl
Richard Radcliffe
Oct 5, 2021, 3:44:08 PM10/5/21
to R/qtl2 discussion
That did the trick. Thanks and thanks for the speedy response.
-Richard
Reply all
Reply to author
Forward
0 new messages