how to read in saved scan1 output
29 views
Skip to first unread message

elsade...@gmail.com
Sep 16, 2021, 8:00:22 AM9/16/21
to R/qtl2 discussion
Hi, is there a way to read in a scan1 object saved as a .csv and convert it back to a scan1? I've tried to just read it using read.csv, but I get errors when using the maxlod or plot_scan1 function on the resulting data frame, presumably because it's the wrong class.

Karl Broman
Sep 16, 2021, 9:04:51 AM9/16/21
to R/qtl2 discussion
Try class(myobject) <- c("scan1", "matrix")
karl
elsade...@gmail.com
Sep 21, 2021, 4:15:50 PM9/21/21
to R/qtl2 discussion
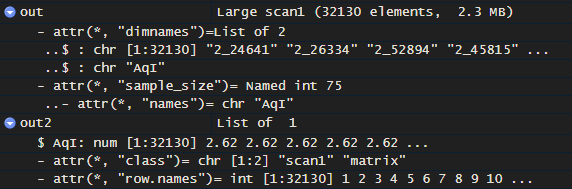
This gives a scan1 object, but it's differently formatted than the original, and still doesn't work with the other functions.
starting with out, which is a scan1 of one phenotype (just as an example):
write.csv(out, "outtest.csv", row.names = F)
out2 <- read.csv("outtest.csv")
class(out2) <- c("scan1", "matrix")
out2 <- read.csv("outtest.csv")
class(out2) <- c("scan1", "matrix")
Additional help appreciated, so I can plot my saved output!

Dan Gatti
Sep 21, 2021, 4:43:00 PM9/21/21
to rqtl2...@googlegroups.com
I usually use saveRDS() and readRDS() with scan1 objects. These write the data as compressed, binary objects. As long as you load the qtl2 library first, they should read in with the correct class type and you should be able to plot LOD curves directly.
Dan
--
You received this message because you are subscribed to the Google Groups "R/qtl2 discussion" group.
To unsubscribe from this group and stop receiving emails from it, send an email to
rqtl2-disc+...@googlegroups.com.
To view this discussion on the web visit
https://groups.google.com/d/msgid/rqtl2-disc/e888ab6c-c9a7-4579-8b5f-8979e61450dcn%40googlegroups.com.
The information in this email, including attachments, may be confidential and is intended solely for the addressee(s). If you believe you received this email by mistake, please notify the sender by return email as soon as possible.
Karl Broman
Sep 21, 2021, 4:55:04 PM9/21/21
to R/qtl2 discussion
The row names in a scan1 object are critical. They need to contain
the marker names and are used to align the LOD scores with the map.
Like Dan, I'd use saveRDS() and readRDS() to save scan1 objects to a file. Alternatively, you can use save() and load().
But
if you want to save the results as a CSV, you need to preserve the row
names, and then you need to do a bit more work when reading it back in.
Here's an example:
library(qtl2)
iron <- read_cross2(system.file("extdata", "iron.zip", package="qtl2"))
pr <- calc_genoprob(iron)
out <- scan1(pr, iron$pheno)
out <- scan1(pr, iron$pheno, Xcovar=get_x_covar(iron))
write.csv(out, "outtest.csv")
out2 <- read.csv("outtest.csv")
rownames(out2) <- out2[,1]
out2 <- as.matrix(out2[, -1])
plot_scan1(out2, iron$pmap)
karl
Reply all
Reply to author
Forward
0 new messages