CC F2 Cross - gmap required? plots look different? QTL effects are off

Aravindh Nagarajan

Karl Broman
I think this is another a symptom of the same problem.
Aravindh Nagarajan
.png?part=0.1&view=1)
--
You received this message because you are subscribed to a topic in the Google Groups "R/qtl2 discussion" group.
To unsubscribe from this topic, visit https://groups.google.com/d/topic/rqtl2-disc/EtpCloQg288/unsubscribe.
To unsubscribe from this group and all its topics, send an email to rqtl2-disc+...@googlegroups.com.
To view this discussion on the web visit https://groups.google.com/d/msgid/rqtl2-disc/77691693-adf9-40c5-a185-9af4b4cd54bbn%40googlegroups.com.
Karl Broman
Karl Broman
f2 <- read_cross2(file = "f2.yaml")
f2$pmap <- lapply(f2$pmap, "*", 1e-6) # physical map -> Mbp
f2$gmap <- lapply(f2$pmap, "*", 0.5) # genetic map = Mbp/2
# remove some markers
g <- do.call("cbind", f2$geno)
no_data <- colnames(g)[colSums(g == 0)==nrow(g)]
monomorphic <- colnames(g)[apply(g, 2, function(a) length(unique(a[a!=0]))==1)]
f2 <- drop_markers(f2, c(no_data, monomorphic))
pr <- calc_genoprob(f2, err=0.01)
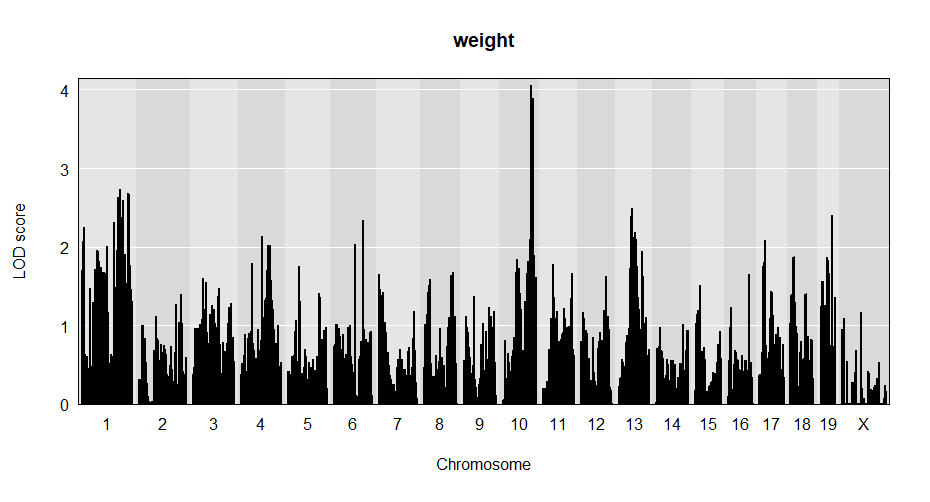
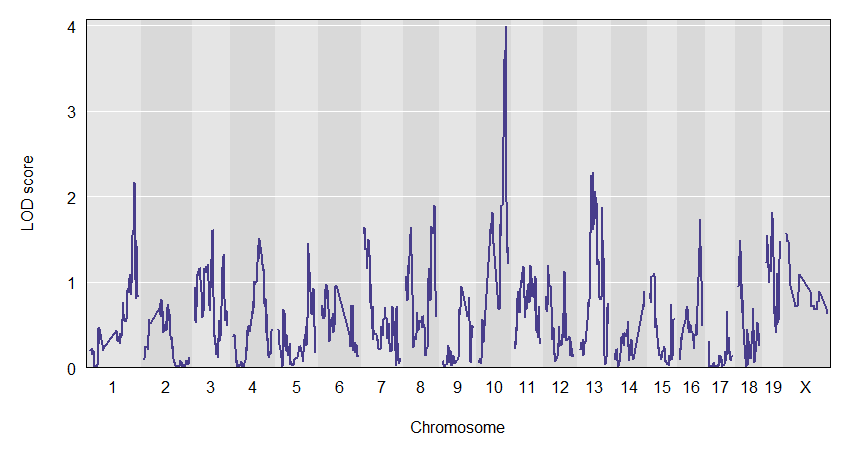
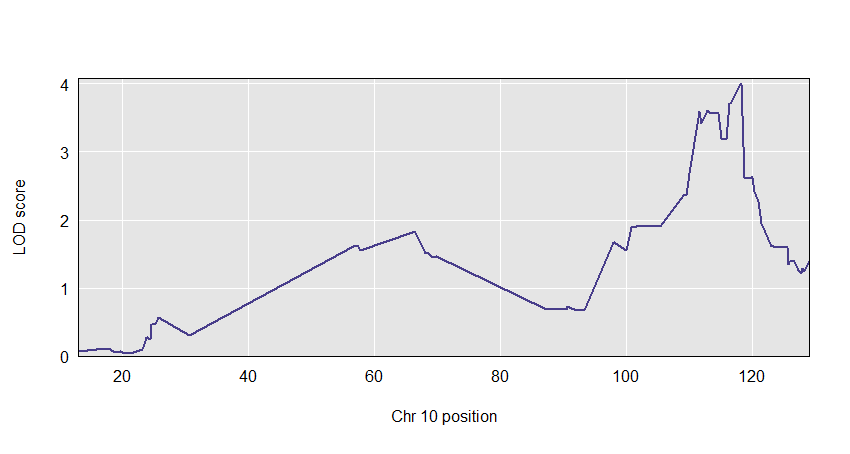
out <- scan1(pr, f2$pheno, cores=0)
plot(out, f2$pmap)
qtlgeno <- maxmarg(pr, f2$pmap, chr=qtlpos$chr, pos=qtlpos$pos,
return_char=TRUE)
plot_pxg(qtlgeno, f2$pheno[,1], SEmult=2, sort=FALSE)
Aravindh Nagarajan
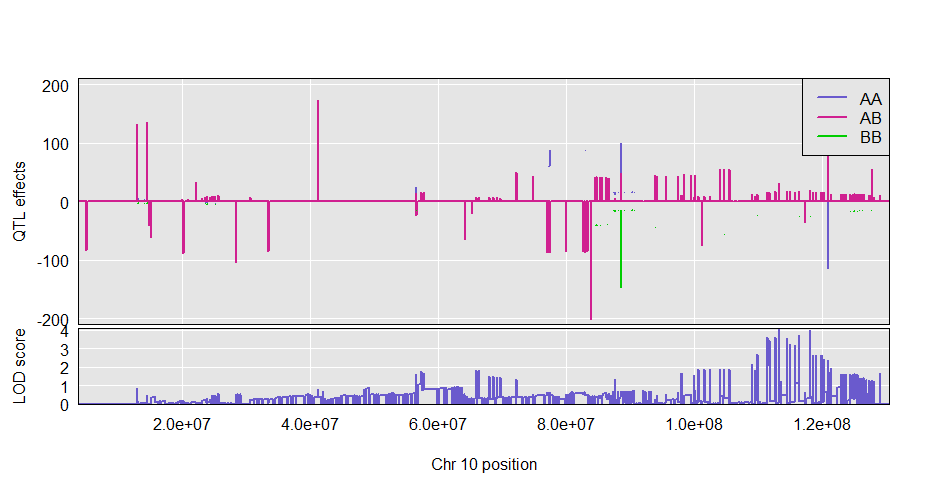
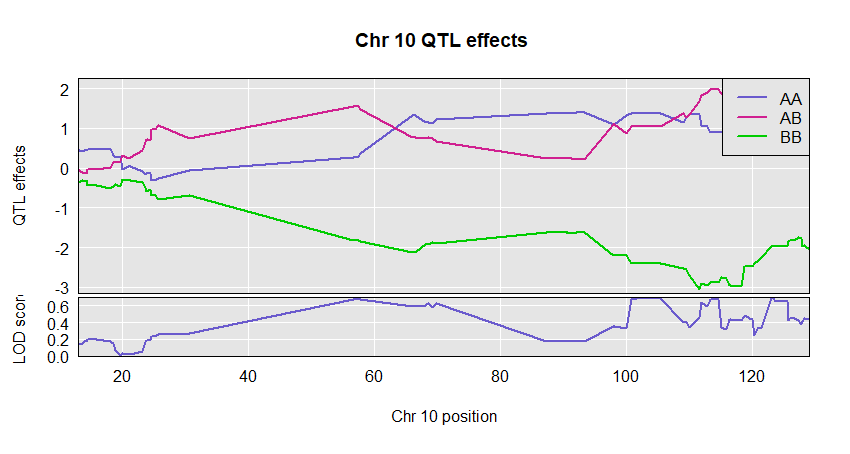
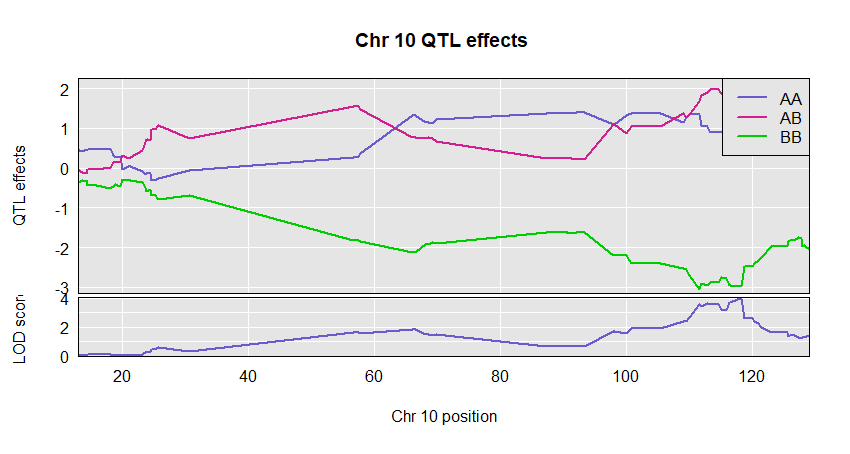
plot_coef(c2eff, f2$pmap, columns = 1:3, scan1_output = out, main = "Chr 10 QTL effects ",legend = "topright")
You received this message because you are subscribed to the Google Groups "R/qtl2 discussion" group.
To unsubscribe from this group and stop receiving emails from it, send an email to rqtl2-disc+...@googlegroups.com.
To view this discussion on the web visit https://groups.google.com/d/msgid/rqtl2-disc/82fc3f7e-f4c7-435a-8264-3f4c02a73e91n%40googlegroups.com.
Karl Broman
plot_coef(c2eff, f2$pmap, columns = 1:3, scan1_output = out, main = "Chr 10 QTL effects ",legend = "topright")
Aravindh Nagarajan
Aravindh Nagarajan \ AH-rah-'vind\
Genetics Ph.D. Candidate | College of Medicine | Linkedin
Advocacy Committee | SGA Diversity Commission | Website
Student Advisor | Desi Aggies | Facebook
Texas A&M University, College Station, Texas.
Tel: 979.985.8586 | aravindhna...@gmail.com
"Be the change you wish to see in this world" - Unknown
To view this discussion on the web visit https://groups.google.com/d/msgid/rqtl2-disc/44a4bf2e-ee78-4880-a475-aec55d267b55n%40googlegroups.com.
Karl Broman
scan1_output
If provided, we make a two-panel plot with coefficients on top and LOD scores below. Should have just one LOD score column; if multiple, only the first is used.
karl
Aravindh Nagarajan
Aravindh Nagarajan \ AH-rah-'vind\
Genetics Ph.D. Candidate | College of Medicine | Linkedin
Advocacy Committee | SGA Diversity Commission | Website
Student Advisor | Desi Aggies | Facebook
Texas A&M University, College Station, Texas.
Tel: 979.985.8586 | aravindhna...@gmail.com
"Be the change you wish to see in this world" - Unknown
To view this discussion on the web visit https://groups.google.com/d/msgid/rqtl2-disc/26c8e41e-8a12-496b-b3cd-ba5eeca285aen%40googlegroups.com.