Zooming in on plot_coefCC

Mark Sfeir
Is there a way to use the plot_coefCC() function to zoom in on the effects in a small interval of a chromosome? I tried indexing the coefficients/LOD/map input to the plot_coefCC function, but received an error.
Context:
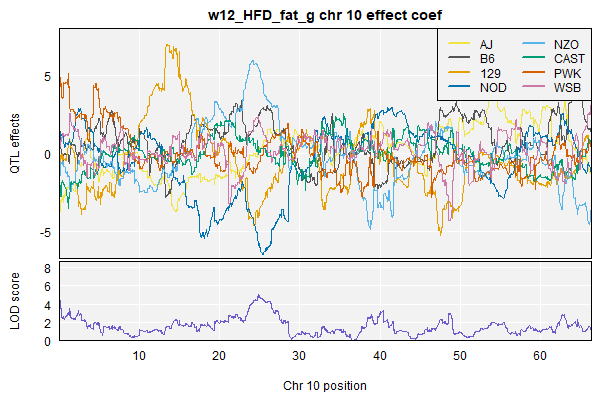
For a DO mouse study, when calculating QTL effects coefficients using scan1coef and then plotting with plot_coefCC(), I've encountered a situation where the LOD peak of interest (and corresponding effects coefficients) are so far to one end of the marker interval on the chromosome that it is hard to see on the standard plot_coefCC() plot, which shows the effects across an entire chromosome.
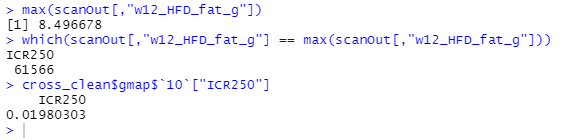
I'm attaching a snapshot of my terminal ("LOD_max_position_capture.png") that shows how the max lod score of interest is at a position near one end of chromosome 10 in terms of cM position, in addition to the same phenotype's corresponding QTL effect coefficients/LOD plot ("w12_HFD_fat_g_no13_coefCC.png") where the max LOD region can't be seen.
Not sure what it means when a QTL is very close to an end of a chromosome.
-Mark

Dan Gatti
Can you use xlim = c(start, end) in plot_coefCC()?
--
You received this message because you are subscribed to the Google Groups "R/qtl2 discussion" group.
To unsubscribe from this group and stop receiving emails from it, send an email to
rqtl2-disc+...@googlegroups.com.
To view this discussion on the web visit
https://groups.google.com/d/msgid/rqtl2-disc/a913da78-d88d-4fcf-a3d8-5b94f799f721n%40googlegroups.com.
The information in this email, including attachments, may be confidential and is intended solely for the addressee(s). If you believe you received this email by mistake, please notify the sender by return email as soon as possible.

Karl Broman
Mark Sfeir
Mark Sfeir
Karl Broman
Mark Sfeir
You received this message because you are subscribed to a topic in the Google Groups "R/qtl2 discussion" group.
To unsubscribe from this topic, visit https://groups.google.com/d/topic/rqtl2-disc/33zps2BDKEw/unsubscribe.
To unsubscribe from this group and all its topics, send an email to rqtl2-disc+...@googlegroups.com.
To view this discussion on the web visit https://groups.google.com/d/msgid/rqtl2-disc/99e066a2-2881-4ea8-be93-04a626f06d43n%40googlegroups.com.