best practices for non-normal phenotypes

Molly Edwards

Christopher G Oakley
--
You received this message because you are subscribed to the Google Groups "R/qtl discussion" group.
To unsubscribe from this group and stop receiving emails from it, send an email to rqtl-disc+...@googlegroups.com.
To view this discussion on the web visit https://groups.google.com/d/msgid/rqtl-disc/a668343f-bc7c-4001-8d3d-50bf99853f95n%40googlegroups.com.

James Anderson
--
Molly Edwards

Lipps, Sarah J
I believe the manual states that rQTL is robust to non-normally distributed data. I was working with a dataset that was not normally distributed and did a box cox transformation which helped. I calculated ls means to be used for the dataset and as I was designing a model always checked BIC to make sure it wasn’t over fit in addition to a few other tests including an ANOVA. The ls means values also followed a 3:1 segregation ratio. I was still able to perform QTL mapping and the results from QTL mapping are very exciting.
Based off of your histograms, it looks like your parents are segregating for your phenotype, and the abnormal distribution could be due to a dominant genetic influence.
Hope this provides insight. And I highly recommend checking out the rQTL manual.
Best,
Sarah
From: <rqtl...@googlegroups.com> on behalf of Molly Edwards <mollye...@g.harvard.edu>
Reply-To: "rqtl...@googlegroups.com" <rqtl...@googlegroups.com>
Date: Thursday, September 10, 2020 at 8:34 PM
To: R/qtl discussion <rqtl...@googlegroups.com>
Subject: Re: [Rqtl-disc] best practices for non-normal phenotypes
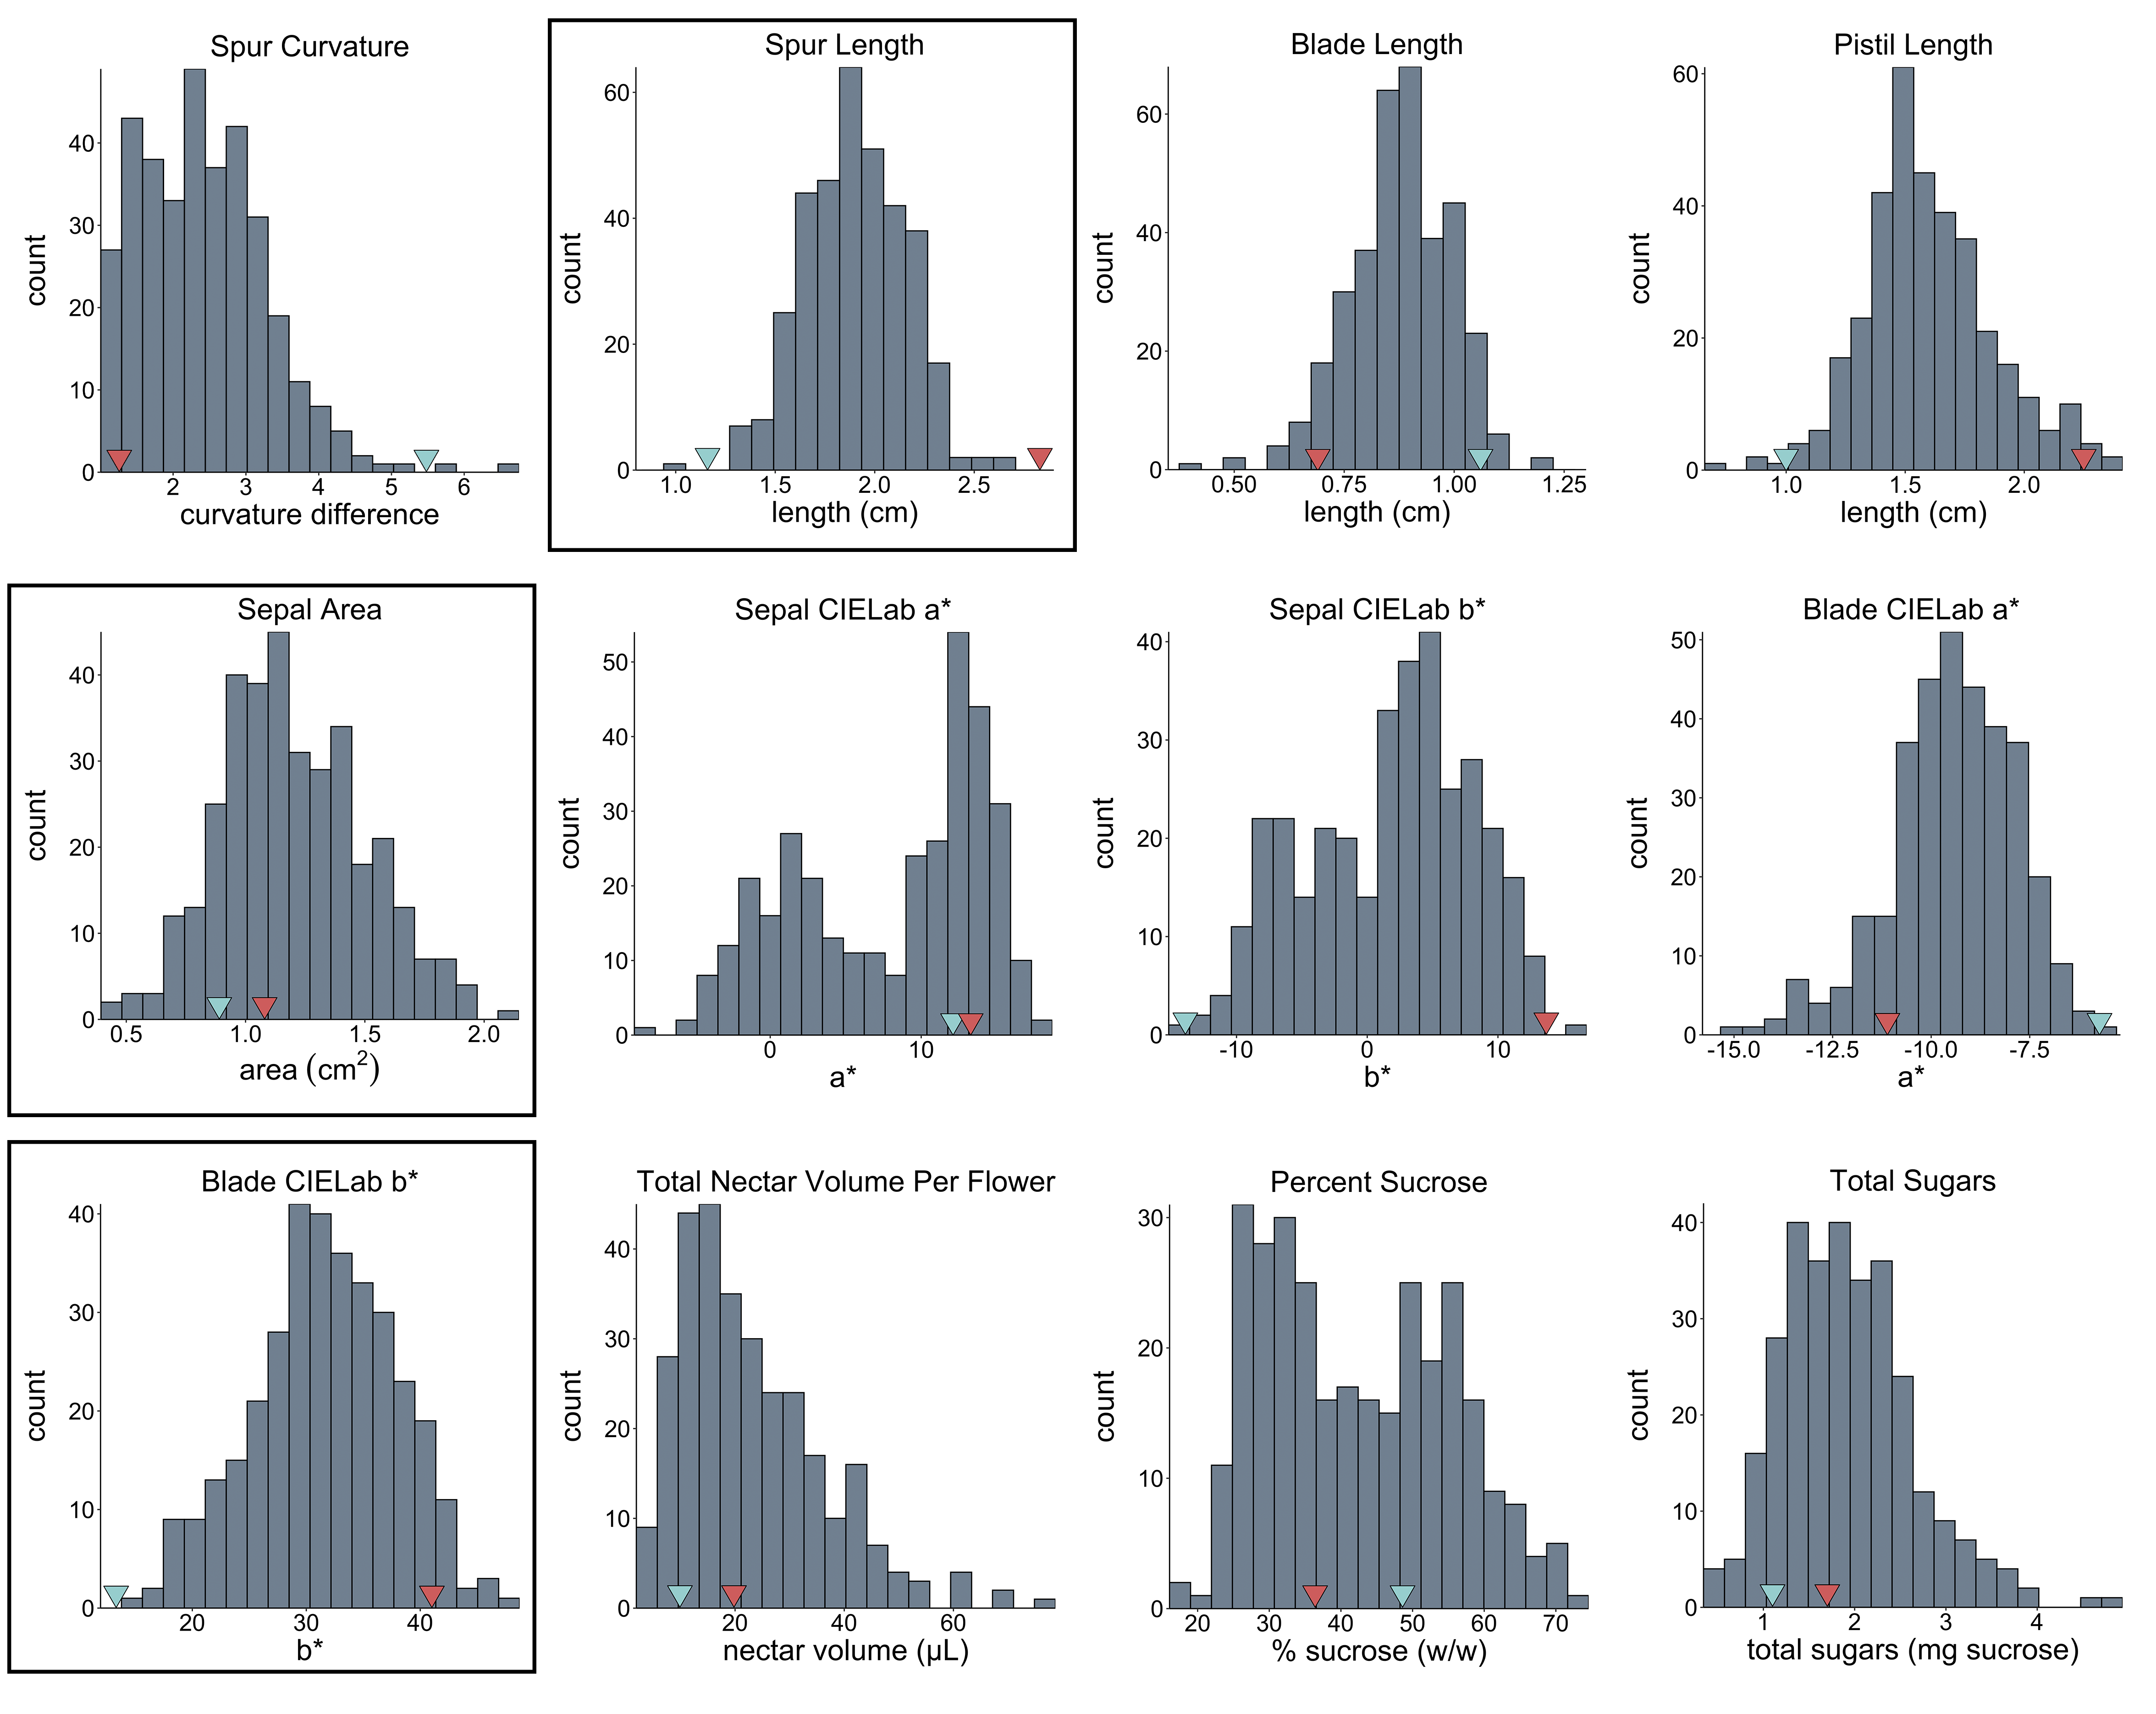
Thanks so much for your help, team! I've attached histograms for 12 of the traits; the three in boxes are normally distributed, the rest are not. The red & blue arrows on the x-axis point to parental means.
On Thursday, September 10, 2020 at 2:30:08 PM UTC-4 James Anderson wrote:
I usually look towards log or log+1 transformations personally. It depends on the skewness of your data. Could you describe your distributions so we might know the types of transformations you might need?
On Thu, Sep 10, 2020, 10:48 AM Molly Edwards <mollye...@g.harvard.edu> wrote:
Hello R/qtl pros,
I am working on a project exploring the genetic architecture of 14 floral traits related to pollination syndromes. In my F2 population, phenotypes of five of these traits are normally distributed, and the rest are not. I am looking for some advice in terms of best practices when analyzing a dataset like this. Is transforming the non-normal phenotype data the way to go? Because if I don't, I can only go as far as scanone with model=np, correct? It would be ideal to be able to do the stepwiseqtl analyses for all traits, not just the normally distributed ones.
Many thanks for your help!
Molly
--
You received this message because you are subscribed to the Google Groups "R/qtl discussion" group.
To unsubscribe from this group and stop receiving emails from it, send an email to rqtl-disc+...@googlegroups.com.
To view this discussion on the web visit https://groups.google.com/d/msgid/rqtl-disc/a668343f-bc7c-4001-8d3d-50bf99853f95n%40googlegroups.com.
--
You received this message because you are subscribed to the Google Groups "R/qtl discussion" group.
To unsubscribe from this group and stop receiving emails from it, send an email to
rqtl-disc+...@googlegroups.com.
To view this discussion on the web visit
https://groups.google.com/d/msgid/rqtl-disc/b67b97e2-ef9e-4f7c-a8c8-ecd38ee7c820n%40googlegroups.com.
James Anderson
To view this discussion on the web visit https://groups.google.com/d/msgid/rqtl-disc/b67b97e2-ef9e-4f7c-a8c8-ecd38ee7c820n%40googlegroups.com.

Karl Broman
Molly Edwards
Best,