Highly non-monotonic LOD profile around QTL
47 views
Skip to first unread message

Scott Brainard
May 16, 2021, 1:24:29 PM5/16/21
to R/qtl discussion
Dear rQTL group,
I am performing linkage mapping in an F2 beet population.
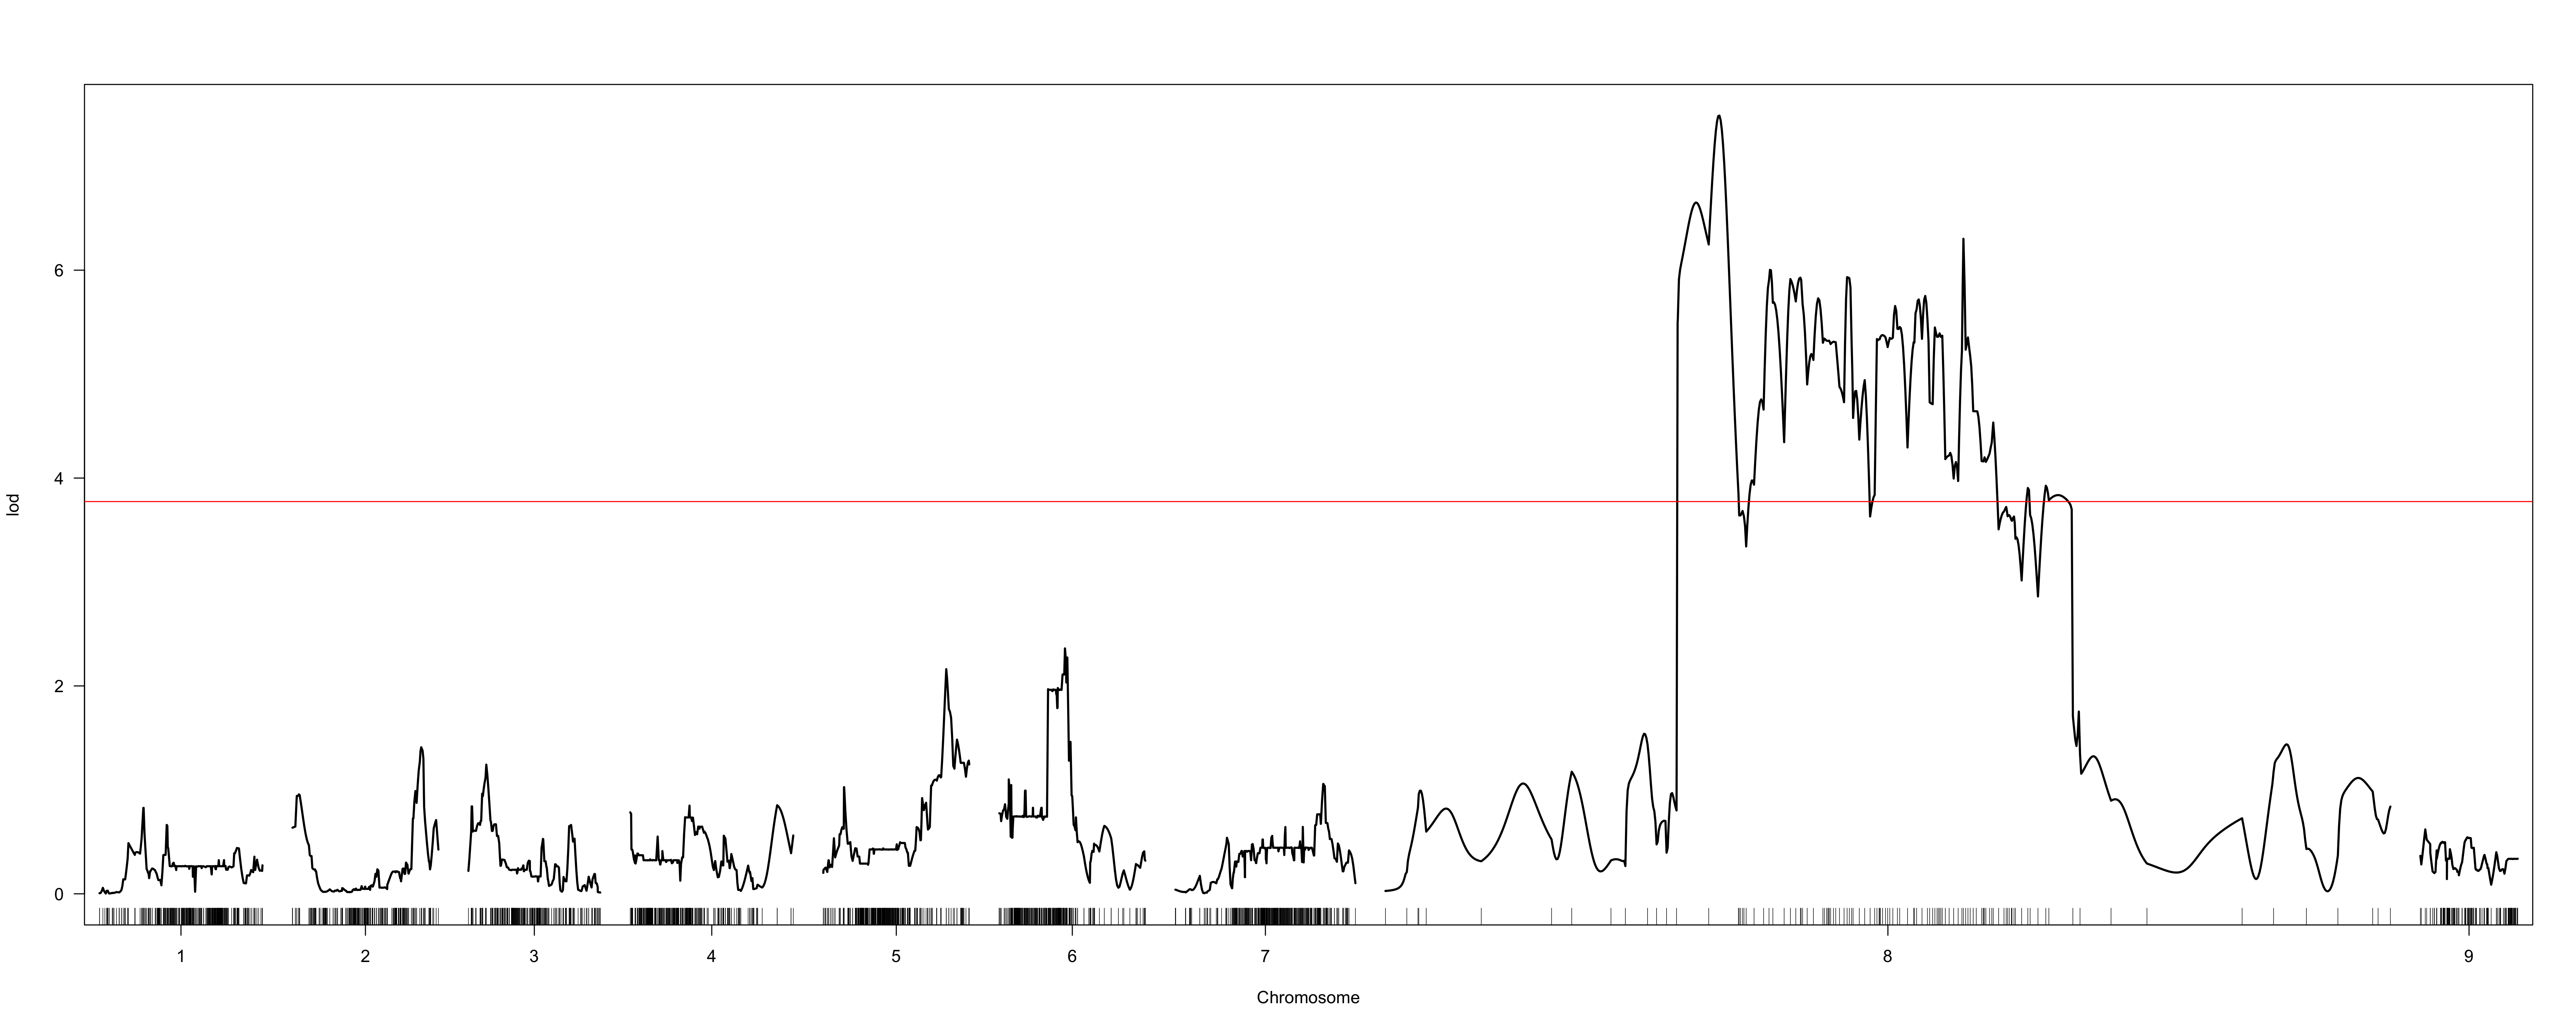
When I use the marker order determined via alignment to the beet reference genome (using the Kosambi map function and 20-point multiple regression to obtain map positions in cM), I obtain results from scanone which suggest a QTL on chromosome 8 (LOD profiles attached as “hk-2135markers.png” and “hk-2135markers-chr8.png”).
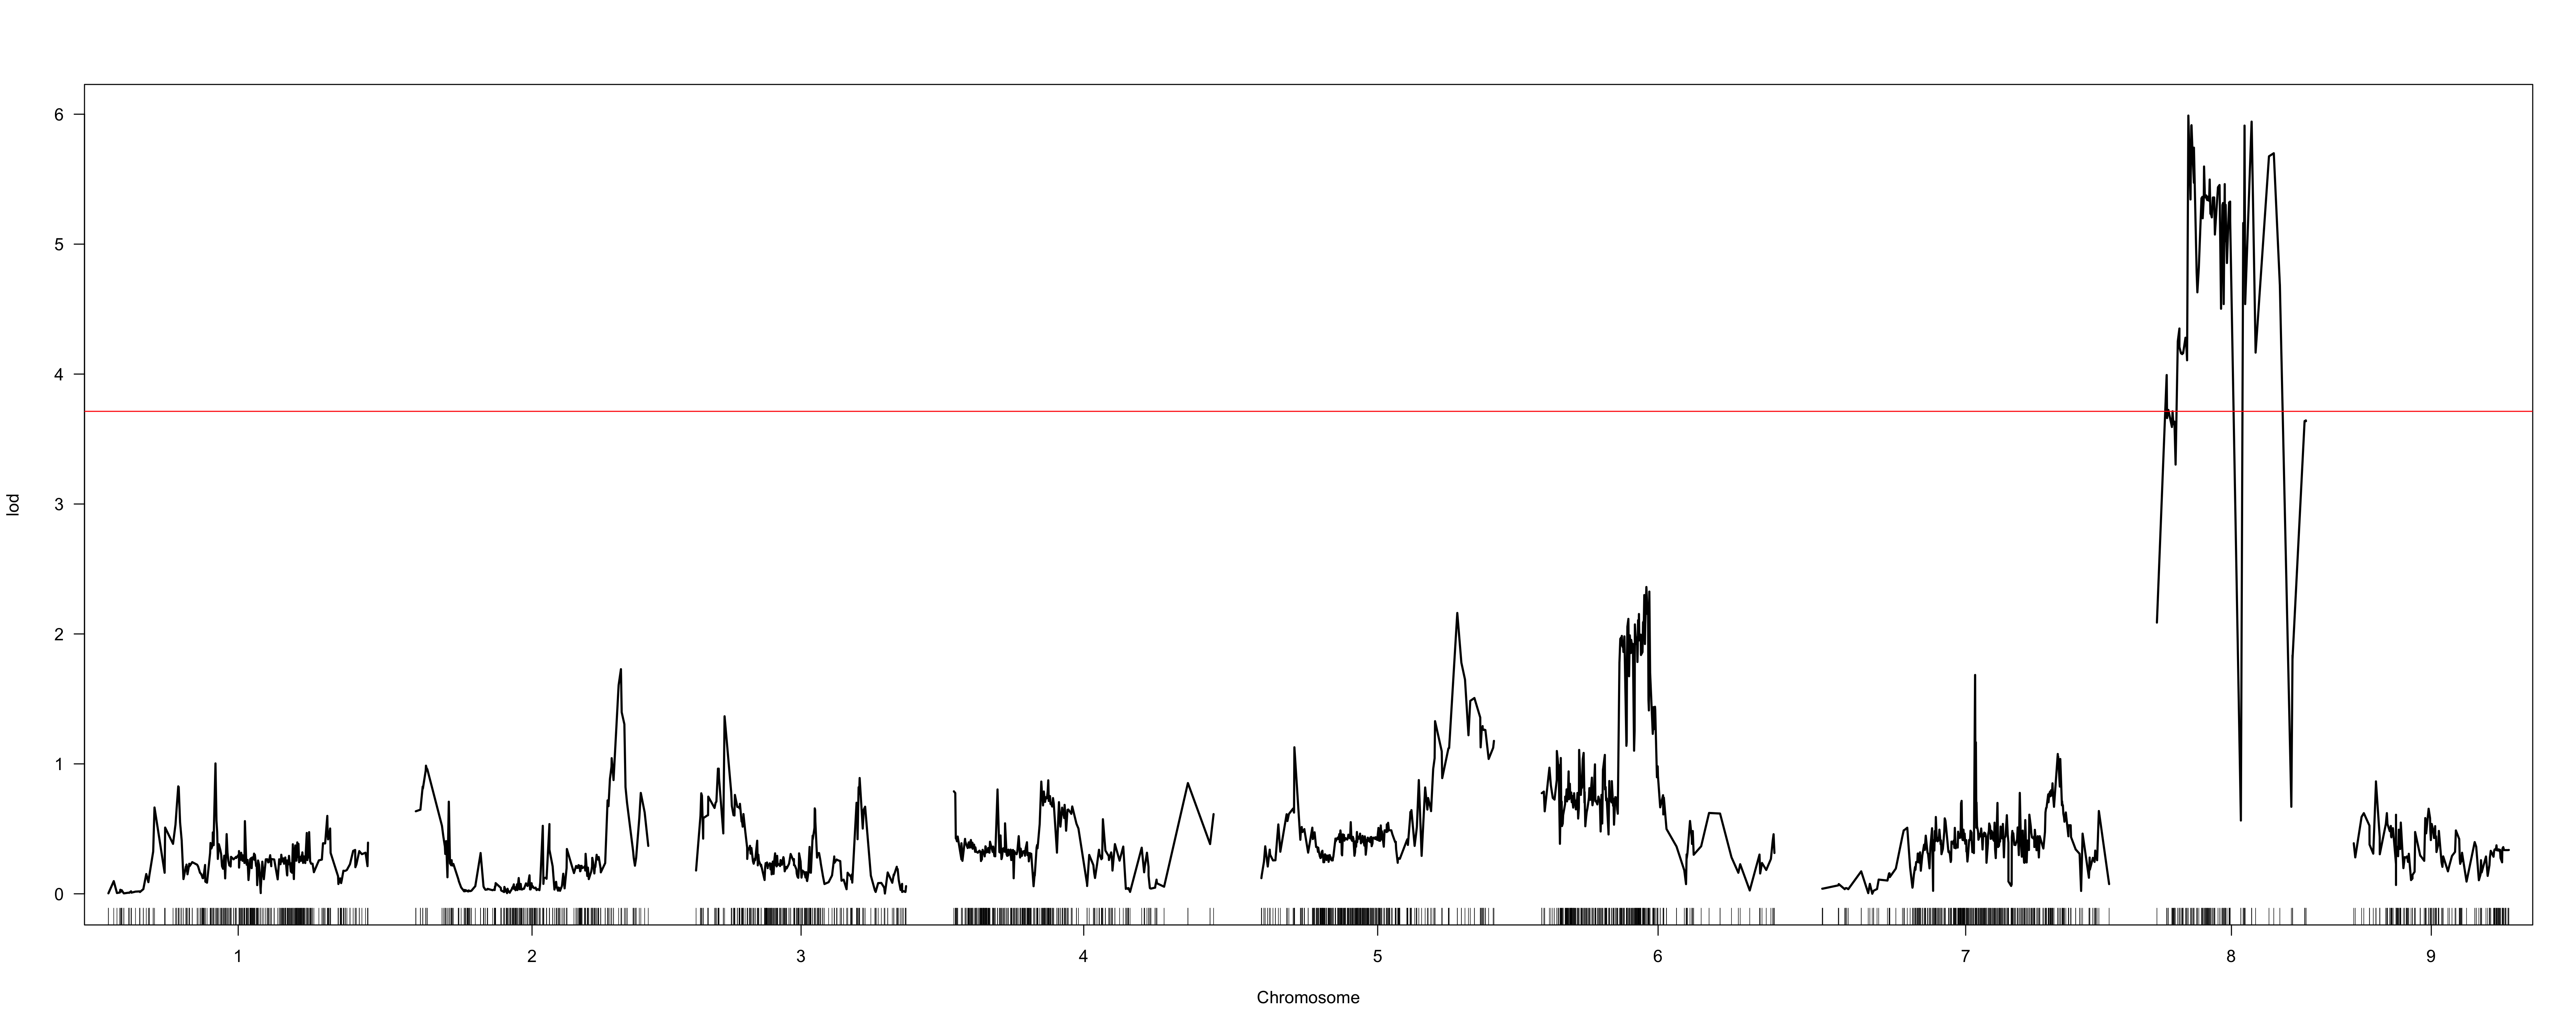
However, the extremely non-monotonic nature of the LOD profile in these regions seems to suggest local errors in the order of markers. I attempted to use orderMarkers to improve this order (map.function = "kosambi"), however this did not seem to solve this ordering issue. The LOD profile continues to seem inappropriately jitter-y, and substantial map inflation seems to have occurred (“hk-orderedMarkers.png” and “hk-orderedMarkers-chr8.png”).
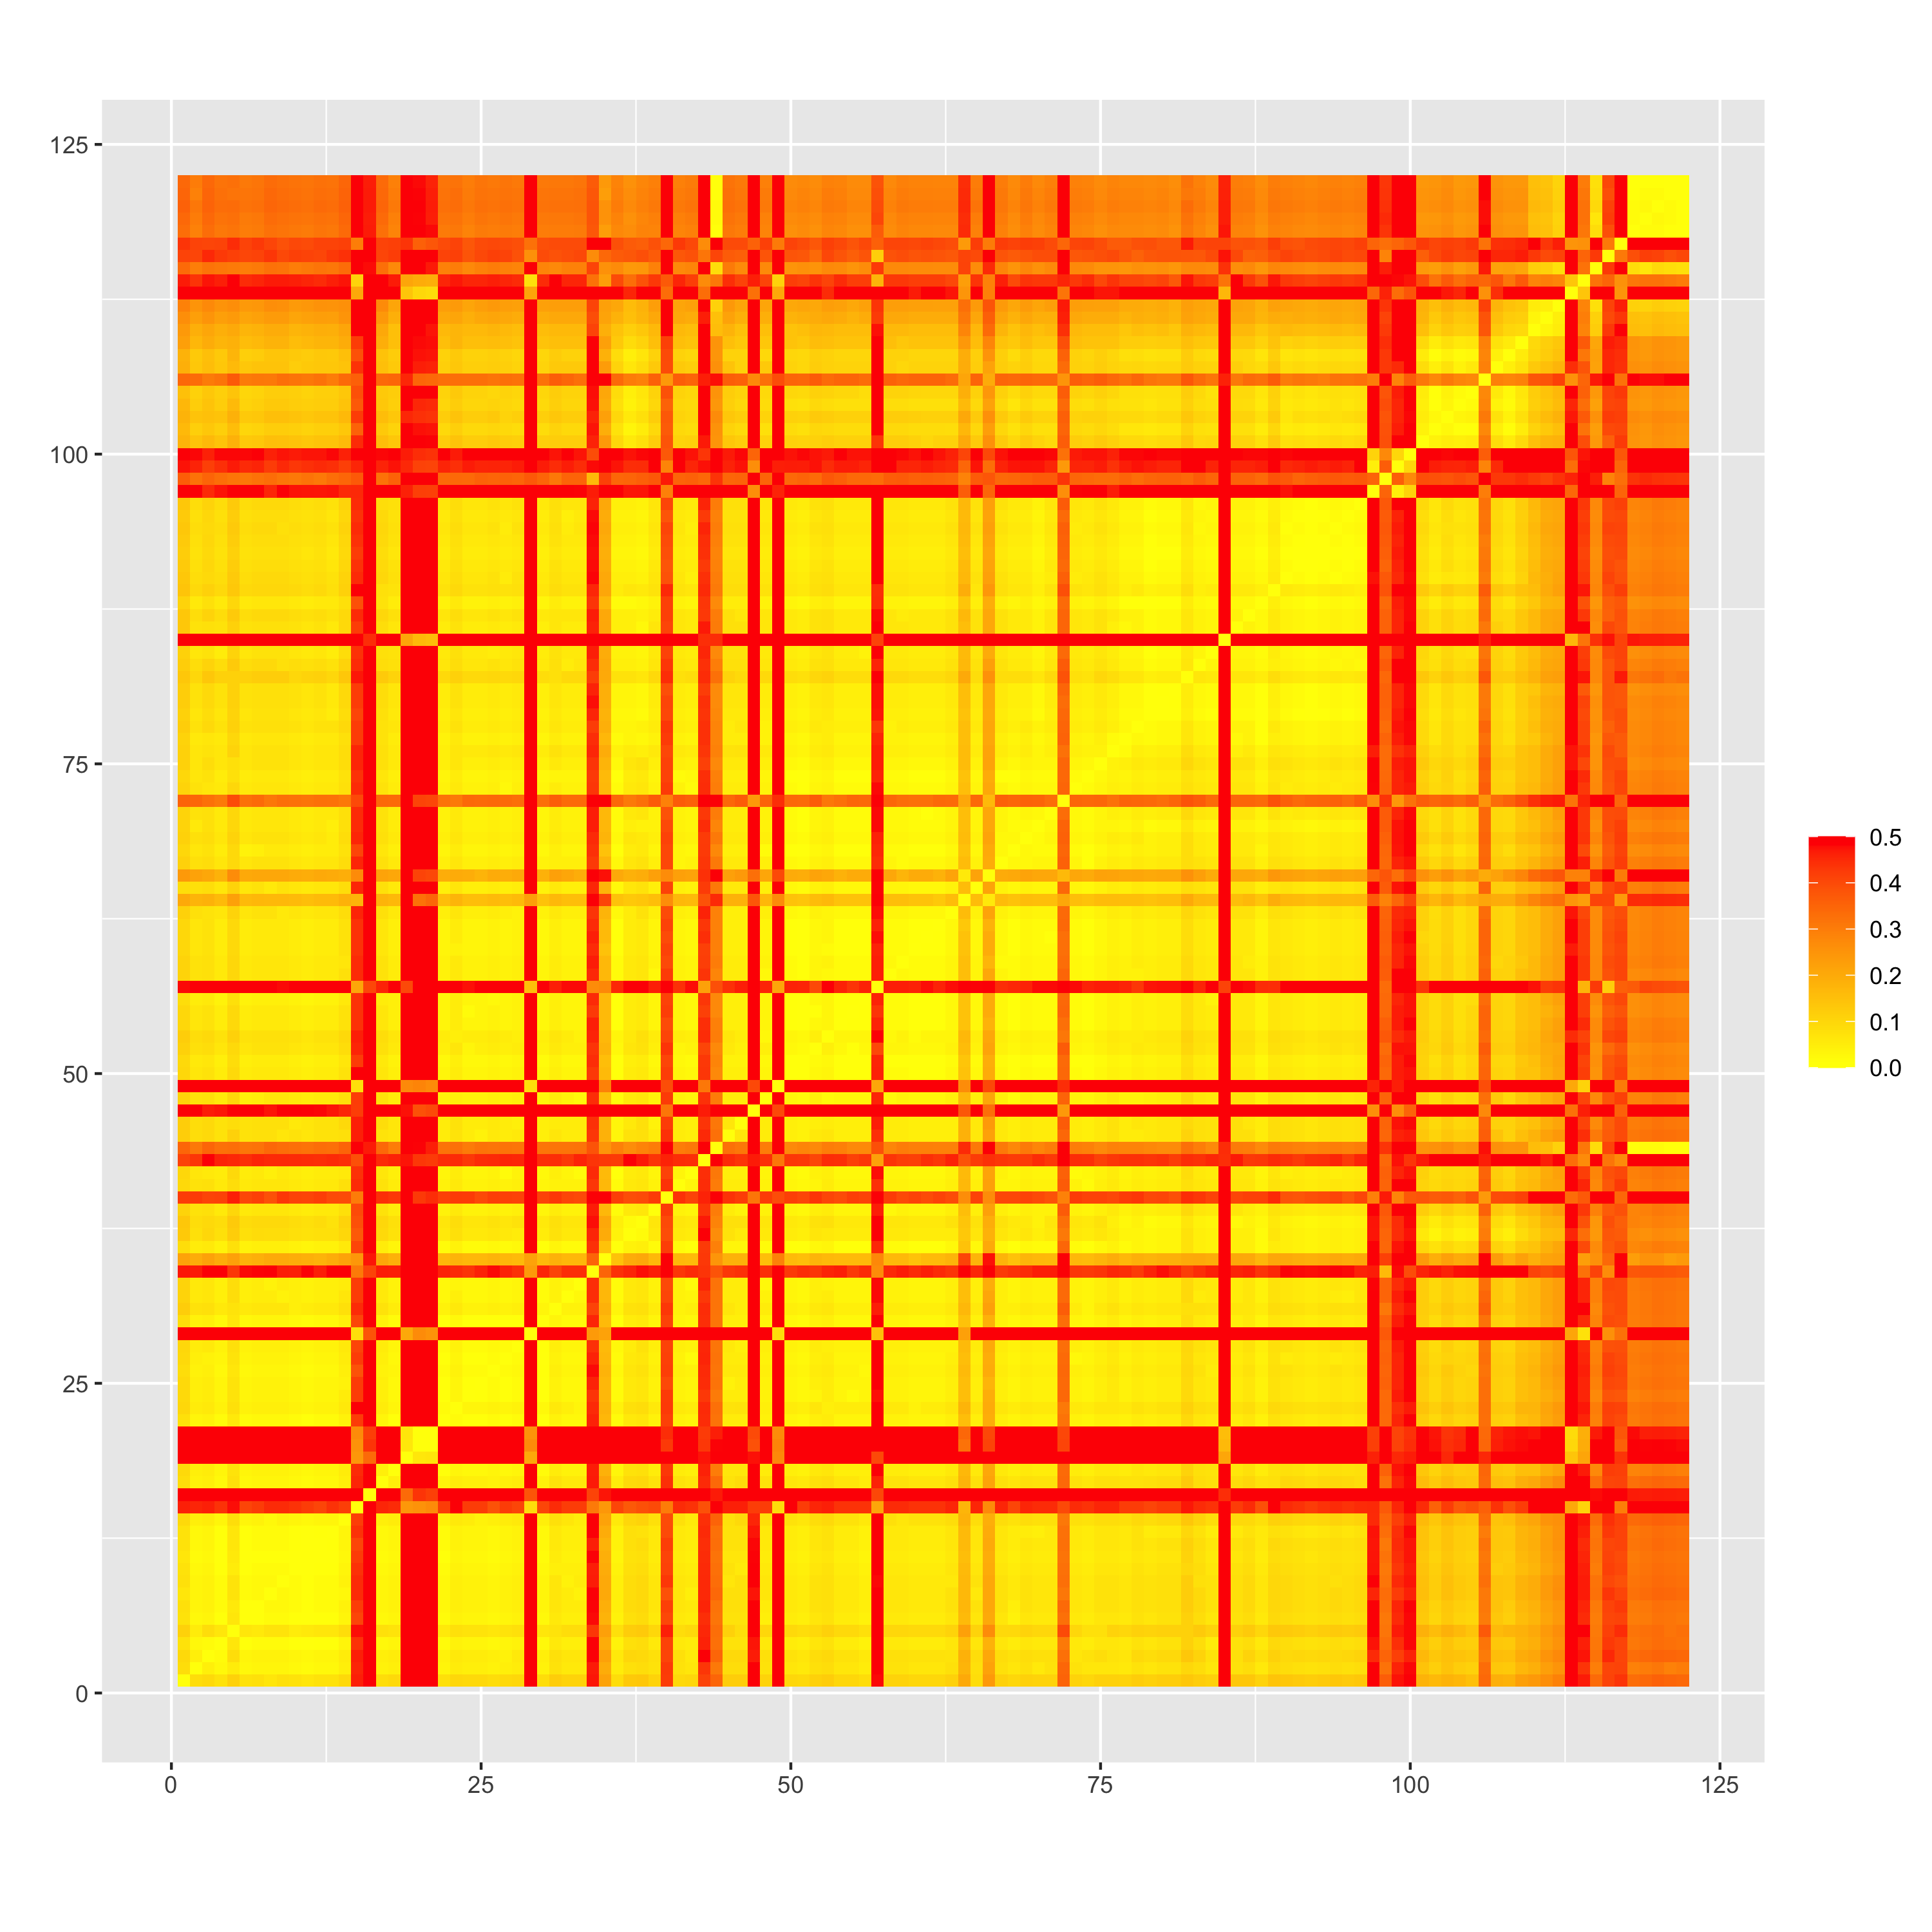
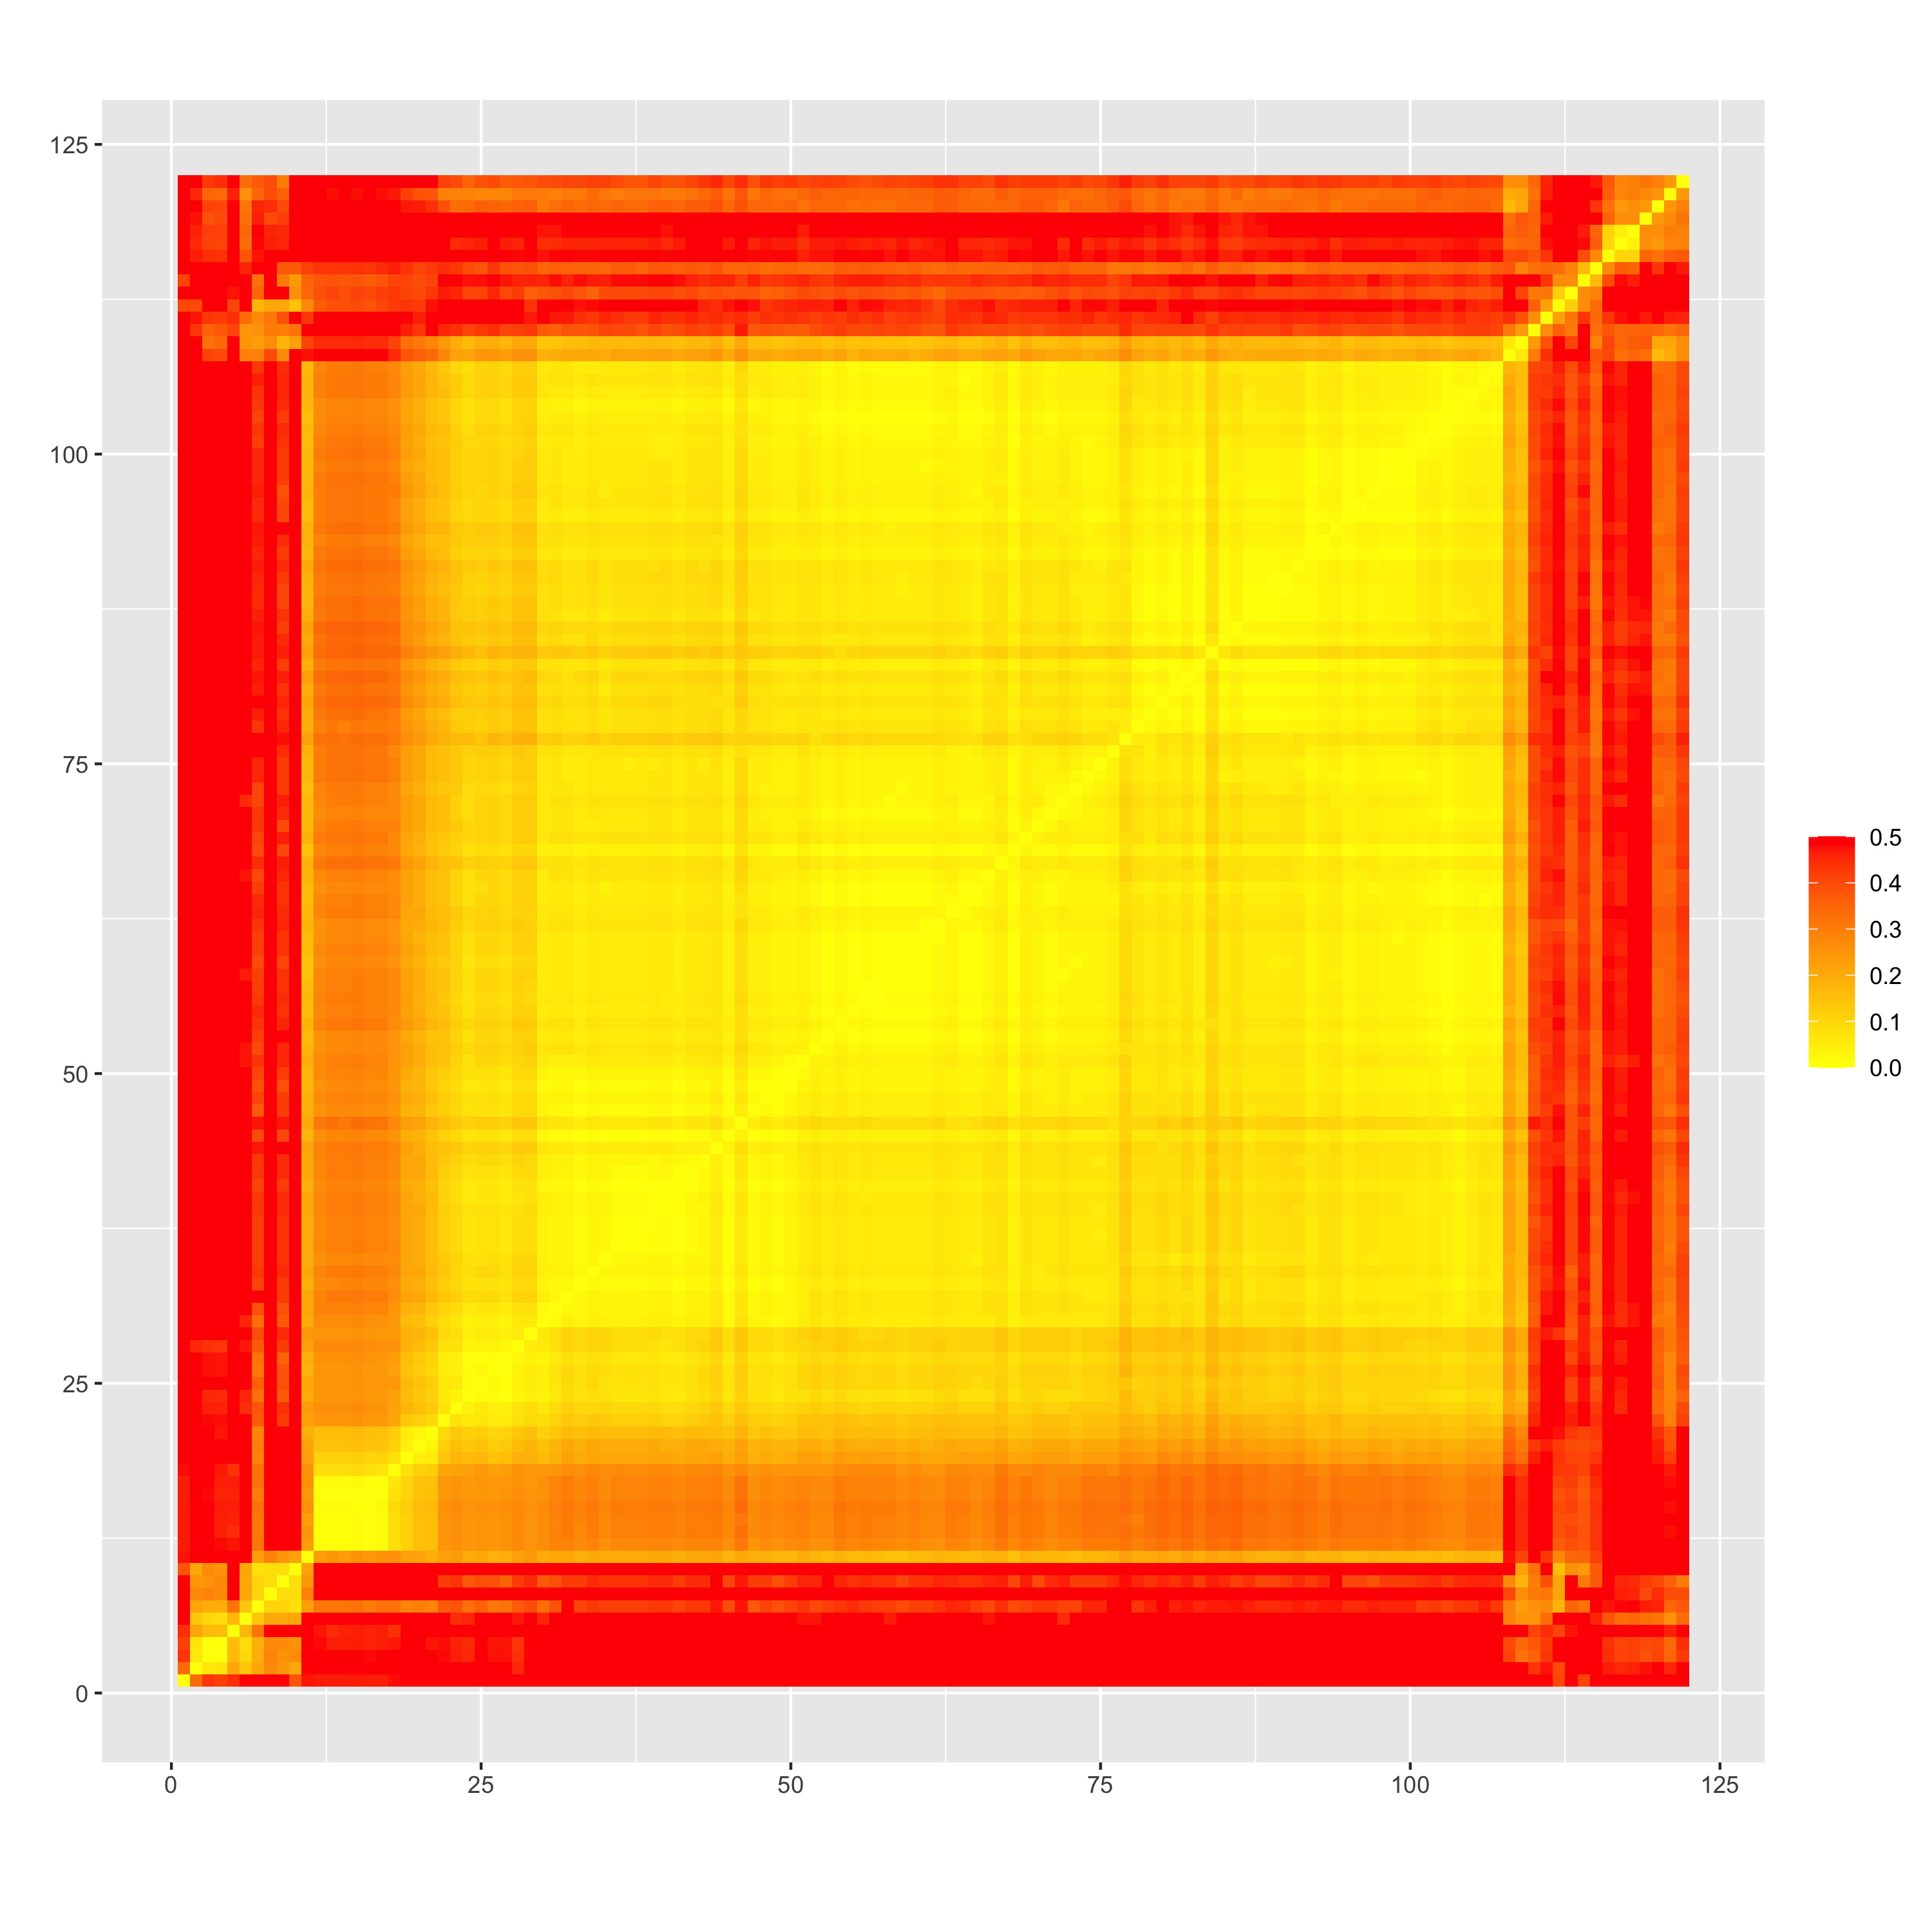
Heatmaps of recombination frequency before (“rf_initial_order.png”) and after ordering by minimizing SARF (“rf_reordered_order.png”) seem to suggest an extremely low rf between markers on this chromosome, which might be a partial explanation for why identifying the “correct” order appears to be challenging. This also seems to be the case when looking at LD between pairs of markers genome-wide (LD-decay.png)
I’m not quite sure what to make of these results, or if anyone has thoughts for how to attempt to improve marker order. I am happy to supply .rda objects or code snippets if that would be helpful for reproducing these results. Unordered geno and pheno .csv files are attached (pop2_geno-2135-markers.csv and pop2_pheno.csv)
Best,
Scott

Karl Broman
May 17, 2021, 1:23:22 PM5/17/21
to R/qtl discussion
I'll try poking around in the data to see what's going on, but it'll take me a few days before I can get to it.
From the hk-2135markers.png plot, it seems like there's one marker that's misplaced or has some other sort of problem.
The sort of variability in the LOD score in the hk-orderedMarkers.png plot is to be expected when you have very dense markers.
karl
Scott Brainard
May 18, 2021, 1:21:15 PM5/18/21
to R/qtl discussion
Hi Karl,
Thanks a ton for taking a look. No rush on my end.
If it would be helpful, I can share any intermediate files, or R code I used. Outside of rQTL, I performed LD pruning in bcftools, and then used this MapRTools to compute recombination frequencies and LOD scores (`MLEL`; https://github.com/jendelman/MapRtools/blob/master/R/MLEL.R), and convert cM to map distances (`genetic_map`; https://github.com/jendelman/MapRtools/blob/master/R/genetic_map.R).
Thanks again,
Scott
Karl Broman
May 18, 2021, 8:51:07 PM5/18/21
to R/qtl discussion
If you look at the result of geno.table() for chromosome 8, you'll see that there are a bunch of markers with strange segregation patterns.
But even if you drop those, there are still some markers that seem unlinked to the rest of the chromosome, and one of those, "SLCL|SCAFFOLD_8_47238483", seems to be causing the big dip in the LOD curve.
Rather than try to re-build the map entirely from scratch, I'd focus on omitting the markers that don't fit at all, and maybe re-mapping them if you can find a good place for them.
karl
library(qtl)
x <- read.cross("csvs", "", "pop2_geno-2135-markers.csv", "pop2_pheno.csv")
# prevent markers from being on top of each other
x <- jittermap(x)
# genome scan
x <- calc.genoprob(x, step=1, error.prob=0.002, map.function="kosambi")
out <- scanone(x, phe=2, method="hk")
plot(out)
# marker segregation on chr 8
geno.table(x, chr="8")
# drop markers deviating a great deal from 1:2:1
gt <- geno.table(x)
mar2drop <- rownames(gt)[gt$P.value < 0.01/nrow(gt)]
# re-run genome scan
x <- drop.markers(x, mar2drop)
x <- calc.genoprob(x, step=1, error.prob=0.002, map.function="kosambi")
out_rev <- scanone(x, phe=2, method="hk")
plot(out_rev)
# there's still a marker "SLCL|SCAFFOLD_8_47238483" which seems unlinked to surrounding markers
x <- drop.markers(x, "SLCL|SCAFFOLD_8_47238483")
x <- calc.genoprob(x, step=1, error.prob=0.002, map.function="kosambi")
out_rev2 <- scanone(x, phe=2, method="hk")
plot(out_rev2)
Scott Brainard
May 20, 2021, 10:36:57 PM5/20/21
to R/qtl discussion
Thanks so much, Karl!
One quick follow-up: how did you determine that that last marker (SLCL|SCAFFOLD_8_47238483) was unlinked to the rest of the chromosome?
While there is still some dip in the LOD profile, now most of chromosome 8 is continuously above the LOD threshold, with a 37 Mb C.I. according to `bayesint`. There’s also no evidence for 2 QTL versus 1 QTL, based on `scantwo`:
```
summary(x2)
pos1f pos2f lod.full lod.fv1 lod.int pos1a pos2a lod.add lod.av1
c8:c8 10.0 31.0 9.12 3.12 1.585 31.0 61.0 7.54 1.534
```
Given permutation results:
```
DR (1000 permutations)
full fv1 int add av1 one
5% 9.60 7.54 6.26 6.42 4.17 3.64
10% 9.08 7.13 5.80 5.96 3.86 3.26
```
So, I suppose this is one more case study of how bi-parental crosses often do not given very refined QTL positions in the F2 generation.
Thanks again for taking a look!
Best,
Scott
Karl Broman
May 21, 2021, 12:06:09 AM5/21/21
to R/qtl discussion
I used the qtlcharts package (https://kbroman.org/qtlcharts/) and hovered over the offending spot.
library(qtl)
x <- read.cross("csvs", "", "pop2_geno-2135-markers.csv", "pop2_pheno.csv")
x <- read.cross("csvs", "", "pop2_geno-2135-markers.csv", "pop2_pheno.csv")
x <- jittermap(x)
gt <- geno.table(x)
mar2drop <- rownames(gt)[gt$P.value < 0.01/nrow(gt)]
x <- drop.markers(x, mar2drop)
x <- calc.genoprob(x, step=1, error.prob=0.002, map.function="kosambi")
x <- calc.genoprob(x, step=1, error.prob=0.002, map.function="kosambi")
out <- scanone(x, phe=2, method="hk")
library(qtlcharts)
iplotScanone(out, x, pxg="raw", pheno.col=2)
iplotScanone(out, x, pxg="raw", pheno.col=2)
It's true that biparental crosses often do not give very precise QTL intervals, but the sample size (79) is also quite small.
The QTL has quite a strong effect; with a larger sample size, it could be mapped with good precision. Or it may turn out to be multiple causal loci.
karl
Scott Brainard
May 21, 2021, 10:34:30 AM5/21/21
to R/qtl discussion
Great, thanks!
Reply all
Reply to author
Forward
0 new messages