The Server's memory usage suddenly up and down recenlty.
133 views
Skip to first unread message

Yingchun Li
Jul 9, 2021, 12:14:15 AM7/9/21
to Repo and Gerrit Discussion
Hi, 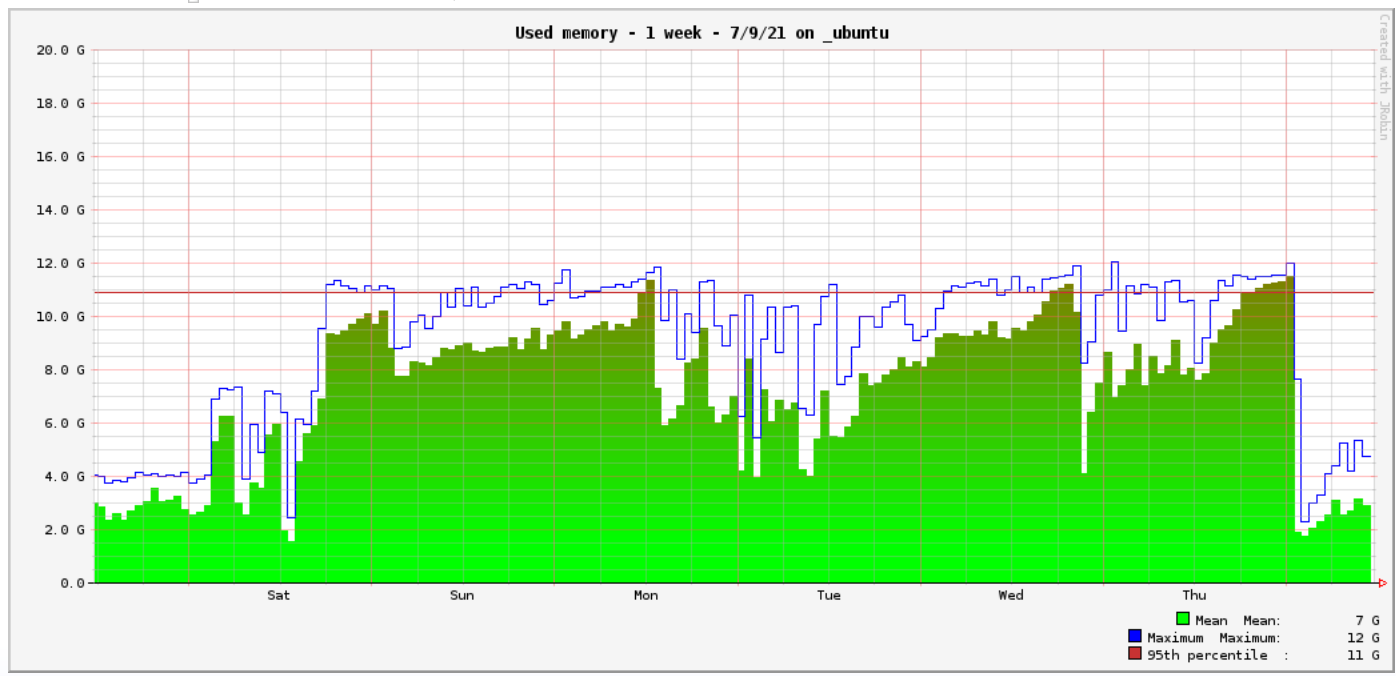


My gerrit server's memory usage suddenly consumed a lot on last Saturday.
the normal level is about 3G, but it go up to 10G. But today it go down to 3G again.
I checked the sshd_log, the upload/receive no suddenly change. My server
serve about 100 users. and everyday's upload is 1200(include the build server) and
receive is about 100. the sshd_log from Saturday:
The upload-pack
gerrit@ubuntu:~/temp$ grep "git-upload-pack" sshd_log.2021-07-01 | wc -l
1267
gerrit@ubuntu:~/temp$ grep "git-upload-pack" sshd_log.2021-07-02 | wc -l
1270
gerrit@ubuntu:~/temp$ grep "git-upload-pack" sshd_log.2021-07-03 | wc -l
999
gerrit@ubuntu:~/temp$ grep "git-upload-pack" sshd_log.2021-07-04 | wc -l
1061
gerrit@ubuntu:~/temp$ grep "git-upload-pack" sshd_log.2021-07-05 | wc -l
1573
gerrit@ubuntu:~/temp$ grep "git-upload-pack" sshd_log.2021-07-06 | wc -l
1232
gerrit@ubuntu:~/temp$ grep "git-upload-pack" sshd_log.2021-07-07 | wc -l
1281
gerrit@ubuntu:~/temp$ grep "git-upload-pack" sshd_log.2021-07-08 | wc -l
1153
the receive-pack
gerrit@ubuntu:~/temp$ grep "git-receive-pack" sshd_log.2021-07-01 | wc -l
141
gerrit@ubuntu:~/temp$ grep "git-receive-pack" sshd_log.2021-07-02 | wc -l
139
gerrit@ubuntu:~/temp$ grep "git-receive-pack" sshd_log.2021-07-03 | wc -l
105
gerrit@ubuntu:~/temp$ grep "git-receive-pack" sshd_log.2021-07-04 | wc -l
46
gerrit@ubuntu:~/temp$ grep "git-receive-pack" sshd_log.2021-07-05 | wc -l
140
gerrit@ubuntu:~/temp$ grep "git-receive-pack" sshd_log.2021-07-06 | wc -l
128
gerrit@ubuntu:~/temp$ grep "git-receive-pack" sshd_log.2021-07-07 | wc -l
126
gerrit@ubuntu:~/temp$ grep "git-receive-pack" sshd_log.2021-07-08 | wc -l
100
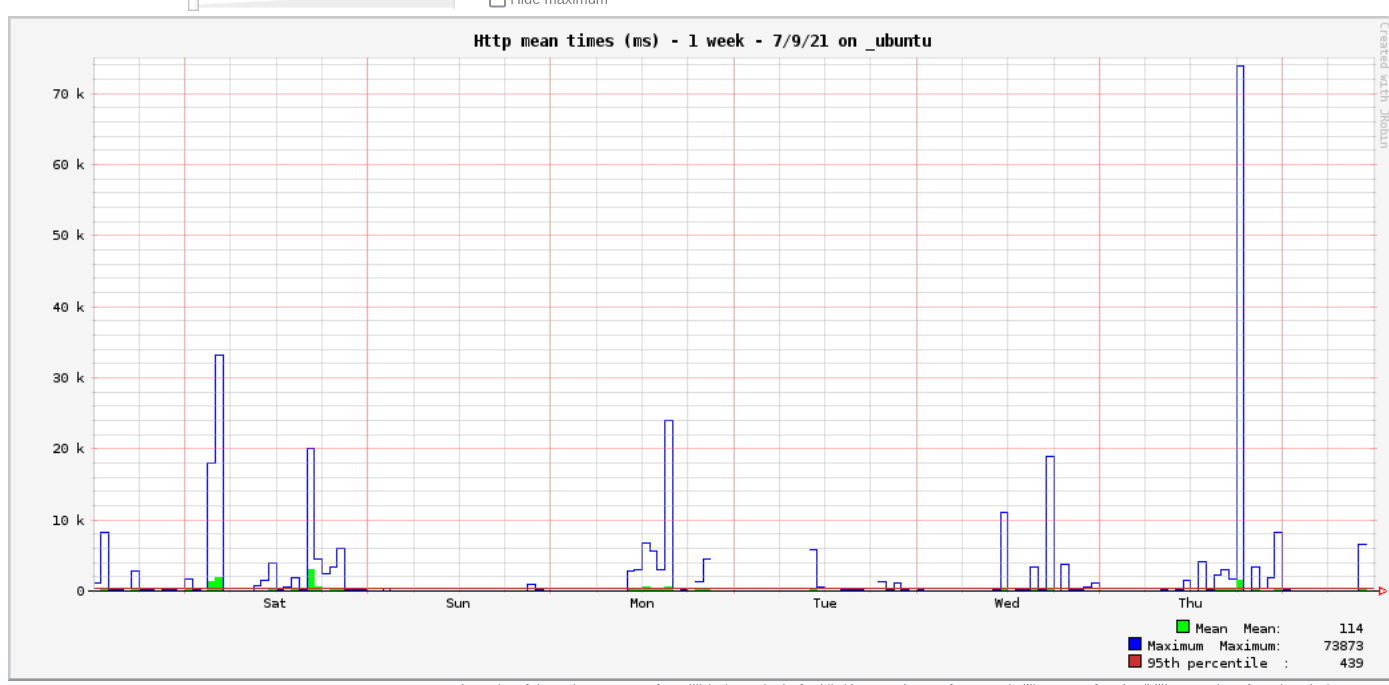
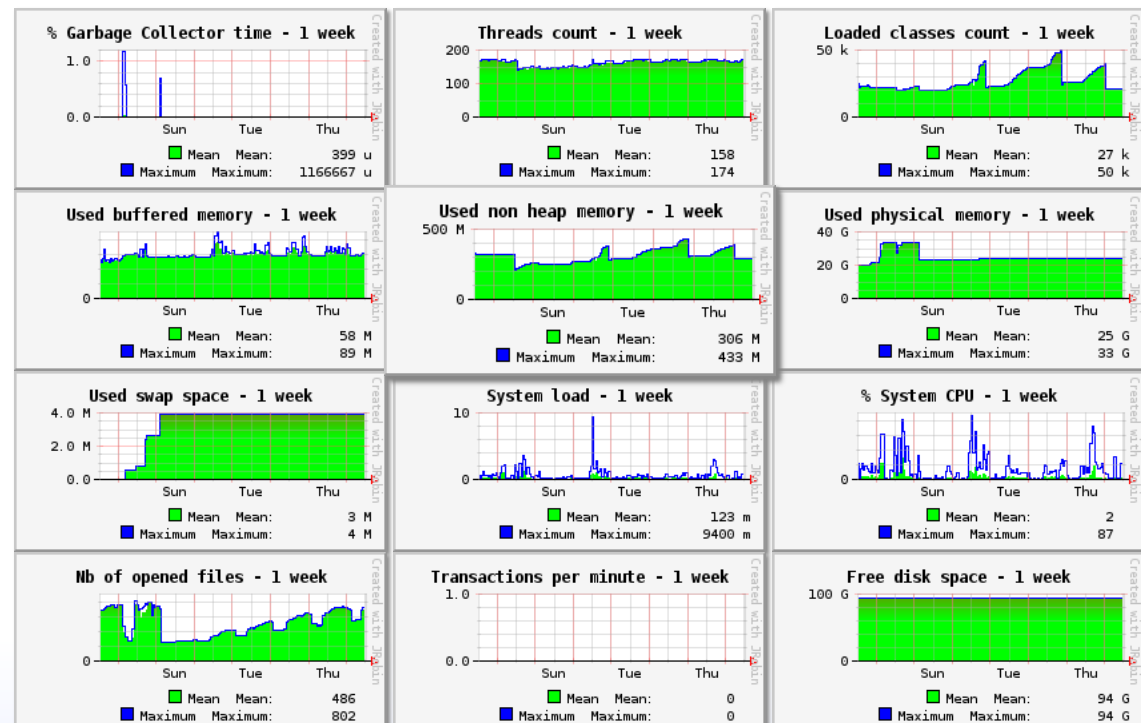
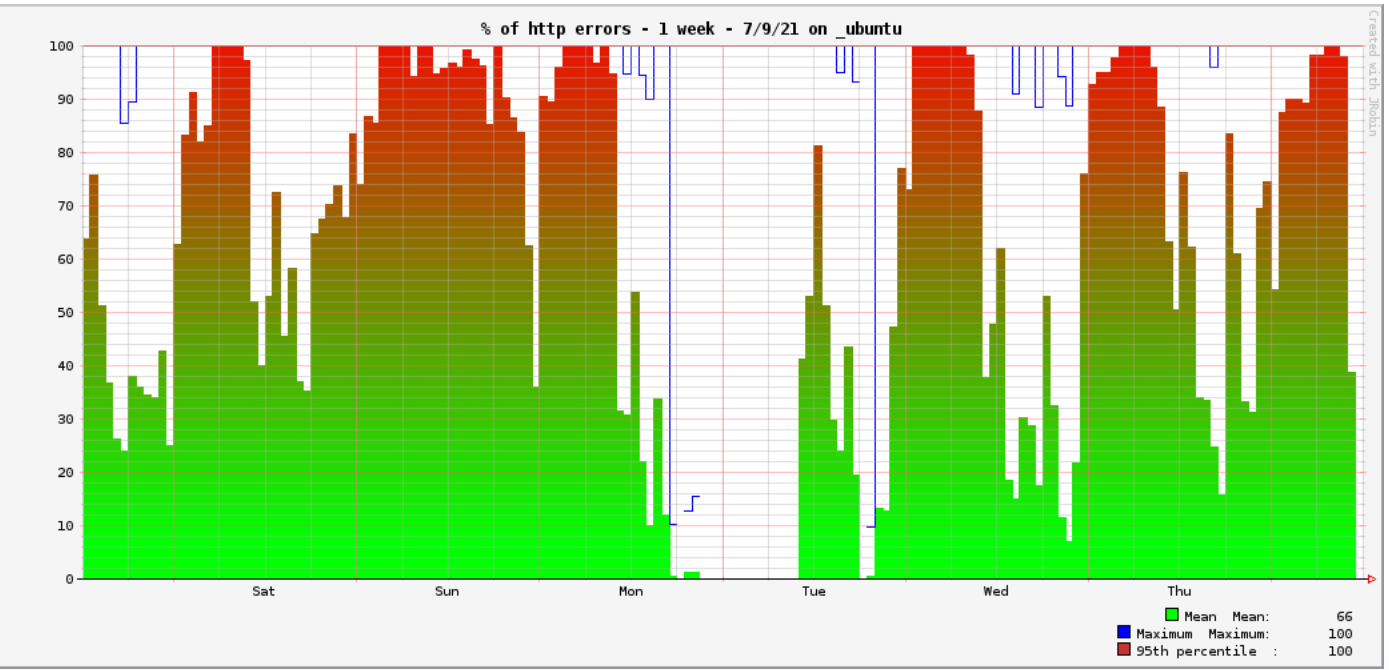
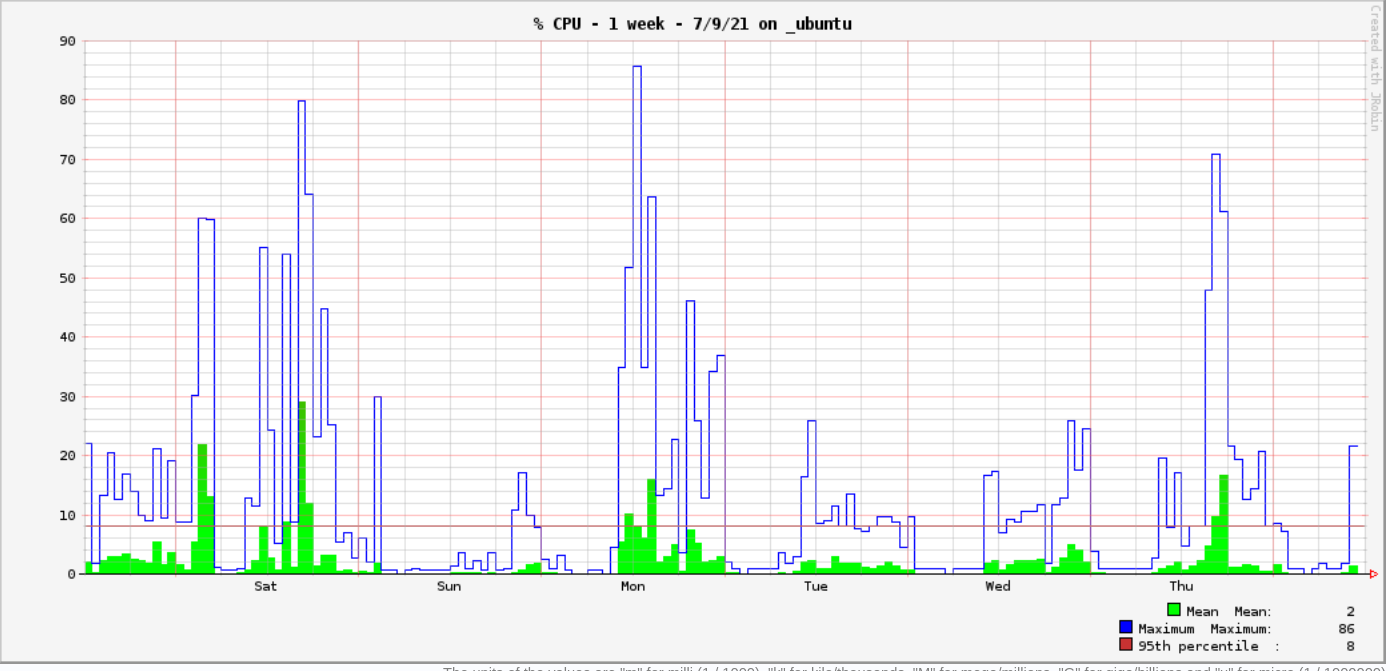
Following picture shows the Javamelody profiling:
But, Seems the performance was not effected, when I clone the repository, there is
no big difference.
My server has 4 cores cpu, and 32G memory, I use 16G as the Java Heap, biggest of my repo is about 400MB, following is part of my gerrit.config.
[container]
javaOptions = "-Dflogger.backend_factory=com.google.common.flogger.backend.log4j.Log4jBackendFactory#getInstance"
javaOptions = "-Dflogger.logging_context=com.google.gerrit.server.logging.LoggingContext#getInstance"
user = gerrit
javaHome = /usr/lib/jvm/java-11-openjdk-amd64
heapLimit = 16g
[database]
type = h2
database = db/ReviewDB
poolLimit = 50
poolMaxIdle = 16
[index]
type = lucene
...
[receive]
enableSignedPush = false
timeout = 4min
...
[sshd]
listenAddress = *:29418
threads = 32
batchThreads = 4
CommandStartThreads = 3
waitTimeout = 10m
enableChannelIdTracking = false
[cache]
directory = cache
[core]
#cache for the repo. should be the max size of one repo
packedGitLimit = 4g
packedGitWindowSize = 16k
packedGitOpenFiles = 2048
[pack]
threads = 4
[gc]
startTime = Sun 02:30
interval = 7 days
My gerrit version is 3.3.0.
Please give some clue why the memory usage is abnormal. Thanks.
Br,
Yingchun

Matthias Sohn
Jul 9, 2021, 4:56:08 AM7/9/21
to Yingchun Li, Repo and Gerrit Discussion
It's the JVM which decides when to spend how much effort on garbage collection to free some heap.
If there is not a lot of demand for allocating new objects on the heap the JVM may decide to defer
collecting garbage. If the load increases you'll see more frequent up and down of current heap size.
This graph looks like around 1 major garbage collection per day which means there's not much load.
For spotting issues you should rather look at the cpu% the JVM spends on Java gc.
If that goes above 10-15% you are overloading the JVM and you should either limit the load
by reducing thread pool sizes or scale vertically by adding cores and memory.
Another good indicator is queue size of the thread pools.
You may consider to use https://gerrit.googlesource.com/gerrit-monitoring/+/refs/heads/master
which provides dashboards for these metrics.


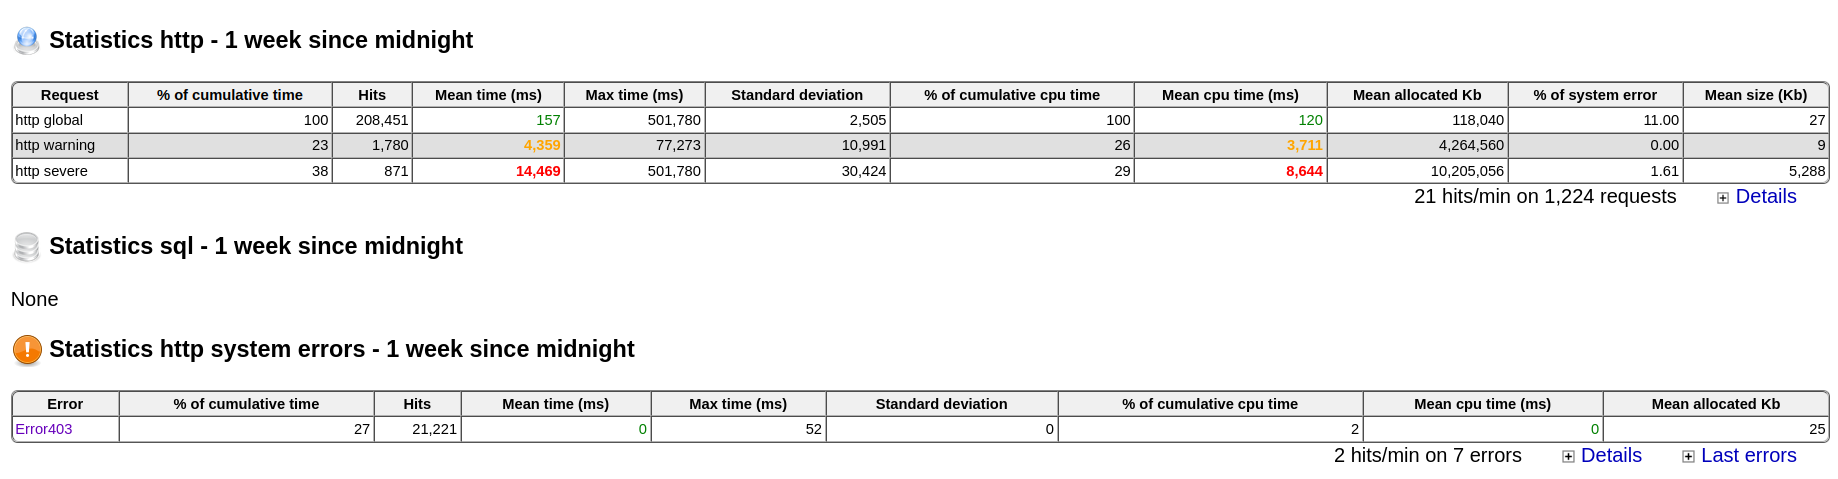
The percentage of HTTP errors seems high, did you check error_log what's going on ?
But, Seems the performance was not effected, when I clone the repository, there isno big difference.My server has 4 cores cpu, and 32G memory, I use 16G as the Java Heap, biggest of my repo is about 400MB, following is part of my gerrit.config.[container]javaOptions = "-Dflogger.backend_factory=com.google.common.flogger.backend.log4j.Log4jBackendFactory#getInstance"javaOptions = "-Dflogger.logging_context=com.google.gerrit.server.logging.LoggingContext#getInstance"user = gerritjavaHome = /usr/lib/jvm/java-11-openjdk-amd64heapLimit = 16g[database]type = h2database = db/ReviewDBpoolLimit = 50poolMaxIdle = 16

Gerrit 3.3 doesn't use a database so this config section is obsolete and can be removed.
[index]type = lucene...[receive]enableSignedPush = falsetimeout = 4min...[sshd]listenAddress = *:29418threads = 32
I think threads = 32 is too high for a server with 4 cores. AFAIR the default is 2*<number of cores> which would be 8 for your server.
As a rule of thumb you need one core per concurrent git request.
Typically the load of gerrit servers is dominated by fetch requests for the largest repositories.
Ensure that clients use git protocol version 2, this can improve performance a lot.
batchThreads = 4CommandStartThreads = 3waitTimeout = 10menableChannelIdTracking = false[cache]directory = cache[core]#cache for the repo. should be the max size of one repopackedGitLimit = 4gpackedGitWindowSize = 16kpackedGitOpenFiles = 2048
this might be too small depending on the number of repositories your server serves.
[pack]threads = 4[gc]startTime = Sun 02:30interval = 7 days
Optimal gc interval depends on how many push requests arrive for a repository.
I'd run gc at least once a day.
My gerrit version is 3.3.0.Please give some clue why the memory usage is abnormal. Thanks.
I think the memory usage of your server looks ok.
Br,Yingchun--
--
To unsubscribe, email repo-discuss...@googlegroups.com
More info at http://groups.google.com/group/repo-discuss?hl=en
---
You received this message because you are subscribed to the Google Groups "Repo and Gerrit Discussion" group.
To unsubscribe from this group and stop receiving emails from it, send an email to repo-discuss...@googlegroups.com.
To view this discussion on the web visit https://groups.google.com/d/msgid/repo-discuss/cd263f16-5ca7-4686-abca-417bb6531c15n%40googlegroups.com.
Yingchun Li
Jul 9, 2021, 6:06:12 AM7/9/21
to Repo and Gerrit Discussion
Thank you Matthias.
For reducing thread pool size, you mean the ssh threads?
[sshd]
....
threads = 32
...
or scale vertically by adding cores and memory.
Ok, seems the 4 cores are so few today.
Another good indicator is queue size of the thread pools.You may consider to use https://gerrit.googlesource.com/gerrit-monitoring/+/refs/heads/masterwhich provides dashboards for these metrics.
At first glance, seems this utility is complicated, there a lot of dependency. will install it later.
The percentage of HTTP errors seems high, did you check error_log what's going on ?


checked the error_log, there are a lot of "Logging context is not empty" error, some log like
following:
2021-07-09T15:58:18.288+08:00] [Index-Batch-4[java.util.concurrent.ScheduledThreadPoolExecutor$ScheduledFutureTask@57d7c1d4[Not completed, task = java.util.concurrent.Executors$RunnableAdapter@5ce818f2[Wrapped task = com.google.gerrit.server.logging.LoggingContextAwareRunnable@22593985]]]] WARN com.google.gerrit.server.logging.LoggingContextAwareRunnable : Logging context is not empty: LoggingContext{tags=null, forceLogging=null, performanceLogging=null, performanceLogRecords=MutablePerformanceLogRecords{performanceLogRecords=[]}}
And there are few usage error like "no changeid", but that make no sense.
Check the apache's http log, there are a lot of "403" errors, Don't know if
this is browser problem;
But, Seems the performance was not effected, when I clone the repository, there isno big difference.My server has 4 cores cpu, and 32G memory, I use 16G as the Java Heap, biggest of my repo is about 400MB, following is part of my gerrit.config.[container]javaOptions = "-Dflogger.backend_factory=com.google.common.flogger.backend.log4j.Log4jBackendFactory#getInstance"javaOptions = "-Dflogger.logging_context=com.google.gerrit.server.logging.LoggingContext#getInstance"user = gerritjavaHome = /usr/lib/jvm/java-11-openjdk-amd64heapLimit = 16g[database]type = h2database = db/ReviewDBpoolLimit = 50poolMaxIdle = 16Gerrit 3.3 doesn't use a database so this config section is obsolete and can be removed.

Thanks, will remove it.
[index]type = lucene...[receive]enableSignedPush = falsetimeout = 4min...[sshd]listenAddress = *:29418threads = 32I think threads = 32 is too high for a server with 4 cores. AFAIR the default is 2*<number of cores> which would be 8 for your server.As a rule of thumb you need one core per concurrent git request.
Ok, will increase the CPU cores and set them as this rule.
Typically the load of gerrit servers is dominated by fetch requests for the largest repositories.Ensure that clients use git protocol version 2, this can improve performance a lot.
batchThreads = 4CommandStartThreads = 3waitTimeout = 10menableChannelIdTracking = false[cache]directory = cache[core]#cache for the repo. should be the max size of one repopackedGitLimit = 4gpackedGitWindowSize = 16kpackedGitOpenFiles = 2048this might be too small depending on the number of repositories your server serves.
En, my biggest repo is about 500MB, it is not so big.
[pack]threads = 4[gc]startTime = Sun 02:30interval = 7 daysOptimal gc interval depends on how many push requests arrive for a repository.I'd run gc at least once a day.
Ok, Before I think the number of push/pull is not so big, so GC one time once a week.
Will decrease the period.
My gerrit version is 3.3.0.Please give some clue why the memory usage is abnormal. Thanks.I think the memory usage of your server looks ok.
Currently it seems OK, just want to get more knowledge why the memory consume up/down
abnormally.
Matthias Sohn
Jul 9, 2021, 3:19:32 PM7/9/21
to Yingchun Li, Repo and Gerrit Discussion
yes, I meant option sshd.threads
...or scale vertically by adding cores and memory.Ok, seems the 4 cores are so few today.
I didn't say that you need more cores, I said you need to consider that in case JVM overhead increases
beyond 10-15%. Another indication of an overloaded server is if the average system load goes above the number of cores
for prolonged periods [1] or the thread pool queues are growing all the time.
Another good indicator is queue size of the thread pools.You may consider to use https://gerrit.googlesource.com/gerrit-monitoring/+/refs/heads/masterwhich provides dashboards for these metrics.At first glance, seems this utility is complicated, there a lot of dependency. will install it later.The percentage of HTTP errors seems high, did you check error_log what's going on ?checked the error_log, there are a lot of "Logging context is not empty" error, some log likefollowing:2021-07-09T15:58:18.288+08:00] [Index-Batch-4[java.util.concurrent.ScheduledThreadPoolExecutor$ScheduledFutureTask@57d7c1d4[Not completed, task = java.util.concurrent.Executors$RunnableAdapter@5ce818f2[Wrapped task = com.google.gerrit.server.logging.LoggingContextAwareRunnable@22593985]]]] WARN com.google.gerrit.server.logging.LoggingContextAwareRunnable : Logging context is not empty: LoggingContext{tags=null, forceLogging=null, performanceLogging=null, performanceLogRecords=MutablePerformanceLogRecords{performanceLogRecords=[]}}And there are few usage error like "no changeid", but that make no sense.Check the apache's http log, there are a lot of "403" errors, Don't know ifthis is browser problem;


you can check in the http access log (http_log) which requests get 403 response for which user
I think you can't conclude from the above memory graph that you need more cores
Typically the load of gerrit servers is dominated by fetch requests for the largest repositories.Ensure that clients use git protocol version 2, this can improve performance a lot.batchThreads = 4CommandStartThreads = 3waitTimeout = 10menableChannelIdTracking = false[cache]directory = cache[core]#cache for the repo. should be the max size of one repopackedGitLimit = 4gpackedGitWindowSize = 16kpackedGitOpenFiles = 2048this might be too small depending on the number of repositories your server serves.En, my biggest repo is about 500MB, it is not so big.
I meant core.packedGitOpenFiles. Depending on how many pack files your server needs to serve this may limit efficiency
of the jgit buffer cache in case more than 2048 pack files consume less than 4GB in the cache.
[pack]threads = 4[gc]startTime = Sun 02:30interval = 7 daysOptimal gc interval depends on how many push requests arrive for a repository.I'd run gc at least once a day.Ok, Before I think the number of push/pull is not so big, so GC one time once a week.Will decrease the period.My gerrit version is 3.3.0.Please give some clue why the memory usage is abnormal. Thanks.I think the memory usage of your server looks ok.Currently it seems OK, just want to get more knowledge why the memory consume up/downabnormally.
I think the memory diagram you observed is not abnormal. That's the usual behavior of Java runtime.
This zig zag is normal, when load increases the heap will fill faster so Java gc needs to be scheduled more
and more frequently. If that happens so frequently that CPU spent on Java gc goes above 10-15% of
available CPU you should either throttle the system by reducing thread pool size or scale vertically.
Another approach is to offload read load to a replica server.
--Br,Yingchun--
--
To unsubscribe, email repo-discuss...@googlegroups.com
More info at http://groups.google.com/group/repo-discuss?hl=en
---
You received this message because you are subscribed to the Google Groups "Repo and Gerrit Discussion" group.
To unsubscribe from this group and stop receiving emails from it, send an email to repo-discuss...@googlegroups.com.
To view this discussion on the web visit https://groups.google.com/d/msgid/repo-discuss/cd263f16-5ca7-4686-abca-417bb6531c15n%40googlegroups.com.
--
To unsubscribe, email repo-discuss...@googlegroups.com
More info at http://groups.google.com/group/repo-discuss?hl=en
---
You received this message because you are subscribed to the Google Groups "Repo and Gerrit Discussion" group.
To unsubscribe from this group and stop receiving emails from it, send an email to repo-discuss...@googlegroups.com.
To view this discussion on the web visit https://groups.google.com/d/msgid/repo-discuss/1c55922a-6b46-4faa-8e7c-543320a9ae04n%40googlegroups.com.
Yingchun Li
Jul 10, 2021, 12:36:17 AM7/10/21
to Repo and Gerrit Discussion
Thanks for the link.
Another good indicator is queue size of the thread pools.You may consider to use https://gerrit.googlesource.com/gerrit-monitoring/+/refs/heads/masterwhich provides dashboards for these metrics.At first glance, seems this utility is complicated, there a lot of dependency. will install it later.The percentage of HTTP errors seems high, did you check error_log what's going on ?checked the error_log, there are a lot of "Logging context is not empty" error, some log likefollowing:2021-07-09T15:58:18.288+08:00] [Index-Batch-4[java.util.concurrent.ScheduledThreadPoolExecutor$ScheduledFutureTask@57d7c1d4[Not completed, task = java.util.concurrent.Executors$RunnableAdapter@5ce818f2[Wrapped task = com.google.gerrit.server.logging.LoggingContextAwareRunnable@22593985]]]] WARN com.google.gerrit.server.logging.LoggingContextAwareRunnable : Logging context is not empty: LoggingContext{tags=null, forceLogging=null, performanceLogging=null, performanceLogRecords=MutablePerformanceLogRecords{performanceLogRecords=[]}}And there are few usage error like "no changeid", but that make no sense.Check the apache's http log, there are a lot of "403" errors, Don't know ifthis is browser problem;you can check in the http access log (http_log) which requests get 403 response for which user


I check the gerrit.access, and just check my own case, there are a lot of 403 error for me. I am sure I did do any work in this period, just open the gerrit web and left it alone. seems __every minute__ there will be a 403 error.
the log:
gerrit@ubuntu:/var/log/apache2$ cat gerrit_access.log | grep my_login_name
192.168.10.131 - my_login_name [10/Jul/2021:00:01:30 +0800] "GET /auth-check HTTP/1.1" 403 314 "-" "Mozilla/5.0 (X11; Ubuntu; Linux x86_64; rv:89.0) Gecko/20100101 Firefox/89.0"
192.168.10.131 - my_login_name [10/Jul/2021:00:02:31 +0800] "GET /auth-check HTTP/1.1" 403 314 "-" "Mozilla/5.0 (X11; Ubuntu; Linux x86_64; rv:89.0) Gecko/20100101 Firefox/89.0"
192.168.10.131 - my_login_name [10/Jul/2021:00:03:31 +0800] "GET /auth-check HTTP/1.1" 403 314 "-" "Mozilla/5.0 (X11; Ubuntu; Linux x86_64; rv:89.0) Gecko/20100101 Firefox/89.0"
192.168.10.131 - my_login_name [10/Jul/2021:00:04:31 +0800] "GET /auth-check HTTP/1.1" 403 314 "-" "Mozilla/5.0 (X11; Ubuntu; Linux x86_64; rv:89.0) Gecko/20100101 Firefox/89.0"
192.168.10.131 - my_login_name [10/Jul/2021:00:05:31 +0800] "GET /auth-check HTTP/1.1" 403 314 "-" "Mozilla/5.0 (X11; Ubuntu; Linux x86_64; rv:89.0) Gecko/20100101 Firefox/89.0"
192.168.10.131 - my_login_name [10/Jul/2021:00:06:31 +0800] "GET /auth-check HTTP/1.1" 403 314 "-" "Mozilla/5.0 (X11; Ubuntu; Linux x86_64; rv:89.0) Gecko/20100101 Firefox/89.0"
192.168.10.131 - my_login_name [10/Jul/2021:00:07:31 +0800] "GET /auth-check HTTP/1.1" 403 314 "-" "Mozilla/5.0 (X11; Ubuntu; Linux x86_64; rv:89.0) Gecko/20100101 Firefox/89.0"
192.168.10.131 - my_login_name [10/Jul/2021:00:08:31 +0800] "GET /auth-check HTTP/1.1" 403 314 "-" "Mozilla/5.0 (X11; Ubuntu; Linux x86_64; rv:89.0) Gecko/20100101 Firefox/89.0"
192.168.10.131 - my_login_name [10/Jul/2021:00:09:31 +0800] "GET /auth-check HTTP/1.1" 403 314 "-" "Mozilla/5.0 (X11; Ubuntu; Linux x86_64; rv:89.0) Gecko/20100101 Firefox/89.0"
192.168.10.131 - my_login_name [10/Jul/2021:00:10:31 +0800] "GET /auth-check HTTP/1.1" 403 314 "-" "Mozilla/5.0 (X11; Ubuntu; Linux x86_64; rv:89.0) Gecko/20100101 Firefox/89.0"
192.168.10.131 - my_login_name [10/Jul/2021:00:11:31 +0800] "GET /auth-check HTTP/1.1" 403 314 "-" "Mozilla/5.0 (X11; Ubuntu; Linux x86_64; rv:89.0) Gecko/20100101 Firefox/89.0"
192.168.10.131 - my_login_name [10/Jul/2021:00:12:31 +0800] "GET /auth-check HTTP/1.1" 403 314 "-" "Mozilla/5.0 (X11; Ubuntu; Linux x86_64; rv:89.0) Gecko/20100101 Firefox/89.0"
192.168.10.131 - my_login_name [10/Jul/2021:00:13:31 +0800] "GET /auth-check HTTP/1.1" 403 314 "-" "Mozilla/5.0 (X11; Ubuntu; Linux x86_64; rv:89.0) Gecko/20100101 Firefox/89.0"
192.168.10.131 - my_login_name [10/Jul/2021:00:14:31 +0800] "GET /auth-check HTTP/1.1" 403 314 "-" "Mozilla/5.0 (X11; Ubuntu; Linux x86_64; rv:89.0) Gecko/20100101 Firefox/89.0"
192.168.10.131 - my_login_name [10/Jul/2021:00:15:31 +0800] "GET /auth-check HTTP/1.1" 403 314 "-" "Mozilla/5.0 (X11; Ubuntu; Linux x86_64; rv:89.0) Gecko/20100101 Firefox/89.0"
192.168.10.131 - my_login_name [10/Jul/2021:00:16:31 +0800] "GET /auth-check HTTP/1.1" 403 314 "-" "Mozilla/5.0 (X11; Ubuntu; Linux x86_64; rv:89.0) Gecko/20100101 Firefox/89.0"
192.168.10.131 - my_login_name [10/Jul/2021:00:17:32 +0800] "GET /auth-check HTTP/1.1" 403 314 "-" "Mozilla/5.0 (X11; Ubuntu; Linux x86_64; rv:89.0) Gecko/20100101 Firefox/89.0"
192.168.10.131 - my_login_name [10/Jul/2021:00:18:32 +0800] "GET /auth-check HTTP/1.1" 403 314 "-" "Mozilla/5.0 (X11; Ubuntu; Linux x86_64; rv:89.0) Gecko/20100101 Firefox/89.0"
192.168.10.131 - my_login_name [10/Jul/2021:00:19:32 +0800] "GET /auth-check HTTP/1.1" 403 314 "-" "Mozilla/5.0 (X11; Ubuntu; Linux x86_64; rv:89.0) Gecko/20100101 Firefox/89.0"
192.168.10.131 - my_login_name [10/Jul/2021:00:20:32 +0800] "GET /auth-check HTTP/1.1" 403 314 "-" "Mozilla/5.0 (X11; Ubuntu; Linux x86_64; rv:89.0) Gecko/20100101 Firefox/89.0"
192.168.10.131 - my_login_name [10/Jul/2021:00:21:32 +0800] "GET /auth-check HTTP/1.1" 403 314 "-" "Mozilla/5.0 (X11; Ubuntu; Linux x86_64; rv:89.0) Gecko/20100101 Firefox/89.0"
192.168.10.131 - my_login_name [10/Jul/2021:00:22:32 +0800] "GET /auth-check HTTP/1.1" 403 314 "-" "Mozilla/5.0 (X11; Ubuntu; Linux x86_64; rv:89.0) Gecko/20100101 Firefox/89.0"
192.168.10.131 - my_login_name [10/Jul/2021:00:23:32 +0800] "GET /auth-check HTTP/1.1" 403 314 "-" "Mozilla/5.0 (X11; Ubuntu; Linux x86_64; rv:89.0) Gecko/20100101 Firefox/89.0"
192.168.10.131 - my_login_name [10/Jul/2021:00:24:32 +0800] "GET /auth-check HTTP/1.1" 403 314 "-" "Mozilla/5.0 (X11; Ubuntu; Linux x86_64; rv:89.0) Gecko/20100101 Firefox/89.0"
192.168.10.131 - my_login_name [10/Jul/2021:00:25:32 +0800] "GET /auth-check HTTP/1.1" 403 314 "-" "Mozilla/5.0 (X11; Ubuntu; Linux x86_64; rv:89.0) Gecko/20100101 Firefox/89.0"
192.168.10.131 - my_login_name [10/Jul/2021:00:26:32 +0800] "GET /auth-check HTTP/1.1" 403 314 "-" "Mozilla/5.0 (X11; Ubuntu; Linux x86_64; rv:89.0) Gecko/20100101 Firefox/89.0"
192.168.10.131 - my_login_name [10/Jul/2021:00:27:32 +0800] "GET /auth-check HTTP/1.1" 403 314 "-" "Mozilla/5.0 (X11; Ubuntu; Linux x86_64; rv:89.0) Gecko/20100101 Firefox/89.0"
192.168.10.131 - my_login_name [10/Jul/2021:00:28:32 +0800] "GET /auth-check HTTP/1.1" 403 314 "-" "Mozilla/5.0 (X11; Ubuntu; Linux x86_64; rv:89.0) Gecko/20100101 Firefox/89.0"
192.168.10.131 - my_login_name [10/Jul/2021:00:29:32 +0800] "GET /auth-check HTTP/1.1" 403 314 "-" "Mozilla/5.0 (X11; Ubuntu; Linux x86_64; rv:89.0) Gecko/20100101 Firefox/89.0"
192.168.10.131 - my_login_name [10/Jul/2021:00:30:32 +0800] "GET /auth-check HTTP/1.1" 403 314 "-" "Mozilla/5.0 (X11; Ubuntu; Linux x86_64; rv:89.0) Gecko/20100101 Firefox/89.0"
192.168.10.131 - my_login_name [10/Jul/2021:00:31:32 +0800] "GET /auth-check HTTP/1.1" 403 314 "-" "Mozilla/5.0 (X11; Ubuntu; Linux x86_64; rv:89.0) Gecko/20100101 Firefox/89.0"
192.168.10.131 - my_login_name [10/Jul/2021:00:32:32 +0800] "GET /auth-check HTTP/1.1" 403 314 "-" "Mozilla/5.0 (X11; Ubuntu; Linux x86_64; rv:89.0) Gecko/20100101 Firefox/89.0"
192.168.10.131 - my_login_name [10/Jul/2021:00:33:33 +0800] "GET /auth-check HTTP/1.1" 403 314 "-" "Mozilla/5.0 (X11; Ubuntu; Linux x86_64; rv:89.0) Gecko/20100101 Firefox/89.0"
192.168.10.131 - my_login_name [10/Jul/2021:00:34:33 +0800] "GET /auth-check HTTP/1.1" 403 314 "-" "Mozilla/5.0 (X11; Ubuntu; Linux x86_64; rv:89.0) Gecko/20100101 Firefox/89.0"
192.168.10.131 - my_login_name [10/Jul/2021:00:35:33 +0800] "GET /auth-check HTTP/1.1" 403 314 "-" "Mozilla/5.0 (X11; Ubuntu; Linux x86_64; rv:89.0) Gecko/20100101 Firefox/89.0"
192.168.10.131 - my_login_name [10/Jul/2021:00:36:33 +0800] "GET /auth-check HTTP/1.1" 403 314 "-" "Mozilla/5.0 (X11; Ubuntu; Linux x86_64; rv:89.0) Gecko/20100101 Firefox/89.0"
192.168.10.131 - my_login_name [10/Jul/2021:00:37:33 +0800] "GET /auth-check HTTP/1.1" 403 314 "-" "Mozilla/5.0 (X11; Ubuntu; Linux x86_64; rv:89.0) Gecko/20100101 Firefox/89.0"
192.168.10.131 - my_login_name [10/Jul/2021:00:38:33 +0800] "GET /auth-check HTTP/1.1" 403 314 "-" "Mozilla/5.0 (X11; Ubuntu; Linux x86_64; rv:89.0) Gecko/20100101 Firefox/89.0"
192.168.10.131 - my_login_name [10/Jul/2021:00:39:33 +0800] "GET /auth-check HTTP/1.1" 403 314 "-" "Mozilla/5.0 (X11; Ubuntu; Linux x86_64; rv:89.0) Gecko/20100101 Firefox/89.0"
192.168.10.131 - my_login_name [10/Jul/2021:00:40:33 +0800] "GET /auth-check HTTP/1.1" 403 314 "-" "Mozilla/5.0 (X11; Ubuntu; Linux x86_64; rv:89.0) Gecko/20100101 Firefox/89.0"
192.168.10.131 - my_login_name [10/Jul/2021:00:41:33 +0800] "GET /auth-check HTTP/1.1" 403 314 "-" "Mozilla/5.0 (X11; Ubuntu; Linux x86_64; rv:89.0) Gecko/20100101 Firefox/89.0"
192.168.10.131 - my_login_name [10/Jul/2021:00:42:33 +0800] "GET /auth-check HTTP/1.1" 403 314 "-" "Mozilla/5.0 (X11; Ubuntu; Linux x86_64; rv:89.0) Gecko/20100101 Firefox/89.0"
192.168.10.131 - my_login_name [10/Jul/2021:00:43:33 +0800] "GET /auth-check HTTP/1.1" 403 314 "-" "Mozilla/5.0 (X11; Ubuntu; Linux x86_64; rv:89.0) Gecko/20100101 Firefox/89.0"
192.168.10.131 - my_login_name [10/Jul/2021:00:44:33 +0800] "GET /auth-check HTTP/1.1" 403 314 "-" "Mozilla/5.0 (X11; Ubuntu; Linux x86_64; rv:89.0) Gecko/20100101 Firefox/89.0"
192.168.10.131 - my_login_name [10/Jul/2021:00:45:33 +0800] "GET /auth-check HTTP/1.1" 403 314 "-" "Mozilla/5.0 (X11; Ubuntu; Linux x86_64; rv:89.0) Gecko/20100101 Firefox/89.0"
192.168.10.131 - my_login_name [10/Jul/2021:00:46:33 +0800] "GET /auth-check HTTP/1.1" 403 314 "-" "Mozilla/5.0 (X11; Ubuntu; Linux x86_64; rv:89.0) Gecko/20100101 Firefox/89.0"
192.168.10.131 - my_login_name [10/Jul/2021:00:47:33 +0800] "GET /auth-check HTTP/1.1" 403 314 "-" "Mozilla/5.0 (X11; Ubuntu; Linux x86_64; rv:89.0) Gecko/20100101 Firefox/89.0"
192.168.10.131 - my_login_name [10/Jul/2021:00:48:34 +0800] "GET /auth-check HTTP/1.1" 403 314 "-" "Mozilla/5.0 (X11; Ubuntu; Linux x86_64; rv:89.0) Gecko/20100101 Firefox/89.0"
192.168.10.131 - my_login_name [10/Jul/2021:00:49:34 +0800] "GET /auth-check HTTP/1.1" 403 314 "-" "Mozilla/5.0 (X11; Ubuntu; Linux x86_64; rv:89.0) Gecko/20100101 Firefox/89.0"
192.168.10.131 - my_login_name [10/Jul/2021:00:50:34 +0800] "GET /auth-check HTTP/1.1" 403 314 "-" "Mozilla/5.0 (X11; Ubuntu; Linux x86_64; rv:89.0) Gecko/20100101 Firefox/89.0"
Reply all
Reply to author
Forward
0 new messages