100 parallel clones uses entire server memory after 3.4.4 upgrade

Nuno Costa
java...@11.0.15/jdk.internal.misc.Unsafe.park(Native Method)
java...@11.0.15/java.util.concurrent.locks.LockSupport.park(LockSupport.java:194)
java...@11.0.15/java.util.concurrent.ForkJoinPool.runWorker(ForkJoinPool.java:1628)
java...@11.0.15/java.util.concurrent.ForkJoinWorkerThread.run(ForkJoinWorkerThread.java:183)

Nasser Grainawi
Hi All,During stress tests after upgrade from 3.2.7 to 3.4.4, we are seeing all available memory being used and gerrit process being killed by kernel OOM.No changes in gerrit.config were done between upgrades and this did not happen during the same tests before the upgrade.I used javamelody to take a thread dump around 90% of used memory and one the things I noticed similar(worker number is different) 34 entries like:"ForkJoinPool.commonPool-worker-101" daemon prio=5 WAITING
java...@11.0.15/jdk.internal.misc.Unsafe.park(Native Method)
java...@11.0.15/java.util.concurrent.locks.LockSupport.park(LockSupport.java:194)
java...@11.0.15/java.util.concurrent.ForkJoinPool.runWorker(ForkJoinPool.java:1628)
java...@11.0.15/java.util.concurrent.ForkJoinWorkerThread.run(ForkJoinWorkerThread.java:183)From this 34, only one of them is TIMED_WAITING.I can also see git-upload-pack being blocked(59) and some runnable(41).As some additional information, we were still using openjdk8 with 3.2.7 and now we had to upgrade to openjdk11.
I already tried disabling several plugins, tested with an upstream war file, using ssh or http clones but the outcome is the same. Gerrit process is always killed.Any suggestions on how to continue troubleshoot this?
Thanks,Nuno--
--
To unsubscribe, email repo-discuss...@googlegroups.com
More info at http://groups.google.com/group/repo-discuss?hl=en
---
You received this message because you are subscribed to the Google Groups "Repo and Gerrit Discussion" group.
To unsubscribe from this group and stop receiving emails from it, send an email to repo-discuss...@googlegroups.com.
To view this discussion on the web visit https://groups.google.com/d/msgid/repo-discuss/135aab2d-ad80-4115-a4c4-6eae4323070en%40googlegroups.com.

Luca Milanesio
On 22 Jun 2022, at 22:56, Nasser Grainawi <nasser....@linaro.org> wrote:On Wed, Jun 22, 2022 at 6:04 AM Nuno Costa <nunoco...@gmail.com> wrote:Hi All,During stress tests after upgrade from 3.2.7 to 3.4.4, we are seeing all available memory being used and gerrit process being killed by kernel OOM.
No changes in gerrit.config were done between upgrades and this did not happen during the same tests before the upgrade.
I used javamelody to take a thread dump around 90% of used memory and one the things I noticed similar(worker number is different) 34 entries like:"ForkJoinPool.commonPool-worker-101" daemon prio=5 WAITING
java...@11.0.15/jdk.internal.misc.Unsafe.park(Native Method)
java...@11.0.15/java.util.concurrent.locks.LockSupport.park(LockSupport.java:194)
java...@11.0.15/java.util.concurrent.ForkJoinPool.runWorker(ForkJoinPool.java:1628)
java...@11.0.15/java.util.concurrent.ForkJoinWorkerThread.run(ForkJoinWorkerThread.java:183)From this 34, only one of them is TIMED_WAITING.I can also see git-upload-pack being blocked(59) and some runnable(41).
As some additional information, we were still using openjdk8 with 3.2.7 and now we had to upgrade to openjdk11.Can you try them both with the same java version (either 8 or 11)?I already tried disabling several plugins, tested with an upstream war file, using ssh or http clones but the outcome is the same. Gerrit process is always killed.Any suggestions on how to continue troubleshoot this?
A heap dump run through Eclipse MAT *might* tell you/us more, but it's hard to say.Since you're doing only clones, I would scrutinize JGit changes between 3.2.7 and 3.4.4. I would start with running your test with 3.2.14 since there are JGit changes in that version that aren't in 3.2.7. Similarly, 3.4.5 and the not-yet-released 3.4.6 have more JGit changes [1][2] that could affect behavior in your test.[1] 330659: Bump jgit submodule to stable-5.13 | https://gerrit-review.googlesource.com/c/gerrit/+/330659[2] 339135: Update jgit to 5efd32e91 | https://gerrit-review.googlesource.com/c/gerrit/+/339135
Thanks,Nuno
--
--
To unsubscribe, email repo-discuss...@googlegroups.com
More info at http://groups.google.com/group/repo-discuss?hl=en
---
You received this message because you are subscribed to the Google Groups "Repo and Gerrit Discussion" group.
To unsubscribe from this group and stop receiving emails from it, send an email to repo-discuss...@googlegroups.com.
To view this discussion on the web visit https://groups.google.com/d/msgid/repo-discuss/135aab2d-ad80-4115-a4c4-6eae4323070en%40googlegroups.com.
--
--
To unsubscribe, email repo-discuss...@googlegroups.com
More info at http://groups.google.com/group/repo-discuss?hl=en
---
You received this message because you are subscribed to the Google Groups "Repo and Gerrit Discussion" group.
To unsubscribe from this group and stop receiving emails from it, send an email to repo-discuss...@googlegroups.com.
To view this discussion on the web visit https://groups.google.com/d/msgid/repo-discuss/CAF6pJ8Kp4_oW_QDAL6EJZfcMBZXiJwcUKLf2hx4%2BS2%3DW2hD1ZA%40mail.gmail.com.
Nuno Costa
Can you share the stress test code you are using?
No changes in gerrit.config were done between upgrades and this did not happen during the same tests before the upgrade.That’s interesting and could be possibly a regression.What I’d suggest to do is to bi-sect across versions to understand when that started to happen.E.g:Step-1: 3.2.7: move from Java 8 to Java 11, then run the stress testStep-2. 3.2.7 to 3.2.14: then run the stress testStep-3. 3.2.14 to 3.3.11: then run the stress testStep-4: 3.3.11 to 3.4.5: then run the stress test
I used javamelody to take a thread dump around 90% of used memory and one the things I noticed similar(worker number is different) 34 entries like:"ForkJoinPool.commonPool-worker-101" daemon prio=5 WAITING
java...@11.0.15/jdk.internal.misc.Unsafe.park(Native Method)
java...@11.0.15/java.util.concurrent.locks.LockSupport.park(LockSupport.java:194)
java...@11.0.15/java.util.concurrent.ForkJoinPool.runWorker(ForkJoinPool.java:1628)
java...@11.0.15/java.util.concurrent.ForkJoinWorkerThread.run(ForkJoinWorkerThread.java:183)From this 34, only one of them is TIMED_WAITING.I can also see git-upload-pack being blocked(59) and some runnable(41).Oh, that may explain the JVM heap overload: when Gerrit is serving a ‘git-upload-pack’ is basically preparing in memory the packfiles to be sent over the network.Every thread creates those in-memory packfiles: if you have 59 concurrent blocked threads, they are holding the refs to 59 copies of the same in-memory packfiles.The in-memory packfiles are the differences between what the client has already and he needs from Gerrit to be sent over the wire.
Luca Milanesio
On 23 Jun 2022, at 14:38, Nuno Costa <nunoco...@gmail.com> wrote:Hi Luca, Nasser,Thanks for your input.Can you share the stress test code you are using?It is nothing fancy, just a bash script running a git clone(without commit-msg) in a loop on 100 and keep the process running in the background (&) of a different instance, simulating a clone from a client.
I forgot to mention that the test repository have ~600MB. When I tested with a very small repo, the clones worked ok.
No changes in gerrit.config were done between upgrades and this did not happen during the same tests before the upgrade.That’s interesting and could be possibly a regression.What I’d suggest to do is to bi-sect across versions to understand when that started to happen.E.g:Step-1: 3.2.7: move from Java 8 to Java 11, then run the stress testStep-2. 3.2.7 to 3.2.14: then run the stress testStep-3. 3.2.14 to 3.3.11: then run the stress testStep-4: 3.3.11 to 3.4.5: then run the stress testThis is a good opportunity to test the "new" rollback process available.
Our previous rollback process from 3.x to 2.16.x was a bit "picky" when we created new changes after the upgrade. Starting gerrit in 2.16 always failed, even after reindexes.We had to restore reviewdb and in some way, remove the data regarding user and projects notedb. Usually we rsynced, with delete flag, the repos again.I know there is a script to revert the changes but we have some repos with a space in the name, which the script didn't handle (https://bugs.chromium.org/p/gerrit/issues/detail?id=13331)Does the existing rollback starting on 3.3 handles the newly created changes being available in 3.2?
I used javamelody to take a thread dump around 90% of used memory and one the things I noticed similar(worker number is different) 34 entries like:"ForkJoinPool.commonPool-worker-101" daemon prio=5 WAITING
java...@11.0.15/jdk.internal.misc.Unsafe.park(Native Method)
java...@11.0.15/java.util.concurrent.locks.LockSupport.park(LockSupport.java:194)
java...@11.0.15/java.util.concurrent.ForkJoinPool.runWorker(ForkJoinPool.java:1628)
java...@11.0.15/java.util.concurrent.ForkJoinWorkerThread.run(ForkJoinWorkerThread.java:183)From this 34, only one of them is TIMED_WAITING.I can also see git-upload-pack being blocked(59) and some runnable(41).Oh, that may explain the JVM heap overload: when Gerrit is serving a ‘git-upload-pack’ is basically preparing in memory the packfiles to be sent over the network.Every thread creates those in-memory packfiles: if you have 59 concurrent blocked threads, they are holding the refs to 59 copies of the same in-memory packfiles.The in-memory packfiles are the differences between what the client has already and he needs from Gerrit to be sent over the wire.We took another thread dump using jstack, at the same 90% memory usage point, and we did not see any git-upload-pack being blocked(they were all runnable), which I found strange, and the output content missing some data in JM one(SMR info andLocked ownable synchronizers output), when comparing the 2.Should javamelody thread dump output be different from jstack?Looking into the jstack TD, we saw that the class org.eclipse.jgit.internal.storage.pack.PackWriter.filterAndAddObject(PackWriter.java:2213) was blocking all the other threads.
Does this rings a bell to anyone?Thanks.
--
--
To unsubscribe, email repo-discuss...@googlegroups.com
More info at http://groups.google.com/group/repo-discuss?hl=en
---
You received this message because you are subscribed to the Google Groups "Repo and Gerrit Discussion" group.
To unsubscribe from this group and stop receiving emails from it, send an email to repo-discuss...@googlegroups.com.
To view this discussion on the web visit https://groups.google.com/d/msgid/repo-discuss/cb15d03d-4c4b-4bb7-922f-f2f3bacfbe51n%40googlegroups.com.
Nuno Costa
Are you running then 100 concurrent clones?
How your SSHD and HTTPD sections look like?
sshd.listenaddress=*:8282
sshd.maxconnectionsperuser=0
sshd.threads=144
sshd.batchthreads=40
sshd.streamthreads=40
sshd.idletimeout=10m
httpd.listenurl=proxy-https://127.0.0.1:8080/
httpd.maxthreads=150
httpd.requestlog=true
What protocol are you using? (Git/SSH vs. Git/HTTPS)
JGit had some shortcuts for sending the packfiles ‘as-is’ and without creating 100x times a 600MB pack file in memory.Do you use bitmaps?
What is this “new” rollback process?
Can you share the stack trace for that call?
Luca Milanesio
Answers inline.
Based on your stack trace, you’re preparing one individual different pack file per client, so for 600MB repo and 100 clients => you are looking to use *at least* 60GB but possibly more because the expanded blobs possibly take more space.
Can you share more details about the repos?
1) number of refs
2) number of objects
It looks like the ObjectIdOwnerMap is continuously growing during the addition of new objects.
> at org.eclipse.jgit.transport.UploadPack.sendPack(UploadPack.java:2286)
> at org.eclipse.jgit.transport.UploadPack.sendPack(UploadPack.java:2174)
> at org.eclipse.jgit.transport.UploadPack.fetchV2(UploadPack.java:1257)
> at org.eclipse.jgit.transport.UploadPack.serveOneCommandV2(UploadPack.java:1294)
> at org.eclipse.jgit.transport.UploadPack.serviceV2(UploadPack.java:1341)
Have you tried disabling Git protocol v2 and compare the results?
> --
> To unsubscribe, email repo-discuss...@googlegroups.com
> More info at http://groups.google.com/group/repo-discuss?hl=en
>
> ---
> You received this message because you are subscribed to the Google Groups "Repo and Gerrit Discussion" group.
> To unsubscribe from this group and stop receiving emails from it, send an email to repo-discuss...@googlegroups.com.

Martin Fick
> ^^^^^^^^^^^^^^^^^^^^^^^^^^^^^^^^^^^^^^^^^^^^^^^^^^^^^^^^^^^^^^^^^^^^^^=== You are preparing one pack per clone.
>
> Based on your stack trace, you’re preparing one individual different pack file per client, so for 600MB repo and 100 clients => you are looking to use *at least* 60GB but possibly more because the expanded blobs possibly take more space.
prepared per client, that does not mean that jgit is loading all the
objects into memory. Jgit will stream objects directly from disk if the
on disk format is acceptable. When the objects needs to be modified
(deltafied differently), it will only modify one object at a time in
memory, and then send it to the client before working on the next
object. In essence jgit attempts to work in a stream mode for object
data, and thus has a mostly fixed operational size for this data (it
will not grow with repo size).
What jgit cannot currently "stream", and thus what requires memory to
grow with repo size, or more specifically with object count, are the
list of objects (and some meta data about them) that need to be sent to
the client. These lists are entirely kept in memory, and are at least as
large as the full list of objects that the client should have (even if
it has most of them already I believe). Due to how memory inefficient
java is, this list will consume a ton of memory, but luckily it is NOT
the full size of the objects being sent, as that would be much bigger even.
-Martin
Nuno Costa
Can you share more details about the repos?
1) number of refs
2) number of objects
count: 8
size: 32.00 KiB
in-pack: 3058582
packs: 3
size-pack: 712.01 MiB
prune-packable: 0
garbage: 0
size-garbage: 0 bytes
> at org.eclipse.jgit.transport.UploadPack.sendPack(UploadPack.java:2286)
> at org.eclipse.jgit.transport.UploadPack.sendPack(UploadPack.java:2174)
> at org.eclipse.jgit.transport.UploadPack.fetchV2(UploadPack.java:1257)
> at org.eclipse.jgit.transport.UploadPack.serveOneCommandV2(UploadPack.java:1294)
> at org.eclipse.jgit.transport.UploadPack.serviceV2(UploadPack.java:1341)
^^^^^^^^^^^^^^^^^^^^^^^^^^^^^^^^^^^^^^^^^^^^^^^^^^^^^^=== You’re using Git protocol v2 here
Have you tried disabling Git protocol v2 and compare the results?
protocol.version=1

Matthias Sohn
Are you running then 100 concurrent clones?Yes, 100 concurrent clones.How your SSHD and HTTPD sections look like?$ git config -l -f /gerrit/gerrit/etc/gerrit.config | grep -i sshd
sshd.listenaddress=*:8282
sshd.maxconnectionsperuser=0
sshd.threads=144
OOM errors. In our experience parallel gc has highest throughput.
--
--
To unsubscribe, email repo-discuss...@googlegroups.com
More info at http://groups.google.com/group/repo-discuss?hl=en
---
You received this message because you are subscribed to the Google Groups "Repo and Gerrit Discussion" group.
To unsubscribe from this group and stop receiving emails from it, send an email to repo-discuss...@googlegroups.com.
To view this discussion on the web visit https://groups.google.com/d/msgid/repo-discuss/65ab53ad-9c6f-4eb3-97ea-00f0285cbda7n%40googlegroups.com.
Nasser Grainawi
On Thu, Jun 23, 2022 at 5:50 PM Nuno Costa <nunoco...@gmail.com> wrote:Are you running then 100 concurrent clones?Yes, 100 concurrent clones.How your SSHD and HTTPD sections look like?$ git config -l -f /gerrit/gerrit/etc/gerrit.config | grep -i sshd
sshd.listenaddress=*:8282
sshd.maxconnectionsperuser=0
sshd.threads=144This means up to 144 git requests can be processed in parallel (including those over http).Depending on how much memory and how many CPUs your server has, this might be too much.
To view this discussion on the web visit https://groups.google.com/d/msgid/repo-discuss/CAKSZd3TCDQy_6iVCos5KQgum33Ht1H2%2Bp7Ehye9VfGaunUJ9oA%40mail.gmail.com.
Luca Milanesio
On 23 Jun 2022, at 19:29, Nasser Grainawi <nasser....@linaro.org> wrote:On Thu, Jun 23, 2022 at 12:24 PM Matthias Sohn <matthi...@gmail.com> wrote:On Thu, Jun 23, 2022 at 5:50 PM Nuno Costa <nunoco...@gmail.com> wrote:Are you running then 100 concurrent clones?Yes, 100 concurrent clones.How your SSHD and HTTPD sections look like?$ git config -l -f /gerrit/gerrit/etc/gerrit.config | grep -i sshd
sshd.listenaddress=*:8282
sshd.maxconnectionsperuser=0
sshd.threads=144This means up to 144 git requests can be processed in parallel (including those over http).Depending on how much memory and how many CPUs your server has, this might be too much.This is true, but the whole premise here is that this succeeds with 3.2.7. So it seems the threshold of "too much" has changed.
A fetch request for a large repo can keep one core busy if there is no throttling e.g. by limited network bandwidth.Running many large fetch requests concurrently can overwhelm the java gc which may also lead to
OOM errors. In our experience parallel gc has highest throughput.
sshd.batchthreads=40
sshd.streamthreads=40
sshd.idletimeout=10m$ git config -l -f /gerrit/gerrit/etc/gerrit.config | grep -i httpd
httpd.listenurl=proxy-https://127.0.0.1:8080/
httpd.maxthreads=150
httpd.requestlog=trueWhat protocol are you using? (Git/SSH vs. Git/HTTPS)Tried both.Both triggering OOM.
JGit had some shortcuts for sending the packfiles ‘as-is’ and without creating 100x times a 600MB pack file in memory.Do you use bitmaps?According to the todays gc_log, yes, we are.pack config: maxDeltaDepth=50, deltaSearchWindowSize=10, deltaSearchMemoryLimit=0, deltaCacheSize=52428800, deltaCacheLimit=100, compressionLevel=-1, indexVersion=2, bigFileThreshold=52428800, threads=0, reuseDeltas=true, reuseObjects=true, deltaCompress=true, buildBitmaps=true, bitmapContiguousCommitCount=100, bitmapRecentCommitCount=20000, bitmapRecentCommitSpan=100, bitmapDistantCommitSpan=5000, bitmapExcessiveBranchCount=100, bitmapInactiveBranchAge=90, singlePack=falseWhat is this “new” rollback process?I meant to say downgrade, my bad.Can you share the stack trace for that call?Example from jstack thread dump, 59 upload-pack POST out of 100 have that class. All 100 with java.lang.Thread.State: RUNNABLE"HTTP POST /REDACTED/REPO/git-upload-pack (REDACTED_USER from REDACTED_IP)" #74 prio=5 os_prio=0 cpu=20378.92ms elapsed=379.65s tid=0x00007f9e1570b000 nid=0x284a runnable [0x00007f8650f24000]java.lang.Thread.State: RUNNABLEat org.eclipse.jgit.lib.ObjectIdOwnerMap.newSegment(ObjectIdOwnerMap.java:308)
at org.eclipse.jgit.lib.ObjectIdOwnerMap.grow(ObjectIdOwnerMap.java:279)at org.eclipse.jgit.lib.ObjectIdOwnerMap.add(ObjectIdOwnerMap.java:138)at org.eclipse.jgit.internal.storage.pack.PackWriter.addObject(PackWriter.java:2157)at org.eclipse.jgit.internal.storage.pack.PackWriter.filterAndAddObject(PackWriter.java:2213)at org.eclipse.jgit.internal.storage.pack.PackWriter.findObjectsToPack(PackWriter.java:2066)at org.eclipse.jgit.internal.storage.pack.PackWriter.preparePack(PackWriter.java:960)at org.eclipse.jgit.transport.UploadPack.sendPack(UploadPack.java:2286)at org.eclipse.jgit.transport.UploadPack.sendPack(UploadPack.java:2174)at org.eclipse.jgit.transport.UploadPack.fetchV2(UploadPack.java:1257)There is not much of a difference between protocol v1 and v2 when cloning a complete repository.
To view this discussion on the web visit https://groups.google.com/d/msgid/repo-discuss/CAF6pJ8%2B849nbx4JuVoYnM9uCyPD%3D2psMbtQbDYy4e4FyhD8qsA%40mail.gmail.com.
Martin Fick
Thanks everyone for the interesting discussion :-) see below my feedback.
On 23 Jun 2022, at 19:29, Nasser Grainawi <nasser....@linaro.org> wrote:
On Thu, Jun 23, 2022 at 12:24 PM Matthias Sohn <matthi...@gmail.com> wrote:
On Thu, Jun 23, 2022 at 5:50 PM Nuno Costa <nunoco...@gmail.com> wrote:
Are you running then 100 concurrent clones?Yes, 100 concurrent clones.
...
This means up to 144 git requests can be processed in parallel (including those over http).Depending on how much memory and how many CPUs your server has, this might be too much.
This is true, but the whole premise here is that this succeeds with 3.2.7. So it seems the threshold of "too much" has changed.
Agreed, @Nuno thanks for raising this up: I am keen to help getting to the bottom of it.Did you manage to understand in which version you started seeing this change in memory utilisation?
I agree that this would be great to get to the bottom of? I am
not sure we have ruled out this being a java version issue instead
of a Gerrit one? I thought Mathias had figured out something about
the way java compresses things with gzip was different in
different in newer versions of java? Could this be related?
A fetch request for a large repo can keep one core busy if there is no throttling e.g. by limited network bandwidth.Running many large fetch requests concurrently can overwhelm the java gc which may also lead to
OOM errors. In our experience parallel gc has highest throughput.
From the code I see that the PackWriter receives an in-memory list of all objects (Java Objects, not just the SHA1s).Yes, they do not have all the BLOB data but just the pointer to the pack file where it is contained.
Sounds right. I would love to figure out a way to make this a "streamed" based algorithm, but I haven't been able to yet. We could potentially make use of temp files to reduce the memory impact, but that feels a bit ugly (but may be worth it). I suspect that having on disk topological indexes of the objects might allow us to figure out which objects to send in a streaming manner instead of having to store them all in memory at once. I guess if there are stream based algorithms to create the topo indexes, then maybe they need not be on disk?
From my understanding, the problem is one of computing what the
caller needs, i.e the set difference between all the objects
needed, and the objects the caller already has. So if we can do
with an algorithm that computes one (or a group of) needed
object(s) at a time, and then sends them, and forgets about them
before computing more, than we would be able to scale infinitely.
Anyone know how to do this?
However, if the number of object is huge, and their BLOB data is relatively small, then the in-memory Java Objects can use a lot more space than the packfile.
This might be true, java is a memory hog for sure.
You have 3M of objects and a total size of 700MB in packfiles, which means that each object has on average a 244 bytes isn’t it?
Something like that. 244bytes is not very much, so these objects are actually likely very highly compressed and deltafied.
So, the full list of objects in memory will be *way over* 700MB per incoming clone thread.
Right, because it is not difficult to imagine that the data in
java just to point to a git object and its location in a packfile
to be longer than those 244bytes
P.S. From what I see in the code, the list of objects is all allocated in memory and isn’t shared between threads or streamed. @Martin did I miss anything in my analysis?
Seems correct, and there is no good way that I can imagine to
share this across threads.
The ObjectIdOwnerMap starts by default with 1024 elements and, as the upload pack progresses, grows up to 3M objects.Having a pre-allocated map of 3M objects would use *a lot less memory* than having one of 1024 and growing it.
Perhaps, although I suspect diminishing returns here.
I see there are lots of optimisations that could be possible.
I do think this is the hardest scalability issue in jgit, and it
is one that will continue to grow as many git repos are now well
beyond 10years old.
But, again, I’m curious to understand why before in v3.2 was so optimised and in v3.4 it isn’t anymore.
Agreed!
-Martin
Nuno Costa
Did you manage to understand in which version you started seeing this change in memory utilisation?
@Nuno can you get an list of objects dump when you have all the 100 threads busy in the clone? We could see how many in-memory objects to pack you have at that time. I guess is going to be close to 3M * 100 = 300M of objects.
There is not much of a difference between protocol v1 and v2 when cloning a complete repository.Thanks for confirming.
Luca Milanesio
On 24 Jun 2022, at 10:33, Nuno Costa <nunoco...@gmail.com> wrote:Thanks everyone for you feedback on this.Did you manage to understand in which version you started seeing this change in memory utilisation?@Luca, since this is the only instance I have available with capacity to replicate the issue, I didn't downgrade versions yet but according to every feedback in the thread, it seems that needs to be done.
Before doing that I will disable all non core plugins at the same time and retest. I did disable most of the plugins but only one at each time.We do not have any of the additional plugins built to 3.3.If anyone want any additional information from 3.4.4, let me know.@Nuno can you get an list of objects dump when you have all the 100 threads busy in the clone? We could see how many in-memory objects to pack you have at that time. I guess is going to be close to 3M * 100 = 300M of objects.@Luca, is this something I can take from existing thread dumps?If not, can you provide some guidance how to get it?
If it is useful, I can share the full thread dump. I just need to clean it a bit.There is not much of a difference between protocol v1 and v2 when cloning a complete repository.Thanks for confirming.I will revert jgit config to use git v2.
--
--
To unsubscribe, email repo-discuss...@googlegroups.com
More info at http://groups.google.com/group/repo-discuss?hl=en
---
You received this message because you are subscribed to the Google Groups "Repo and Gerrit Discussion" group.
To unsubscribe from this group and stop receiving emails from it, send an email to repo-discuss...@googlegroups.com.
To view this discussion on the web visit https://groups.google.com/d/msgid/repo-discuss/2df5f0d4-3c6a-470c-af24-df7e0169cb6dn%40googlegroups.com.
Nuno Costa
Is this a staging environment? If yes, it should be easy to go back to v3.2 and re-test with one upgrade step at the time.
You could use JVisualVM [1] for that, so that you can see also the individual threads, how much memory they take and what is the breakdown of that memory per object class.
Nuno Costa
Nuno Costa
When running reindex for changes only, as mentioned in the error log, several errors/warnings were seen.Since reindex output was returning lots of errors and warnings, I rerun reindex for all indexes and errors/warnings are similar.
Matthias Sohn
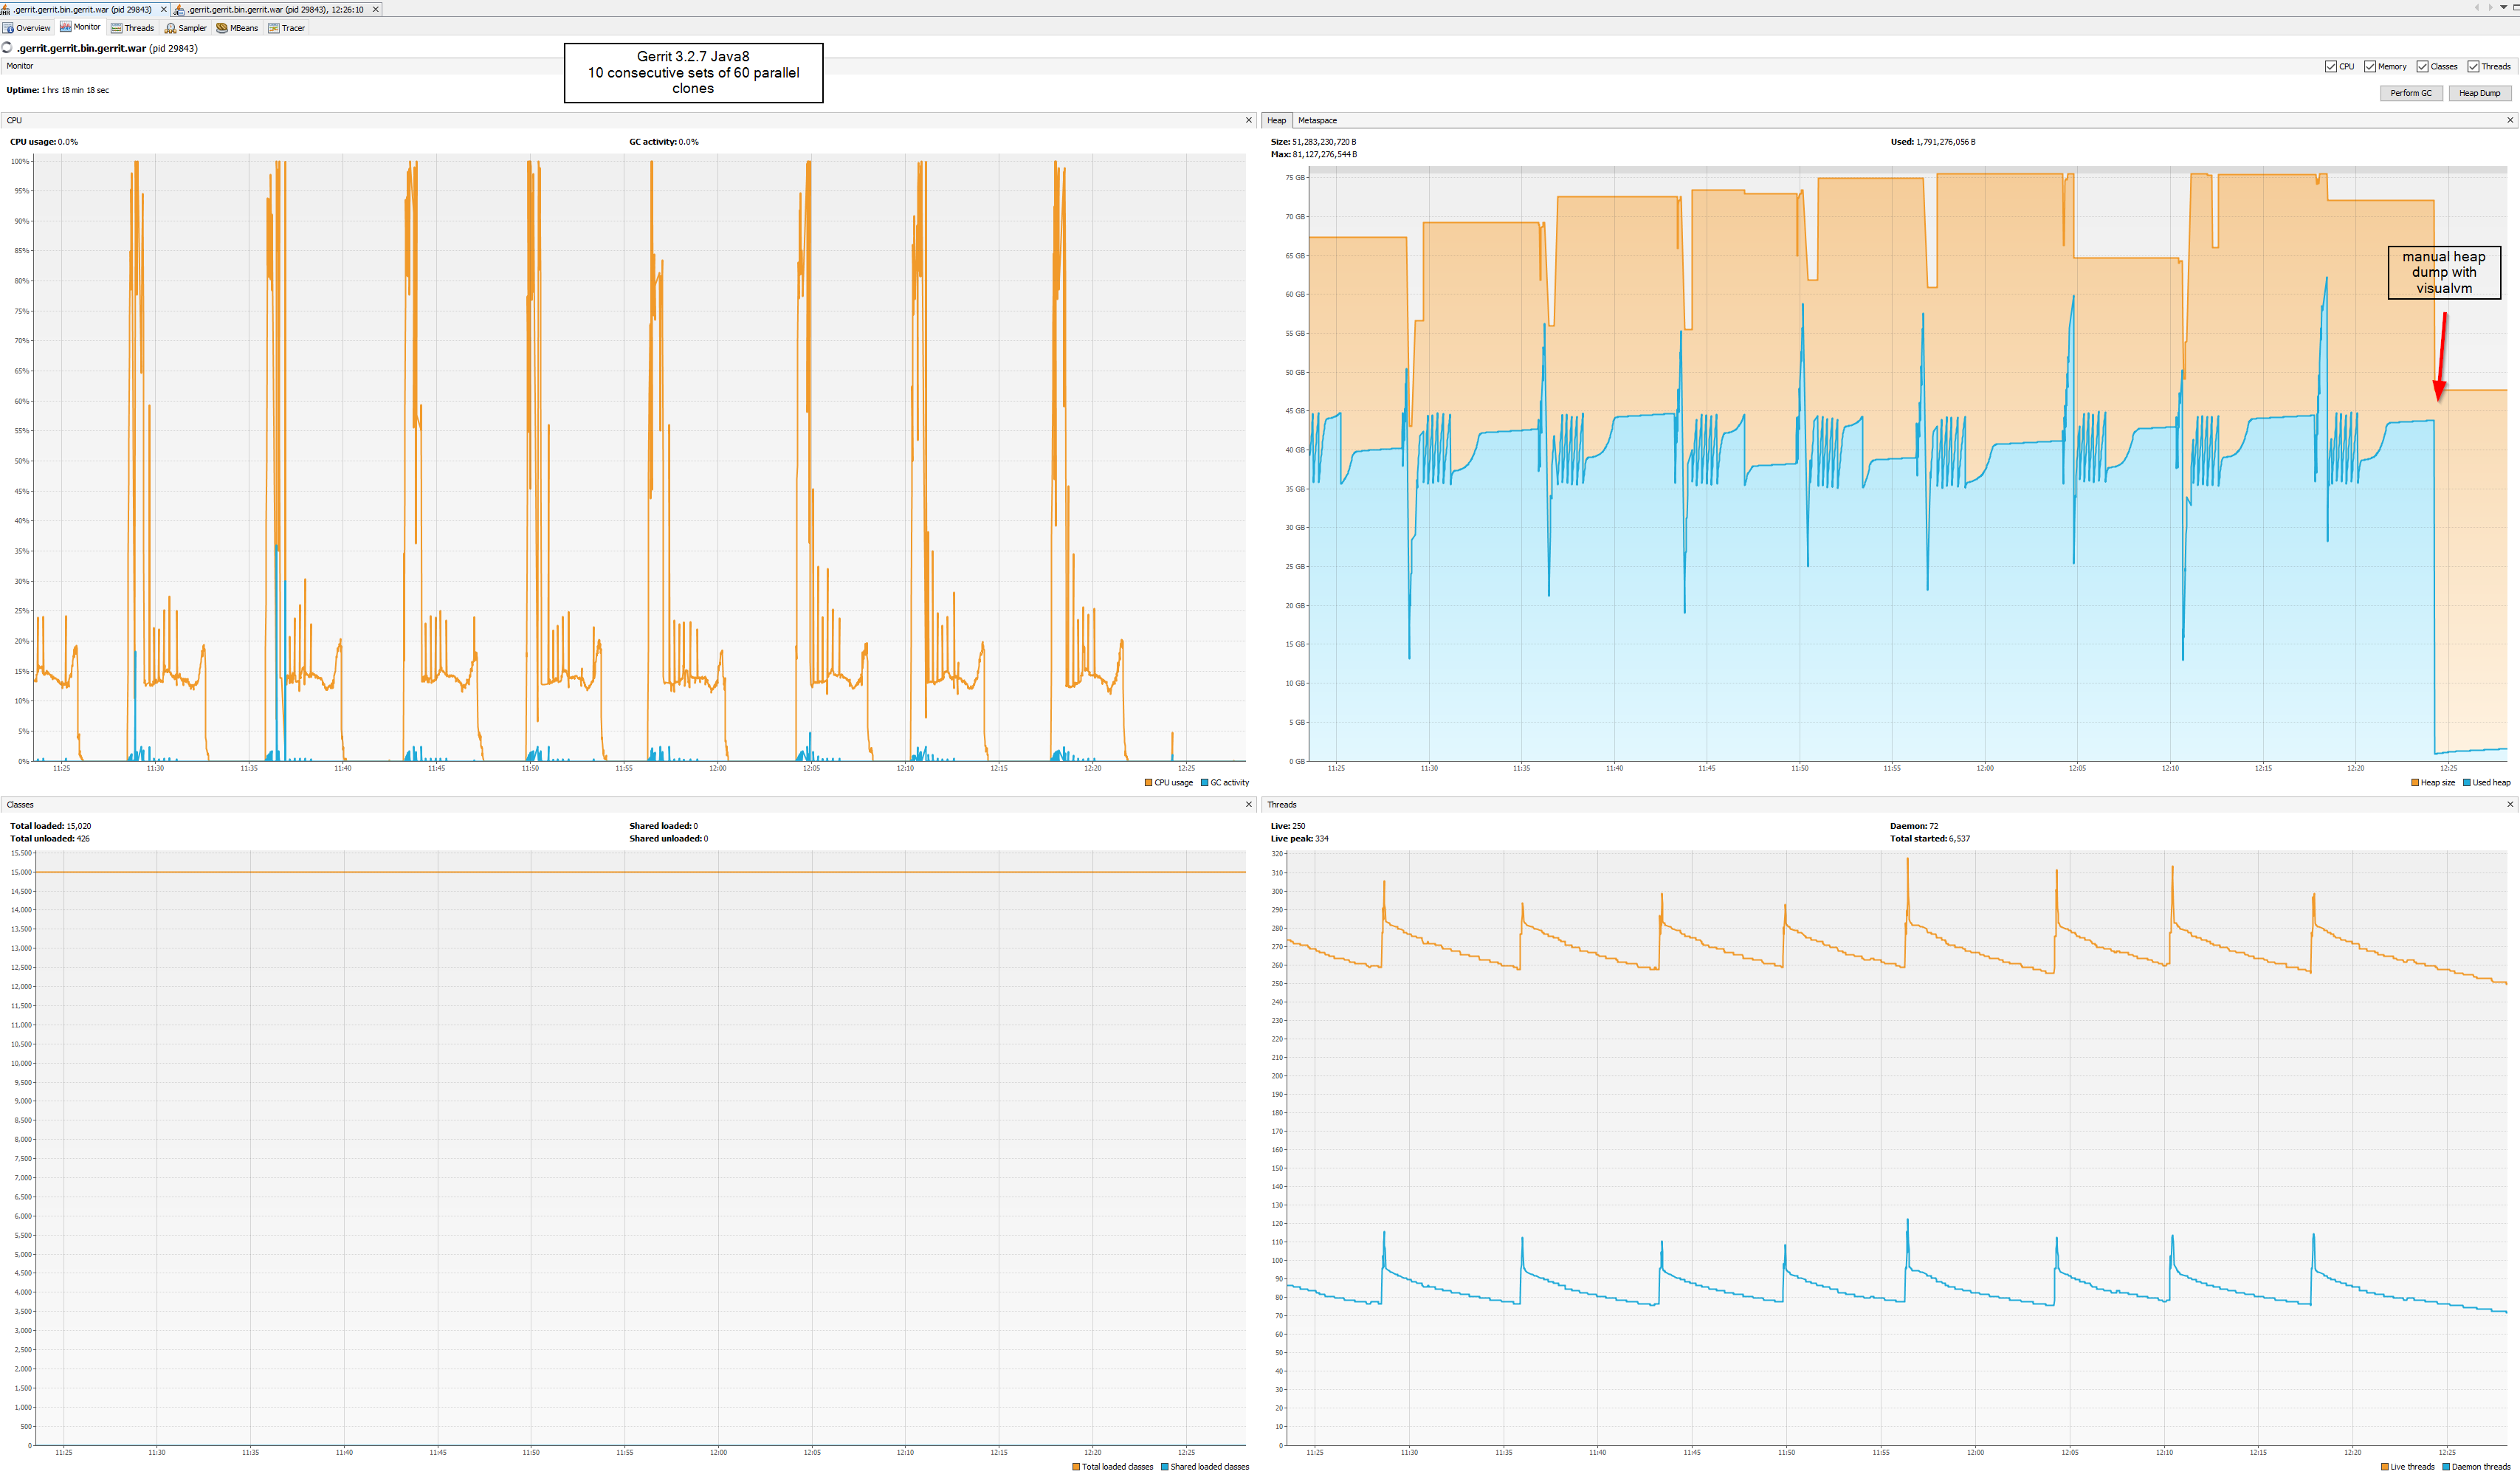
So, some disclaimer and updates...I was made aware that the parallel clone stress test should be 60 and not 100 since it was already established that 100 could not be handled correctly for some of the biggest repos.I knew that some of the tests could not be run with 100 parallel operations but I had the impression it was 60 for push operations and not clones. By bad regarding on this part.From this point, I will run 60 parallel clones on future tests.The server can successfully of running one(1) set on 60 parallel clones, making use of ~60-70GB memory and this amount of memory is not freed nor make available when the parallel clone set finishes.$ sudo free -htotal used free shared buff/cache availableMem: 94G 59G 32G 9.0M 2.0G 33GSwap: 0B 0B 0B
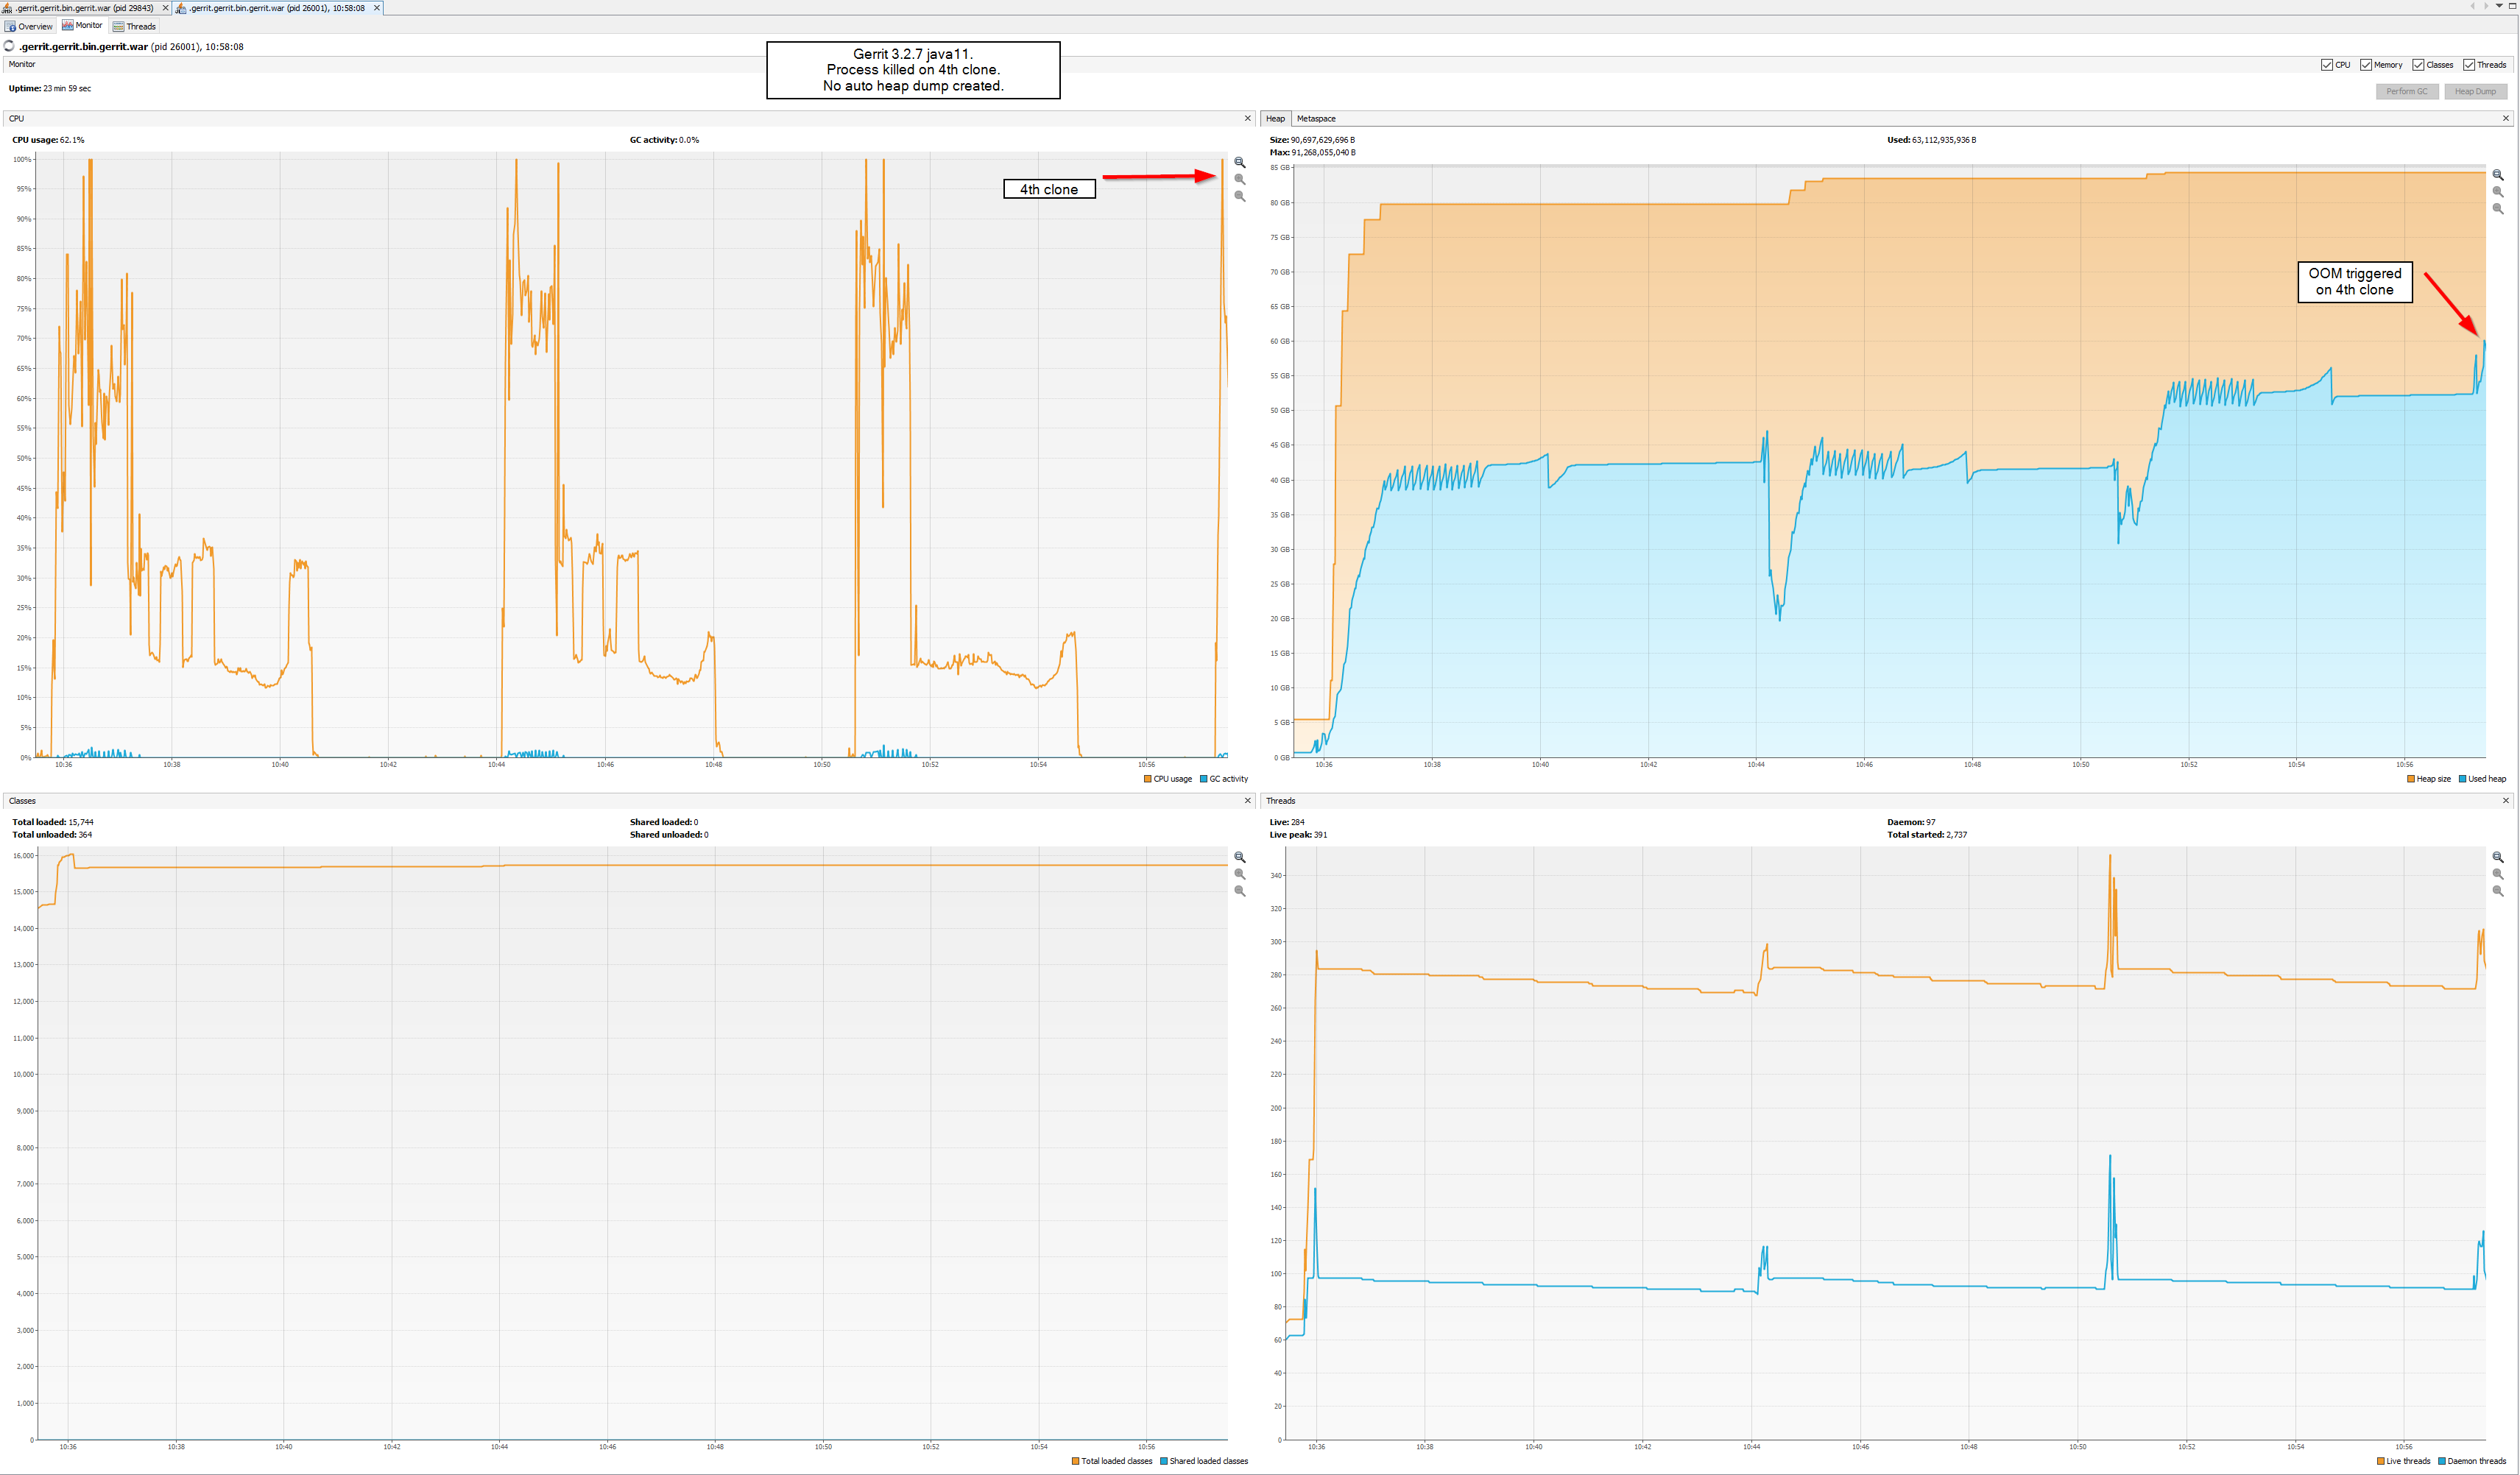
when I run additional 2-3 sets of the parallel clone test, the entire memory will be used and OOM is triggered.
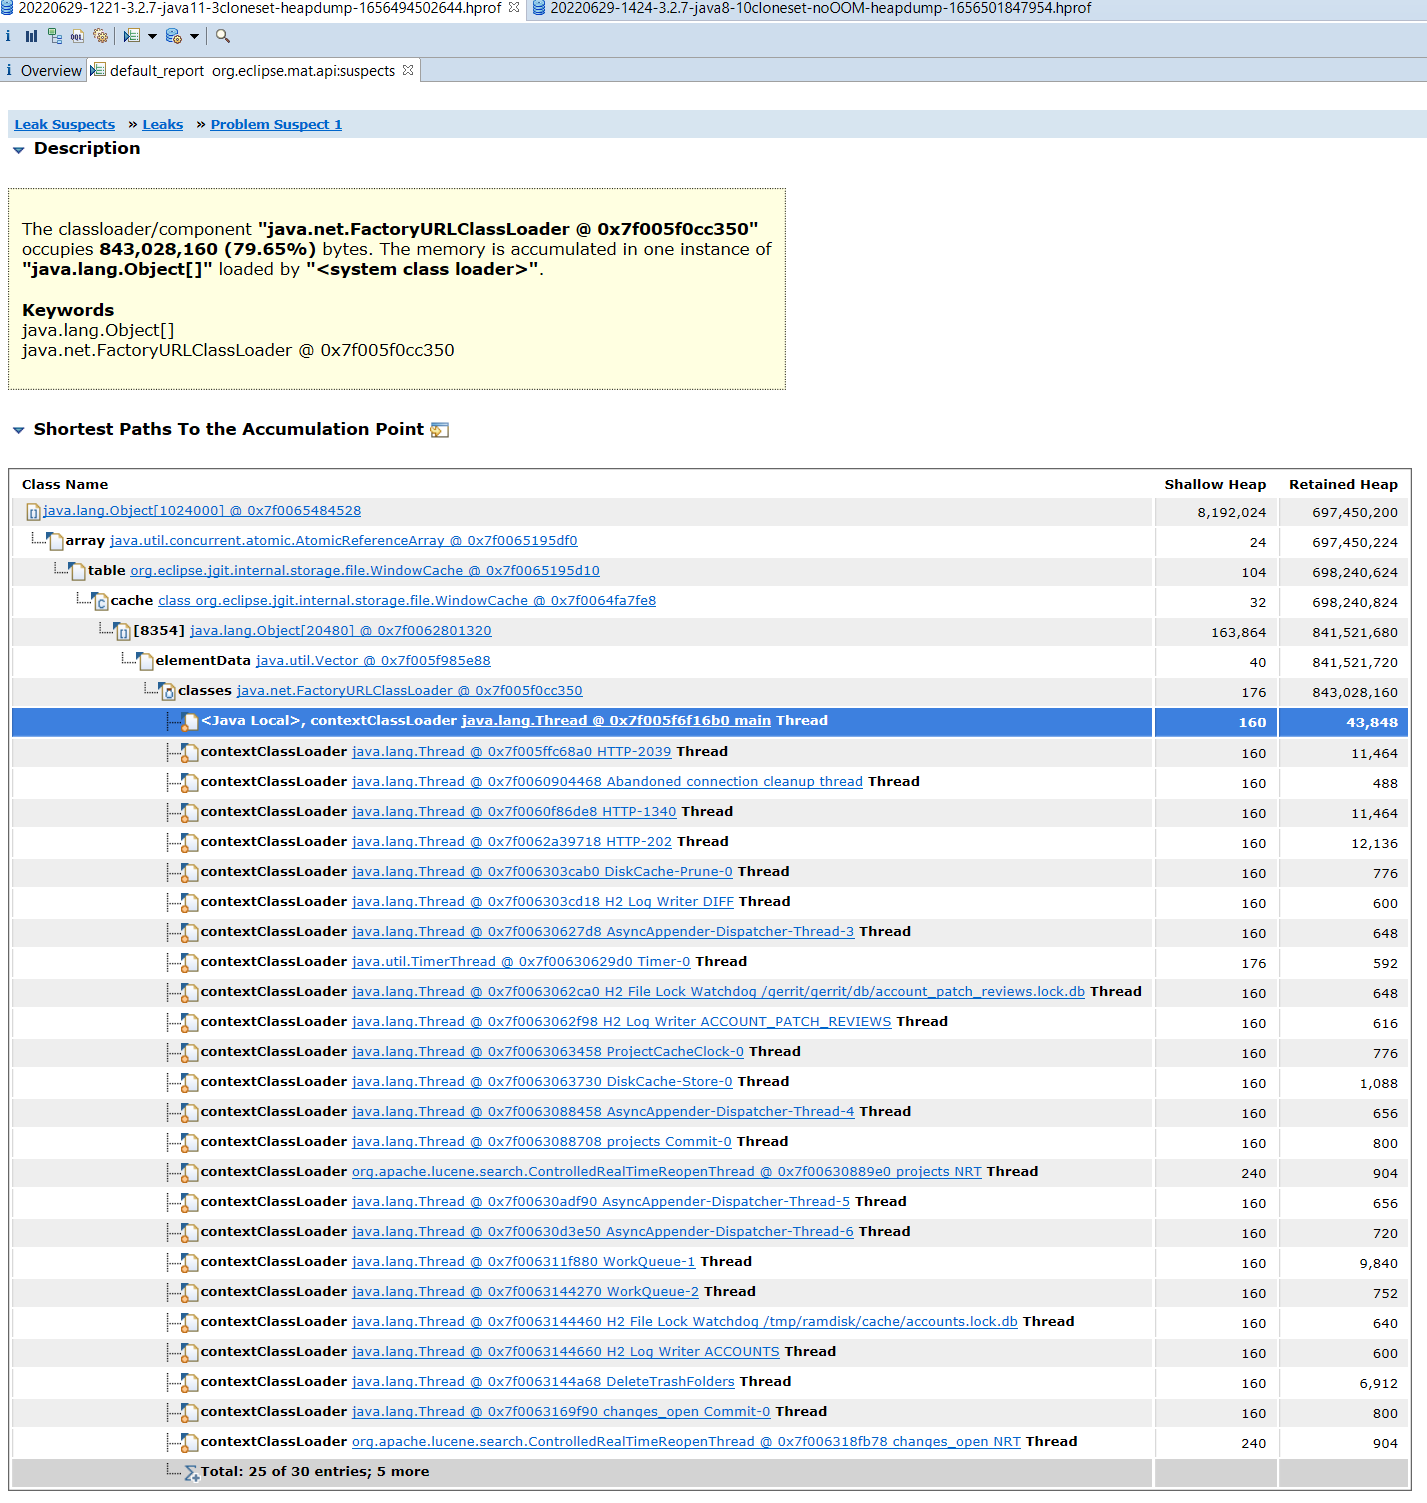
Ensure that there is enough disk space to store the heap dump. Then analyse it with Eclipse MAT [2].
--
--
To unsubscribe, email repo-discuss...@googlegroups.com
More info at http://groups.google.com/group/repo-discuss?hl=en
---
You received this message because you are subscribed to the Google Groups "Repo and Gerrit Discussion" group.
To unsubscribe from this group and stop receiving emails from it, send an email to repo-discuss...@googlegroups.com.
To view this discussion on the web visit https://groups.google.com/d/msgid/repo-discuss/1f7b78d7-6593-4d95-a424-a9af2ef48fean%40googlegroups.com.
Nuno Costa
Can you also monitor the JVM's memory metrics during these tests ?They are exposed by Gerrit as well. Interesting are used heap vs. committed heapand percentage of time spent in garbage collection. The gerrit-monitoring project [1] providesa dashboard "Gerrit - Process" providing graphs for these metrics.
Which JVM version and Java garbage collector configuration are you using ?
java-11-openjdk-headless-11.0.15.0.9-2.el7_9.x86_64
java-11-openjdk-11.0.15.0.9-2.el7_9.x86_64
java-11-openjdk-devel-11.0.15.0.9-2.el7_9.x86_64
java-1.8.0-openjdk-headless-1.8.0.332.b09-1.el7_9.x86_64
java-1.8.0-openjdk-1.8.0.332.b09-1.el7_9.x86_64
Can you provide the stack trace for this OOM ?If this is reproducible can you set the JVM option -XX:+HeapDumpOnOutOfMemoryError and reproduce the OOM ?
Ensure that there is enough disk space to store the heap dump. Then analyse it with Eclipse MAT [2].
Nuno Costa
Hi Matthias, thanks for tips.Can you also monitor the JVM's memory metrics during these tests ?They are exposed by Gerrit as well. Interesting are used heap vs. committed heapand percentage of time spent in garbage collection. The gerrit-monitoring project [1] providesa dashboard "Gerrit - Process" providing graphs for these metrics.Sure, I will check them with VisualVM now that I was able to fix the connection to JMX and after I upgrade again to 3.4.4.
Which JVM version and Java garbage collector configuration are you using ?$ rpm -qa *openjdk*
java-11-openjdk-headless-11.0.15.0.9-2.el7_9.x86_64
java-11-openjdk-11.0.15.0.9-2.el7_9.x86_64
java-11-openjdk-devel-11.0.15.0.9-2.el7_9.x86_64
java-1.8.0-openjdk-headless-1.8.0.332.b09-1.el7_9.x86_64
java-1.8.0-openjdk-1.8.0.332.b09-1.el7_9.x86_64There is no custom GC settings ATM but we will need to test with G1GC.Can you provide the stack trace for this OOM ?If this is reproducible can you set the JVM option -XX:+HeapDumpOnOutOfMemoryError and reproduce the OOM ?
Ensure that there is enough disk space to store the heap dump. Then analyse it with Eclipse MAT [2].I will set up the heapdump now but I'm on 3.3 ATM and preparing downgrade to 3.2, to make sure the clone tests are consistent.
container.user=gerrit
container.javahome=/usr/lib/jvm/java-1.8.0-openjdk-1.8.0.332.b09-1.el7_9.x86_64/jre
container.heaplimit=85g
container.javaoptions=-Djavamelody.system-actions-enabled=false
container.javaoptions=-Dflogger.backend_factory=com.google.common.flogger.backend.log4j.Log4jBackendFactory#getInstance
container.javaoptions=-Dflogger.logging_context=com.google.gerrit.server.logging.LoggingContext#getInstance
container.javaoptions=-Dcom.sun.management.jmxremote
container.javaoptions=-Dcom.sun.management.jmxremote.port=9000
container.javaoptions=-Dcom.sun.management.jmxremote.rmi.port=9001
container.javaoptions=-Dcom.sun.management.jmxremote.ssl=false
container.javaoptions=-Dcom.sun.management.jmxremote.password.file=/gerrit/jmxremote.password
container.javaoptions=-Djava.rmi.server.hostname=REDACTED_HOSTNAME
container.javaoptions=-XX:+HeapDumpOnOutOfMemoryError
container.javaoptions=-XX:HeapDumpPath=/gerrit/heapdump/
container.javaoptions=-XX:ErrorFile=/gerrit/heapdump/java_error_%p.log
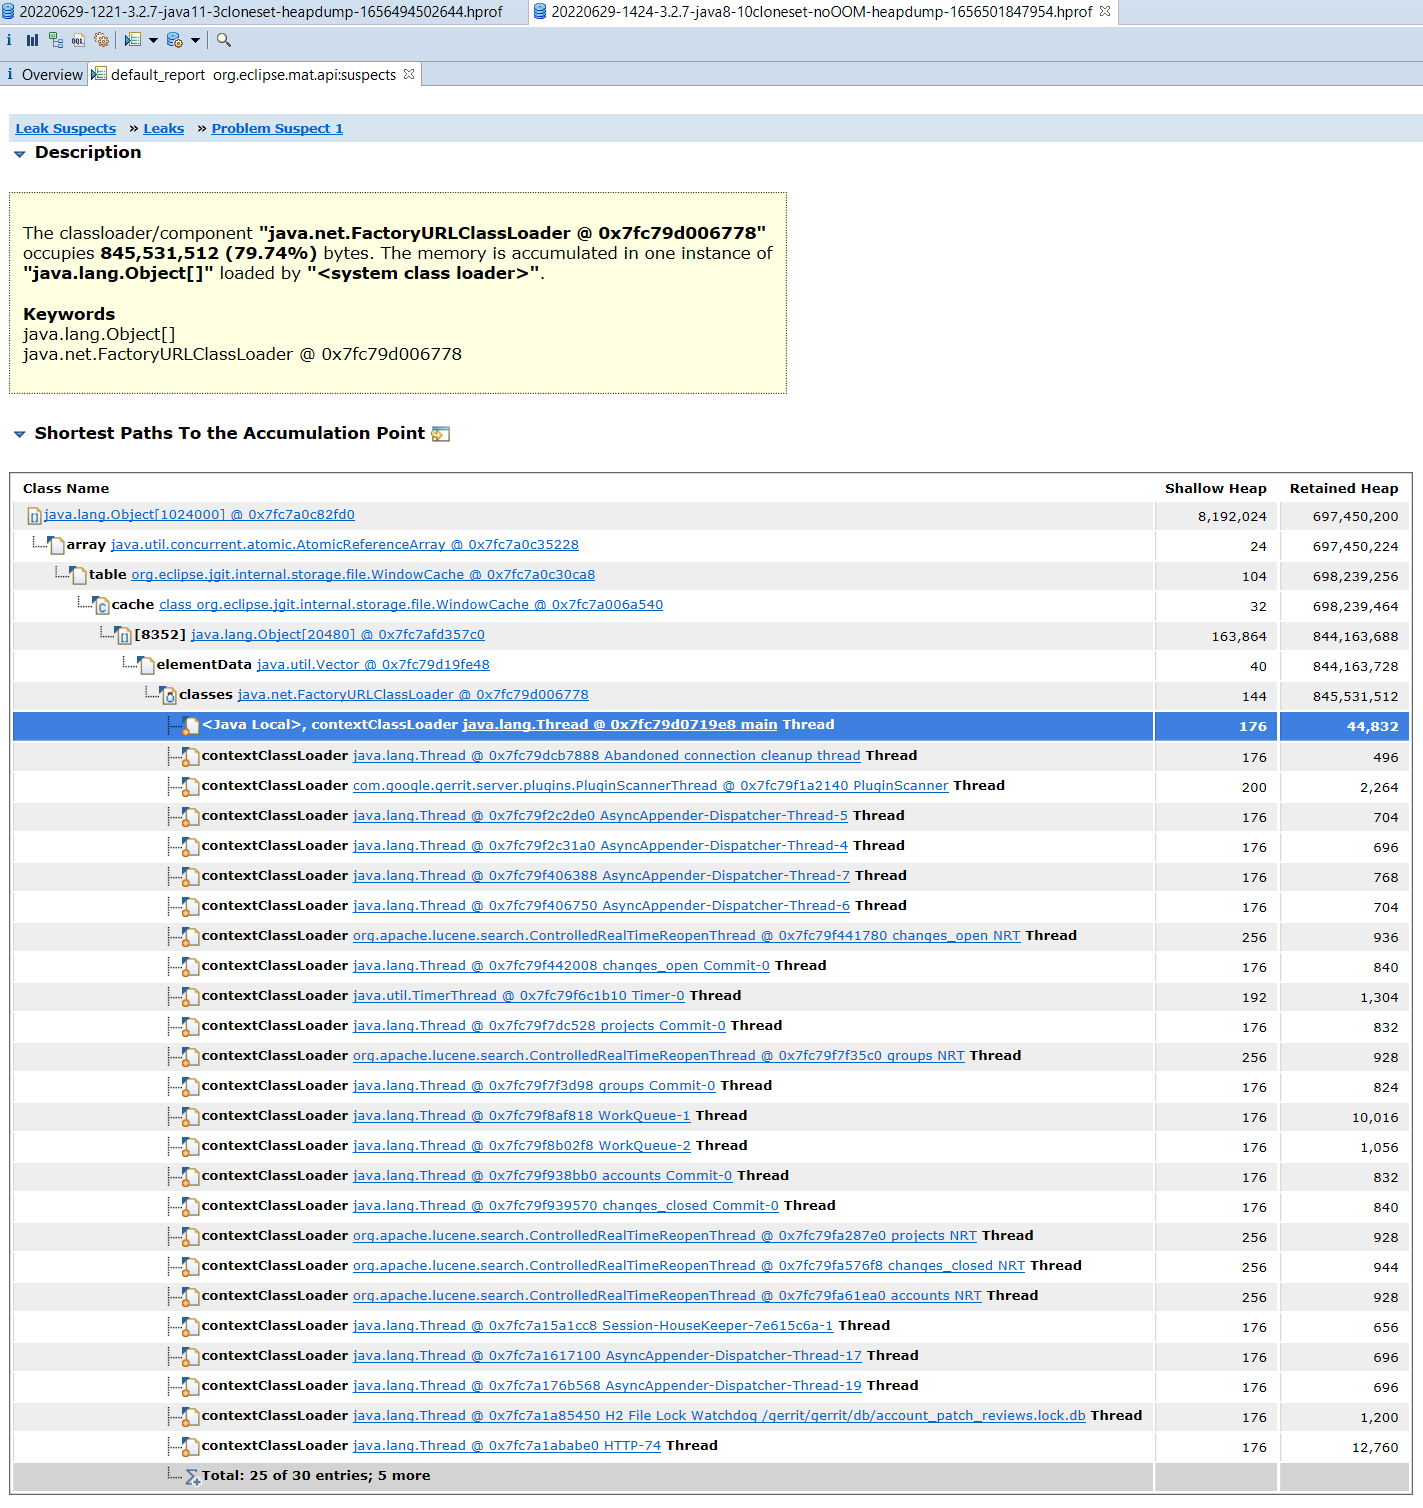
The classloader/component "java.net.FactoryURLClassLoader @ 0x7f005f0cc350" occupies 843,028,160 (79.65%) bytes. The memory is accumulated in one instance of "java.lang.Object[]" loaded by "<system class loader>".
Keywords
java.lang.Object[]
java.net.FactoryURLClassLoader @ 0x7f005f0cc350
Matthias Sohn
the used heap comes close to max heap size the JVM drops all SoftLinks which completely flushes this cache.
javaoptions = -Xmx85g
which slows down startup a bit but afterwards heap access is faster)
Luca Milanesio
-Matthias
--
--
To unsubscribe, email repo-discuss...@googlegroups.com
More info at http://groups.google.com/group/repo-discuss?hl=en
---
You received this message because you are subscribed to the Google Groups "Repo and Gerrit Discussion" group.
To unsubscribe from this group and stop receiving emails from it, send an email to repo-discuss...@googlegroups.com.
To view this discussion on the web visit https://groups.google.com/d/msgid/repo-discuss/CAKSZd3R81bR%2BLS3z3NjmMS4HByaU2HhX%3DTuh%3DZ9cBr1BJLEUFg%40mail.gmail.com.
Matthias Sohn

David Ostrovsky
Matthias Sohn
With this setting the cache uses strong references so that the JVM can't flush it.The option core.packedgitlimit sets the size of this cache.Ideally all hot packfiles fit inside. This can prevent file IO.You can't set it higher than 1/4 of the maximum heap size.Apparently on Java 8 the gc tried to reduce committed heap size to a value smaller than max heap size.This means the application doesn't fully use the memory you wanted to give it.To prevent this set these optionsjavaoptions = -Xms85g (directly start with the max heap size)
javaoptions = -Xmx85gjavaoptions = -XX:-UseAdaptiveSizePolicy (this prevents that gc tries to reduce committed heap size)we also usejavaoptions = -XX:+AlwaysPreTouch (with that the JVM allocates all memory needed for the heap at startup time,
which slows down startup a bit but afterwards heap access is faster)for maximum throughput use parallel GC, it has higher throughput, but longer stop the world pauses than g1gcjavaoptions = -XX:+UseParallelGC-Matthias
--
--
To unsubscribe, email repo-discuss...@googlegroups.com
More info at http://groups.google.com/group/repo-discuss?hl=en
---
You received this message because you are subscribed to the Google Groups "Repo and Gerrit Discussion" group.
To unsubscribe from this group and stop receiving emails from it, send an email to repo-discuss...@googlegroups.com.
To view this discussion on the web visit https://groups.google.com/d/msgid/repo-discuss/d7e9bc18-640d-419b-8575-24693cac6472n%40googlegroups.com.
Nuno Costa
Which exact OutOfMemoryError including the error message did you get ?
I guess you are using the default implementation using SoftLinks. This has the effect that under high load when
the used heap comes close to max heap size the JVM drops all SoftLinks which completely flushes this cache.And then JGit has to reload the same data again from disk. If you want to observe this you need to enable gc logging.Set core.packedgitusestrongrefs = true to prevent this.With this setting the cache uses strong references so that the JVM can't flush it.The option core.packedgitlimit sets the size of this cache.Ideally all hot packfiles fit inside. This can prevent file IO.You can't set it higher than 1/4 of the maximum heap size.
core.packedgitopenfiles=32768
core.packedgitlimit=25g
core.packedgitwindowsize=64k
core.packedgitusestrongrefs=true
Apparently on Java 8 the gc tried to reduce committed heap size to a value smaller than max heap size.This means the application doesn't fully use the memory you wanted to give it.To prevent this set these optionsjavaoptions = -Xms85g (directly start with the max heap size)
javaoptions = -Xmx85gjavaoptions = -XX:-UseAdaptiveSizePolicy (this prevents that gc tries to reduce committed heap size)we also usejavaoptions = -XX:+AlwaysPreTouch (with that the JVM allocates all memory needed for the heap at startup time,
which slows down startup a bit but afterwards heap access is faster)
for maximum throughput use parallel GC, it has higher throughput, but longer stop the world pauses than g1gcjavaoptions = -XX:+UseParallelGC
Unfortunately I did not noticed that this test instance was missing G1GC from the beginning of the tests so I continued them without G1GC(or so I thought) but we need to go forward with G1GC test as well.
This caught my attention:
G1GC was indeed enabled as shown in Global Flags section:
Matthias Sohn
Which exact OutOfMemoryError including the error message did you get ?When OOM is triggered, there is no error shown in Gerrit error_log file.I suspect that since gerrit process is killed by OOM, it can't write to file.Should be looking for the error in some other place?
https://docs.oracle.com/javase/8/docs/technotes/guides/troubleshoot/memleaks002.html
I guess you are using the default implementation using SoftLinks. This has the effect that under high load when
the used heap comes close to max heap size the JVM drops all SoftLinks which completely flushes this cache.And then JGit has to reload the same data again from disk. If you want to observe this you need to enable gc logging.Set core.packedgitusestrongrefs = true to prevent this.With this setting the cache uses strong references so that the JVM can't flush it.The option core.packedgitlimit sets the size of this cache.Ideally all hot packfiles fit inside. This can prevent file IO.You can't set it higher than 1/4 of the maximum heap size.We are already using packedgitusesstrongrefs$ git config -f /gerrit/gerrit/etc/gerrit.config -l | grep -i core.
core.packedgitopenfiles=32768
core.packedgitlimit=25g
core.packedgitwindowsize=64k
core.packedgitusestrongrefs=truecore.packedgitlimit is a bit higher than the 1/4 of heaplimit(container.heaplimit=85g) you mentioned.This does not seems to affect when using java8.
So, without knowing, I "migrated" to G1GC when using java11.
Looking into G1GC documentation[3], it is suggested to keep its default values and set xmx and optionally xms flags.xmx is already set by container.heaplimit=85g so I tried with container.javaoptions=-Xms85gWith xms set, I was able to successfully run 10 sets of 60 parallel clones on 3.2.7/java11.Something also caught my attention. In VisualVM screenshots in my previous comment, the MAX Heap value in java11 is ~10GB above the value shown for java8.Not sure if it is a coincidence, but Matthias mentioned the same value on this jgit bug[4].I can also try lowering core.packedgitlimit to 1/4 of heaplimit and at the same time remove xms flag and see the outcome.Still, the same value was already used with java8 without OOM trigger.
--
--
To unsubscribe, email repo-discuss...@googlegroups.com
More info at http://groups.google.com/group/repo-discuss?hl=en
---
You received this message because you are subscribed to the Google Groups "Repo and Gerrit Discussion" group.
To unsubscribe from this group and stop receiving emails from it, send an email to repo-discuss...@googlegroups.com.
To view this discussion on the web visit https://groups.google.com/d/msgid/repo-discuss/87702c56-17b7-40f2-b30b-3dc73aad12e4n%40googlegroups.com.
Martin Fick
On Thu, Jun 30, 2022 at 12:36 PM Nuno Costa <nunoco...@gmail.com> wrote:
Which exact OutOfMemoryError including the error message did you get ?
When OOM is triggered, there is no error shown in Gerrit error_log file.I suspect that since gerrit process is killed by OOM, it can't write to file.
Should be looking for the error in some other place?
I was looking for the error message to differentiate between different possible reasons for an OOM:
https://docs.oracle.com/javase/8/docs/technotes/guides/troubleshoot/memleaks002.html
Perhaps there is confusion about what OOM means here? I suspect that Nuno is talking about the operating system OOMin and killing the process, and not the java process not being able to satisfy a memory request for an operation. If that is true, than Nuno needs to investigate why they have over allocated memory on the host that is running Gerrit. i.e. do they have other stuff running on the host that is causing the OOM, and Gerrit just happens to be the largest thing running on the host? Or is the Gerrit heap configuration set higher than the host can handle (what percentage of the host RAM is it set to)?
-Martin
Nuno Costa
Which exact OutOfMemoryError including the error message did you get ?When OOM is triggered, there is no error shown in Gerrit error_log file.I suspect that since gerrit process is killed by OOM, it can't write to file.Should be looking for the error in some other place?I was looking for the error message to differentiate between different possible reasons for an OOM:
https://docs.oracle.com/javase/8/docs/technotes/guides/troubleshoot/memleaks002.html
Steps I did to remove -Xms flag:
Nuno Costa
Perhaps there is confusion about what OOM means here? I suspect that Nuno is talking about the operating system OOMin and killing the process, and not the java process not being able to satisfy a memory request for an operation.
If that is true, than Nuno needs to investigate why they have over allocated memory on the host that is running Gerrit. i.e. do they have other stuff running on the host that is causing the OOM
, and Gerrit just happens to be the largest thing running on the host? Or is the Gerrit heap configuration set higher than the host can handle (what percentage of the host RAM is it set to)?
Martin Fick
, and Gerrit just happens to be the largest thing running on the host? Or is the Gerrit heap configuration set higher than the host can handle (what percentage of the host RAM is it set to)?
This VM has 94GB RAM and heaplimit is at 85GB. Heap limits seems to be the culprit ...
Yes, this is definitely too high. You need to leave room for the
javastack areas also, if your heap is set to 85GB, and you have a
fairly high thread count set, the JVM will likely use several more
GB of memory itself (possibly more than 9GB?). So the java process
itself might be more than the OS can handle, and that doesn't even
try to leave any room for your OS and FS caching which you must
do too.
...but I'm trying to understand why is not working with specific configurations.
It works ok with 3.2.7/java8 and I also was successful with 3.3.10/java11/noXms set(although it was before downgrade to 3.2.7).
Since I was successful (with the same test load as other versions) with 3.2.7/java11/Xms=85g, I will move forward and upgrade again to 3.4.4 and see what happens.
You were getting lucky.
Probably also play with core.packedgitlimit, container.heaplimit and G1GC related values and compare the loads.
While it can be valuable to try and tweak stuff for better per, I
wouldn't conclude much from any results you find under these
conditions as the behavior here may not reflect the behavior you
will see when things are not so over-committed. Better to tweak
things once you have a heap size that is appropriate for your
resources,
-Martin
Nuno Costa
This VM has 94GB RAM and heaplimit is at 85GB. Heap limits seems to be the culprit ...Yes, this is definitely too high. You need to leave room for the javastack areas also, if your heap is set to 85GB, and you have a fairly high thread count set, the JVM will likely use several more GB of memory itself (possibly more than 9GB?). So the java process itself might be more than the OS can handle, and that doesn't even try to leave any room for your OS and FS caching which you must do too.
Luca Milanesio
On 30 Jun 2022, at 17:03, Martin Fick <quic_...@quicinc.com> wrote:On 6/30/22 9:53 AM, Nuno Costa wrote:
, and Gerrit just happens to be the largest thing running on the host? Or is the Gerrit heap configuration set higher than the host can handle (what percentage of the host RAM is it set to)?
This VM has 94GB RAM and heaplimit is at 85GB. Heap limits seems to be the culprit ...Yes, this is definitely too high. You need to leave room for the javastack areas also, if your heap is set to 85GB, and you have a fairly high thread count set, the JVM will likely use several more GB of memory itself (possibly more than 9GB?). So the java process itself might be more than the OS can handle, and that doesn't even try to leave any room for your OS and FS caching which you must do too.
...but I'm trying to understand why is not working with specific configurations.It works ok with 3.2.7/java8 and I also was successful with 3.3.10/java11/noXms set(although it was before downgrade to 3.2.7).
Since I was successful (with the same test load as other versions) with 3.2.7/java11/Xms=85g, I will move forward and upgrade again to 3.4.4 and see what happens.You were getting lucky.
Probably also play with core.packedgitlimit, container.heaplimit and G1GC related values and compare the loads.
While it can be valuable to try and tweak stuff for better per, I wouldn't conclude much from any results you find under these conditions as the behavior here may not reflect the behavior you will see when things are not so over-committed. Better to tweak things once you have a heap size that is appropriate for your resources,
-Martin
--
--
To unsubscribe, email repo-discuss...@googlegroups.com
More info at http://groups.google.com/group/repo-discuss?hl=en
---
You received this message because you are subscribed to the Google Groups "Repo and Gerrit Discussion" group.
To unsubscribe from this group and stop receiving emails from it, send an email to repo-discuss...@googlegroups.com.
To view this discussion on the web visit https://groups.google.com/d/msgid/repo-discuss/16c68887-80d1-0c30-df4f-42c8538cbda0%40quicinc.com.
Nuno Costa
Yes, this is definitely too high. You need to leave room for the javastack areas also, if your heap is set to 85GB, and you have a fairly high thread count set, the JVM will likely use several more GB of memory itself (possibly more than 9GB?). So the java process itself might be more than the OS can handle, and that doesn't even try to leave any room for your OS and FS caching which you must do too.
+1 to that@Nuno just to clarify, did you ever had a Java OOM issue?
Have you tried running the Java process from root and then leaving to the gerrit.sh script to change to the current gerrit user?
(If you are NOT running gerrit.sh as root it won’t be able to adjust the settings for the OOM killer to avoid being chosen for sacrifice, I believe I added a super-duper-warning at the gerrit.sh startup script a while ago)
Luca Milanesio
On 30 Jun 2022, at 18:29, Nuno Costa <nunoco...@gmail.com> wrote:Yes, this is definitely too high. You need to leave room for the javastack areas also, if your heap is set to 85GB, and you have a fairly high thread count set, the JVM will likely use several more GB of memory itself (possibly more than 9GB?). So the java process itself might be more than the OS can handle, and that doesn't even try to leave any room for your OS and FS caching which you must do too.
+1 to that@Nuno just to clarify, did you ever had a Java OOM issue?@LucaNo, I never had a kernel OOM or heard of it during this type of tests. We used them in previous upgrades.But I'm not 100% sure for how many repetitions were done in sequence on previous upgrades.
Only during the tests for 3.4.4 this was surfaced.Regarding JVM OOM, I also never see them in this tests.I was able to reproduce it by lowering heaplimit and that way I could see the Java Heap exceptions in error log.
Have you tried running the Java process from root and then leaving to the gerrit.sh script to change to the current gerrit user?No, I did not tried to start the script as root during the tests.
(If you are NOT running gerrit.sh as root it won’t be able to adjust the settings for the OOM killer to avoid being chosen for sacrifice, I believe I added a super-duper-warning at the gerrit.sh startup script a while ago)Yes, there is the warning.
The reasoning for not using root permissions to start was that most of the applications should not use root nor having full root permissions.
If the script handles the root permissions bits like OOM and then offload to the user set in gerrit.config, than should not be an issue.
TBH I did not checked the startup script extensively.Do you have any additional documentation or settings suggestions regarding java11 VM process resources?
--
--
To unsubscribe, email repo-discuss...@googlegroups.com
More info at http://groups.google.com/group/repo-discuss?hl=en
---
You received this message because you are subscribed to the Google Groups "Repo and Gerrit Discussion" group.
To unsubscribe from this group and stop receiving emails from it, send an email to repo-discuss...@googlegroups.com.
To view this discussion on the web visit https://groups.google.com/d/msgid/repo-discuss/6cc413d4-3bfe-4dc6-b041-ef2b41e21586n%40googlegroups.com.
Martin Fick
On 30 Jun 2022, at 18:29, Nuno Costa <nunoco...@gmail.com> wrote:
Do you have any additional documentation or settings suggestions regarding java11 VM process resources?
I don’t believe your issue is the Java 11 settings but rather the kernel OOM adjustments.
While it is normally important to have the startup script be able to make these adjustments, I suspect that these are not relevant when the only purpose of the VM is to run Gerrit. i.e. all the OOM adjustments in the world aren't going to help if the host is OOM and the only thing to realistically kill is Gerrit,
-Martin
Luca Milanesio
On 30 Jun 2022, at 19:37, Martin Fick <quic_...@quicinc.com> wrote:On 6/30/22 12:11 PM, Luca Milanesio wrote:
On 30 Jun 2022, at 18:29, Nuno Costa <nunoco...@gmail.com> wrote:
Do you have any additional documentation or settings suggestions regarding java11 VM process resources?
I don’t believe your issue is the Java 11 settings but rather the kernel OOM adjustments.
While it is normally important to have the startup script be able to make these adjustments, I suspect that these are not relevant when the only purpose of the VM is to run Gerrit.
i.e. all the OOM adjustments in the world aren't going to help if the host is OOM and the only thing to realistically kill is Gerrit,
Martin Fick
Indeed, if he were then later to use that VM to run hooks, or git
gc...
-Martin
Nuno Costa
As Martin mentioned, possibly you were just below the OOM threshold and possibly Gerrit v3.4 has a slightly higher footprint, which is highly likely because of the extra caches introduced over time.
bool ParGCTrimOverflow = true {product}
bool PrintGCCause = true {product}
bool ScavengeBeforeFullGC = true {product}
bool UseAdaptiveSizeDecayMajorGCCost = true {product}
bool UseGCOverheadLimit = true {product}
bool UseMaximumCompactionOnSystemGC = true {product}
bool UseParallelGC := true {product}
bool UseParallelOldGC = true {product}
openjdk version "1.8.0_332"
OpenJDK Runtime Environment (build 1.8.0_332-b09)
OpenJDK 64-Bit Server VM (build 25.332-b09, mixed mode)
bool ParGCTrimOverflow = true {product} {default}
bool UseAdaptiveSizeDecayMajorGCCost = true {product} {default}
bool UseDynamicNumberOfGCThreads = true {product} {default}
bool UseG1GC = true {product} {ergonomic}
bool UseMaximumCompactionOnSystemGC = true {product} {default}
openjdk version "11.0.15" 2022-04-19 LTS
OpenJDK Runtime Environment 18.9 (build 11.0.15+9-LTS)
OpenJDK 64-Bit Server VM 18.9 (build 11.0.15+9-LTS, mixed mode, sharing)
Only during the tests for 3.4.4 this was surfaced.Regarding JVM OOM, I also never see them in this tests.I was able to reproduce it by lowering heaplimit and that way I could see the Java Heap exceptions in error log.Does v3.2 have the same Java OOM exceptions as well?
No, just Gerrit infra(Apache, mariadb for eventslog but plugin is disabled ATM) and eventually log rotation(I already tested outside the hourly timeframe).
Luca Milanesio
On 1 Jul 2022, at 11:45, Nuno Costa <nunoco...@gmail.com> wrote:As Martin mentioned, possibly you were just below the OOM threshold and possibly Gerrit v3.4 has a slightly higher footprint, which is highly likely because of the extra caches introduced over time.@LucaThe extra caches is a good point for 3.4.4 but I'm seeing kernel OOM on 3.2.7 with java11(G1GC) and but none with java8(ParallelGC).
--
--
To unsubscribe, email repo-discuss...@googlegroups.com
More info at http://groups.google.com/group/repo-discuss?hl=en
---
You received this message because you are subscribed to the Google Groups "Repo and Gerrit Discussion" group.
To unsubscribe from this group and stop receiving emails from it, send an email to repo-discuss...@googlegroups.com.
To view this discussion on the web visit https://groups.google.com/d/msgid/repo-discuss/1469cfc1-b2e9-444d-b428-c23967650095n%40googlegroups.com.
<20220629-1058-3.2.7-java11-4cloneset-failed-application-1656496688825.png><20220629-1226-3.2.7-java8-10cloneset-noOOM-application-1656501970506.png>