system load spikes since 2.16.23 upgrade.
155 views
Skip to first unread message

elzoc...@gmail.com
Nov 27, 2020, 4:27:14 AM11/27/20
to Repo and Gerrit Discussion
Hi Gerrit Community,
First a 3.2 upgrade status, I have a snapshot of our production currently running, and upgraded successfully to 3.2.5.1, all basic tests look good, that's promising, I am hoping to move prod before the end of December!
Am currently taking a look at the Gatling suit, very satisfying to see the clones ramping up, fast :) I still need to integrate it to a jenkins server, and setup the gatling servers in the cloud as my home connection ain't that good. and also need to figure out how to add other stuff than clones and fetches.
One strange thing I have noted though during one of hops to 3.2, I was asked if I wanted to install the Plugin manager plugin, I said yes to see what it was, once gerrit was booted, clicking to the new Plugins tab, it displayed the plugin manager page with a "back to gerrit" (or something similar) link to the left, maybe an icon to the right, but nothing else, no plugins displayed. I checked the setting, I have the allowRemoteAdmin set, I tried to set the jenkinsUrl to the default gerrit-forge but I couldn't get anything displayed.
Since then I destroyed the server and restarted from scratch, second time I didn't say yes to install the plugin, so can't check further on that point.
OK that's it for 3.2 status.
Now to prod, on the 8th of November, we upgraded Prod to 2.16.23. Since then, I've received a few alerts from our monitoring tool about some very high system-load (ubuntu 18.04 LTS) logs tell me system_load has been over 40 in the 1min, 5min stat, and over 30 in the 15min one, CPU activity during those times is normal.
Yesterday I've seen my first one live, when one on my collegue told his clones were stalling.
Attached [show-threads-queue.txt] a example of the show-caches show-queue at that time. only a few clones in progress, very light repos (<100MiB). all the clones at that time where comming from the same VPC as Gerrit, so proximity/speed should be as good as it can be, no flaky home network :)
repo1 - 97M
repo2 - 3.7M
repo3 - 1.1M
repo4 - 5.6M
repo5 - 484K
repo6 - 1.6M
repo7 - 1.8M
repo8 - 5.3M
repo9 - 14M
I got to do top in time attached [top.txt], as you can see lots of HTTP threads are stuck in un-interruptible sleep. at 17:25:46 all 9 clones were still there, at 17:26:16, they were all gone, was looking at the top the `D` threads all disappeared at the same time.
On the Stats side (thanks for the gerrit-monitoring project I've added added those dashboards last month, they look good :)), over the past 2 months, there is no real variations,
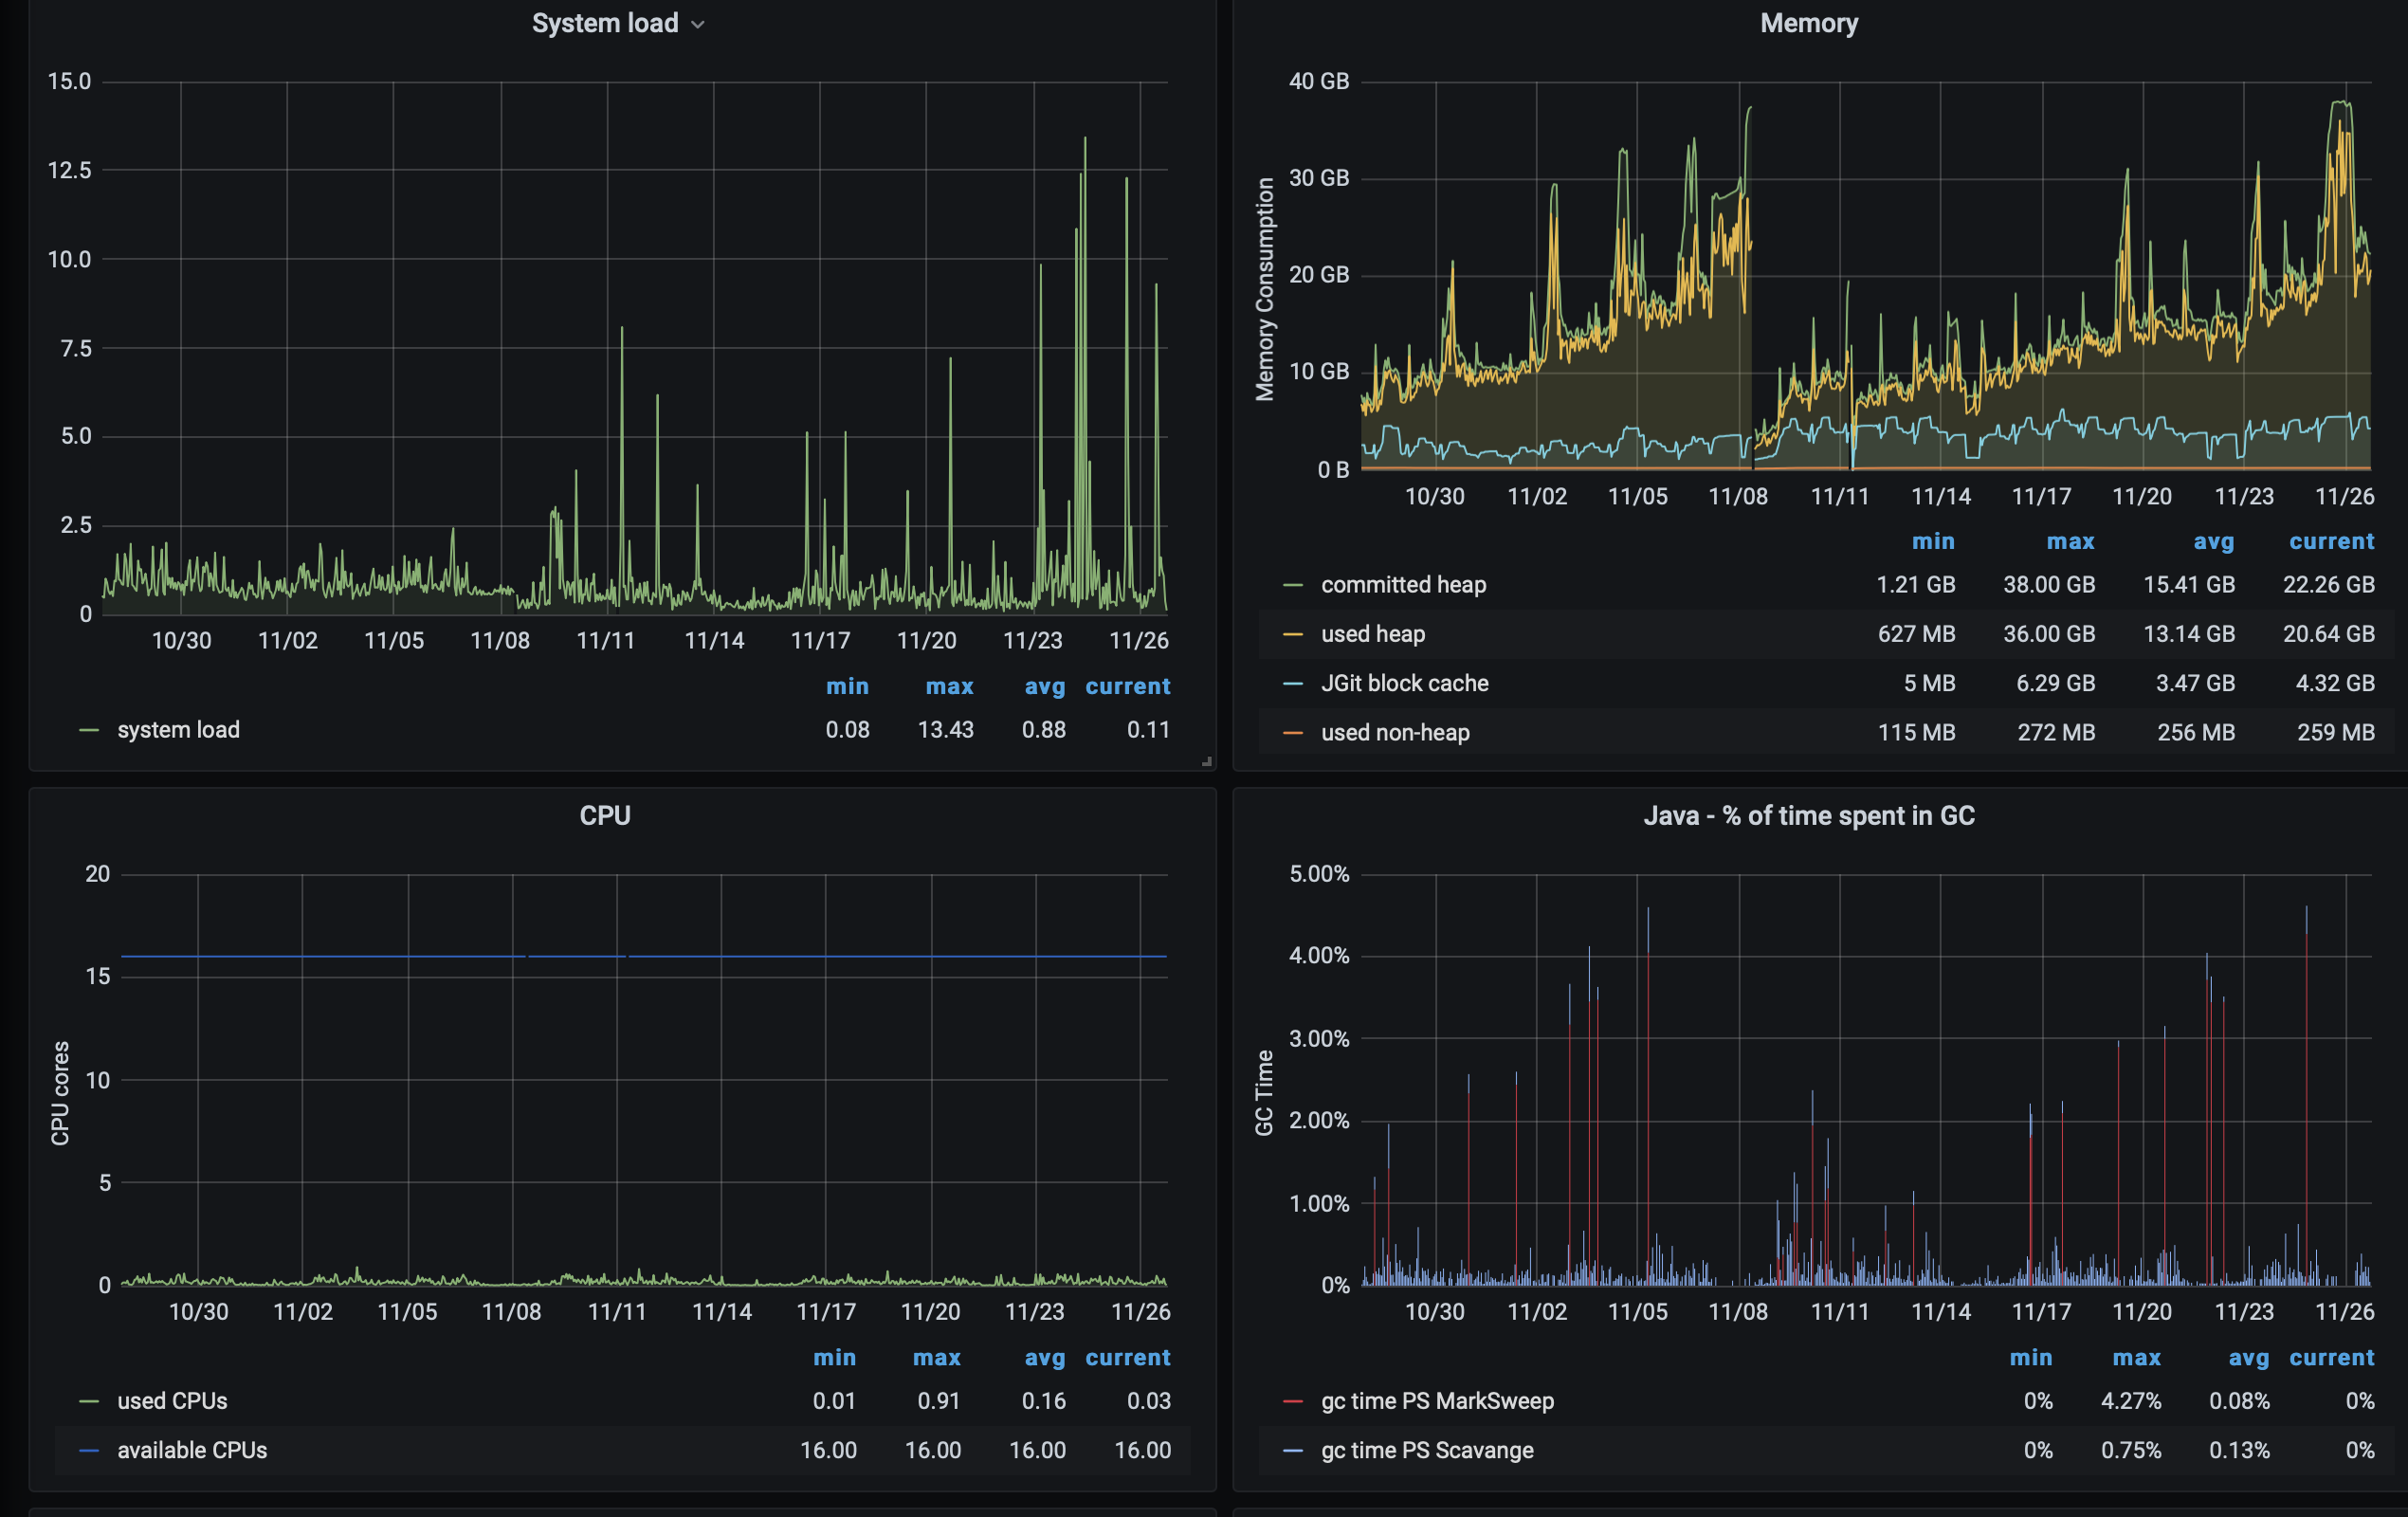
On the grafana prometheus side, only the systemload shows a noticable different behaviour, java Heap is creeping up, but that has always been the case.
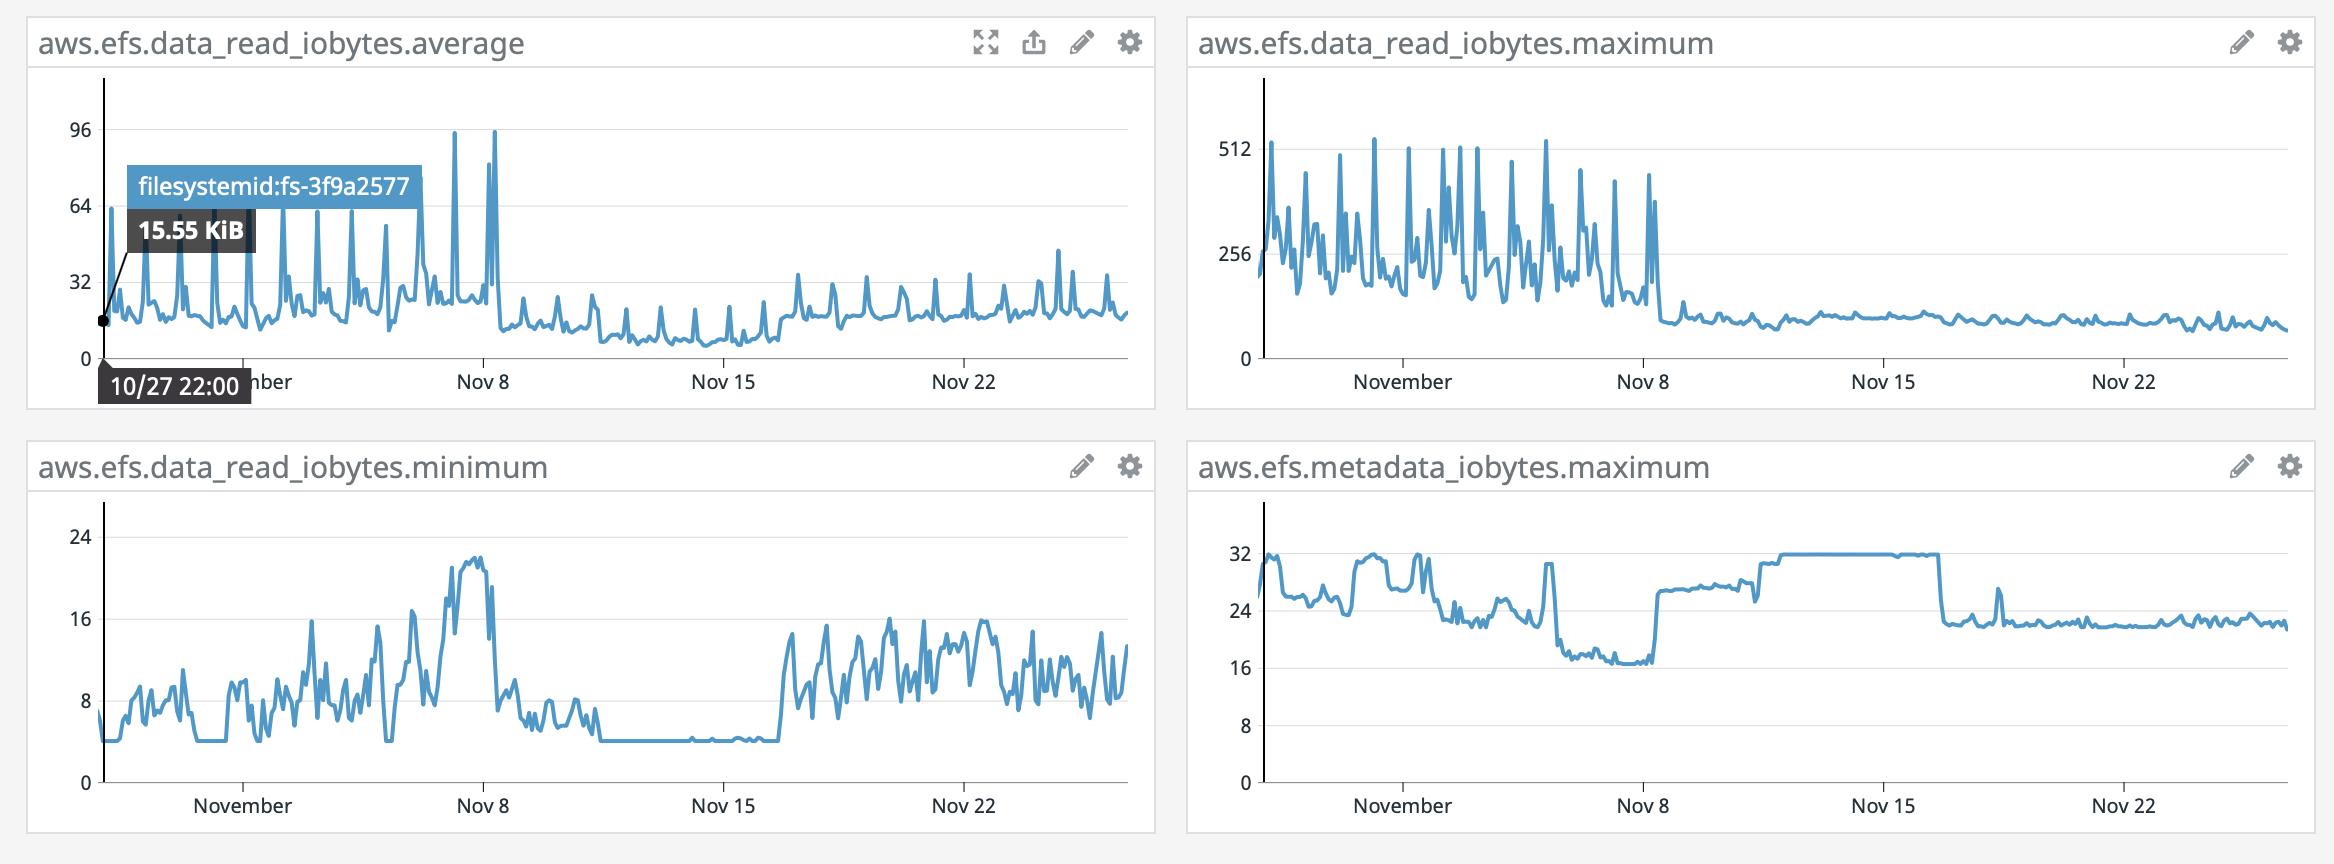
On the AWS monitoring side, here again systemload shows same as grafana, other stat which shows a different behaviour is the EFS data_read.iobytes graphs, see attached [efs_data_read_iobytes.png]
Graphs bellow span 30days, as you can see, easy to pinpoint upgrade day without looking at the dates.

Any idea? I've been monitoring the group, didn't see anything similar pass through.
I'll upgrade to 2.16.25 this Sunday, will see if next week is better, and if not I might have to downgrade back to 2.16.22 if our community start noticing, never did a downgrade, might be a first for me.
Many thanks,
Cedric.

Luca Milanesio
Nov 27, 2020, 4:38:36 AM11/27/20
to elzoc...@gmail.com, Luca Milanesio, Repo and Gerrit Discussion
Hi Cedric,
Thanks for your long and comprehensive e-mail.
I would recommend to keep the future e-mails more focussed, as in your current message you are covering *a lot* of stuff and, at times, it is difficult to focus exactly on the problem you want to highlight and the question to the community.
See my feedback inline.
On 27 Nov 2020, at 09:27, elzoc...@gmail.com <elzoc...@gmail.com> wrote:Hi Gerrit Community,First a 3.2 upgrade status, I have a snapshot of our production currently running, and upgraded successfully to 3.2.5.1, all basic tests look good, that's promising, I am hoping to move prod before the end of December!Am currently taking a look at the Gatling suit, very satisfying to see the clones ramping up, fast :) I still need to integrate it to a jenkins server, and setup the gatling servers in the cloud as my home connection ain't that good. and also need to figure out how to add other stuff than clones and fetches.One strange thing I have noted though during one of hops to 3.2, I was asked if I wanted to install the Plugin manager plugin, I said yes to see what it was, once gerrit was booted, clicking to the new Plugins tab, it displayed the plugin manager page with a "back to gerrit" (or something similar) link to the left, maybe an icon to the right, but nothing else, no plugins displayed. I checked the setting, I have the allowRemoteAdmin set, I tried to set the jenkinsUrl to the default gerrit-forge but I couldn't get anything displayed.Since then I destroyed the server and restarted from scratch, second time I didn't say yes to install the plugin, so can't check further on that point.OK that's it for 3.2 status.Now to prod, on the 8th of November, we upgraded Prod to 2.16.23.
You should consider v2.16.25, which has two *important* security fixes. Be just careful on the reverse-proxy configuration and make sure you test your upgrades in staging before going to production.
Since then, I've received a few alerts from our monitoring tool about some very high system-load (ubuntu 18.04 LTS) logs tell me system_load has been over 40 in the 1min, 5min stat, and over 30 in the 15min one, CPU activity during those times is normal.
Is Gerrit the only process that is running on the box?
Yesterday I've seen my first one live, when one on my collegue told his clones were stalling.Attached [show-threads-queue.txt] a example of the show-caches show-queue at that time. only a few clones in progress, very light repos (<100MiB). all the clones at that time where comming from the same VPC as Gerrit, so proximity/speed should be as good as it can be, no flaky home network :)repo1 - 97Mrepo2 - 3.7Mrepo3 - 1.1Mrepo4 - 5.6Mrepo5 - 484Krepo6 - 1.6Mrepo7 - 1.8Mrepo8 - 5.3Mrepo9 - 14M
What are those numbers referring to? The size of the clone? The size of the bare repository?
I got to do top in time attached [top.txt], as you can see lots of HTTP threads are stuck in un-interruptible sleep. at 17:25:46 all 9 clones were still there, at 17:26:16, they were all gone, was looking at the top the `D` threads all disappeared at the same time.On the Stats side (thanks for the gerrit-monitoring project I've added added those dashboards last month, they look good :)), over the past 2 months, there is no real variations,On the grafana prometheus side, only the systemload shows a noticable different behaviour, java Heap is creeping up, but that has always been the case.
That’s not normal: are you collecting the JVM GC logs and analysed them?
On the AWS monitoring side, here again systemload shows same as grafana, other stat which shows a different behaviour is the EFS data_read.iobytes graphs, see attached [efs_data_read_iobytes.png]Graphs bellow span 30days, as you can see, easy to pinpoint upgrade day without looking at the dates.
<efs_data_read_iobytes.png><grafana_system.png>
Be careful on the AWS EFS settings: I have noticed that the throughput configuration has a huge impact on Gerrit performance.
Out of topic: why are you using EFS and not EBS? Are you in an HA configuration?
Any idea? I've been monitoring the group, didn't see anything similar pass through.
For giving you the root cause of the slowdown, I would need to have access to the full configuration (apart secrets) and the past 30days of logs, so that I can analyse the performance figures over time.
Also, you need to enable the JVM GC log for understanding *IF* the problems noticed are caused by excessive GC.
We’ve noticed that tuning the JGit cache settings can highly reduce the frequency and severity of full and ergonomics GCs.
I'll upgrade to 2.16.25 this Sunday, will see if next week is better, and if not I might have to downgrade back to 2.16.22 if our community start noticing, never did a downgrade, might be a first for me.
I won’t recommend to upgrade/downgrade without any evidence of what’s the problem.
I would be like giving random medicines to a sick patience: may go better, may go even worse, you just don’t know ;-(
HTH
Luca.
Many thanks,Cedric.--
--
To unsubscribe, email repo-discuss...@googlegroups.com
More info at http://groups.google.com/group/repo-discuss?hl=en
---
You received this message because you are subscribed to the Google Groups "Repo and Gerrit Discussion" group.
To unsubscribe from this group and stop receiving emails from it, send an email to repo-discuss...@googlegroups.com.
To view this discussion on the web visit https://groups.google.com/d/msgid/repo-discuss/9b18b180-ac6d-4df7-bcd1-05ef90304614n%40googlegroups.com.
<grafana_system.png><top.txt><show-threads-queue.txt><efs_data_read_iobytes.png>

anish anil
Nov 27, 2020, 4:40:59 AM11/27/20
to elzoc...@gmail.com, Repo and Gerrit Discussion
Hello Elzoc,
What tool are you using you get the system results from?
Thank you,
Anish.
--
Luca Milanesio
Nov 27, 2020, 4:48:49 AM11/27/20
to elzoc...@gmail.com, Luca Milanesio, Repo and Gerrit Discussion
On 27 Nov 2020, at 09:33, elzoc...@gmail.com <elzoc...@gmail.com> wrote:Sorry, show-threads got eaten, new file.
The projects cache just exploded, with 10% of the projects being out of the cache coverage.
Projects loading takes *a long time*.
projects | 1024 | 7.9ms | 90% |
With regards to tasks, I don’t see lots of activity out there:
Task State StartTime Command
------------------------------------------------------------------------------
Queue: SSH-Interactive-Worker
00b59a96 17:17:49.025 git-upload-pack repo1 (user)
1b73d688 17:20:41.095 git-upload-pack repo2 (jenkins)
139c246d 17:21:01.373 git-upload-pack repo3 (jenkins)
8811bf5d 17:21:03.206 git-upload-pack repo4 (jenkins)
bfcddf98 17:21:16.531 git-upload-pack repo5 (jenkins)
595ac3d6 17:21:28.293 git-upload-pack repo6 (jenkins)
d70205f9 17:22:11.723 git-upload-pack repo7 (jenkins)
14af3b47 17:22:18.942 git-upload-pack repo8 (jenkins)
------------------------------------------------------------------------------
8 tasks, 56 worker threads
Just 8 concurrent clones working … one of them has been running for 7 minutes.
Do you have the SSHD log? It contains useful stats on the clone times and where the time is spent.
HTH
Luca.
Hi Gerrit Community,First a 3.2 upgrade status, I have a snapshot of our production currently running, and upgraded successfully to 3.2.5.1, all basic tests look good, that's promising, I am hoping to move prod before the end of December!Am currently taking a look at the Gatling suit, very satisfying to see the clones ramping up, fast :) I still need to integrate it to a jenkins server, and setup the gatling servers in the cloud as my home connection ain't that good. and also need to figure out how to add other stuff than clones and fetches.One strange thing I have noted though during one of hops to 3.2, I was asked if I wanted to install the Plugin manager plugin, I said yes to see what it was, once gerrit was booted, clicking to the new Plugins tab, it displayed the plugin manager page with a "back to gerrit" (or something similar) link to the left, maybe an icon to the right, but nothing else, no plugins displayed. I checked the setting, I have the allowRemoteAdmin set, I tried to set the jenkinsUrl to the default gerrit-forge but I couldn't get anything displayed.Since then I destroyed the server and restarted from scratch, second time I didn't say yes to install the plugin, so can't check further on that point.OK that's it for 3.2 status.Now to prod, on the 8th of November, we upgraded Prod to 2.16.23. Since then, I've received a few alerts from our monitoring tool about some very high system-load (ubuntu 18.04 LTS) logs tell me system_load has been over 40 in the 1min, 5min stat, and over 30 in the 15min one, CPU activity during those times is normal.Yesterday I've seen my first one live, when one on my collegue told his clones were stalling.Attached [show-threads-queue.txt] a example of the show-caches show-queue at that time. only a few clones in progress, very light repos (<100MiB). all the clones at that time where comming from the same VPC as Gerrit, so proximity/speed should be as good as it can be, no flaky home network :)repo1 - 97Mrepo2 - 3.7Mrepo3 - 1.1Mrepo4 - 5.6Mrepo5 - 484Krepo6 - 1.6Mrepo7 - 1.8Mrepo8 - 5.3Mrepo9 - 14MI got to do top in time attached [top.txt], as you can see lots of HTTP threads are stuck in un-interruptible sleep. at 17:25:46 all 9 clones were still there, at 17:26:16, they were all gone, was looking at the top the `D` threads all disappeared at the same time.On the Stats side (thanks for the gerrit-monitoring project I've added added those dashboards last month, they look good :)), over the past 2 months, there is no real variations,On the grafana prometheus side, only the systemload shows a noticable different behaviour, java Heap is creeping up, but that has always been the case.On the AWS monitoring side, here again systemload shows same as grafana, other stat which shows a different behaviour is the EFS data_read.iobytes graphs, see attached [efs_data_read_iobytes.png]Graphs bellow span 30days, as you can see, easy to pinpoint upgrade day without looking at the dates.
<efs_data_read_iobytes.png>
<grafana_system.png>
Any idea? I've been monitoring the group, didn't see anything similar pass through.I'll upgrade to 2.16.25 this Sunday, will see if next week is better, and if not I might have to downgrade back to 2.16.22 if our community start noticing, never did a downgrade, might be a first for me.Many thanks,Cedric.
--
--
To unsubscribe, email repo-discuss...@googlegroups.com
More info at http://groups.google.com/group/repo-discuss?hl=en
---
You received this message because you are subscribed to the Google Groups "Repo and Gerrit Discussion" group.
To unsubscribe from this group and stop receiving emails from it, send an email to repo-discuss...@googlegroups.com.
To view this discussion on the web visit https://groups.google.com/d/msgid/repo-discuss/50d2d34c-16c0-47e7-8c25-013b7a257d0bn%40googlegroups.com.
<show-threads-queue.txt><grafana_system.png><efs_data_read_iobytes.png>

Matthias Sohn
Nov 27, 2020, 6:10:26 AM11/27/20
to elzoc...@gmail.com, Repo and Gerrit Discussion
Hi Gerrit Community,First a 3.2 upgrade status, I have a snapshot of our production currently running, and upgraded successfully to 3.2.5.1, all basic tests look good, that's promising, I am hoping to move prod before the end of December!Am currently taking a look at the Gatling suit, very satisfying to see the clones ramping up, fast :) I still need to integrate it to a jenkins server, and setup the gatling servers in the cloud as my home connection ain't that good. and also need to figure out how to add other stuff than clones and fetches.One strange thing I have noted though during one of hops to 3.2, I was asked if I wanted to install the Plugin manager plugin, I said yes to see what it was, once gerrit was booted, clicking to the new Plugins tab, it displayed the plugin manager page with a "back to gerrit" (or something similar) link to the left, maybe an icon to the right, but nothing else, no plugins displayed. I checked the setting, I have the allowRemoteAdmin set, I tried to set the jenkinsUrl to the default gerrit-forge but I couldn't get anything displayed.Since then I destroyed the server and restarted from scratch, second time I didn't say yes to install the plugin, so can't check further on that point.OK that's it for 3.2 status.Now to prod, on the 8th of November, we upgraded Prod to 2.16.23. Since then, I've received a few alerts from our monitoring tool about some very high system-load (ubuntu 18.04 LTS) logs tell me system_load has been over 40 in the 1min, 5min stat, and over 30 in the 15min one, CPU activity during those times is normal.
Depends on the hardware size and overall traffic if 40 is high or not.
Check top -H to see which threads cause high CPU.
Yesterday I've seen my first one live, when one on my collegue told his clones were stalling.
maybe he clones over a slow WAN link ?
Attached [show-threads-queue.txt] a example of the show-caches show-queue at that time. only a few clones in progress, very light repos (<100MiB). all the clones at that time where comming from the same VPC as Gerrit, so proximity/speed should be as good as it can be, no flaky home network :)repo1 - 97Mrepo2 - 3.7Mrepo3 - 1.1Mrepo4 - 5.6Mrepo5 - 484Krepo6 - 1.6Mrepo7 - 1.8Mrepo8 - 5.3Mrepo9 - 14MI got to do top in time attached [top.txt], as you can see lots of HTTP threads are stuck in un-interruptible sleep. at 17:25:46 all 9 clones were still there, at 17:26:16, they were all gone, was looking at the top the `D` threads all disappeared at the same time.On the Stats side (thanks for the gerrit-monitoring project I've added added those dashboards last month, they look good :)), over the past 2 months, there is no real variations,On the grafana prometheus side, only the systemload shows a noticable different behaviour, java Heap is creeping up, but that has always been the case.
As long as heap usage goes down on full gc that's normal.
Do you use parallel gc or G1GC ?
On the AWS monitoring side, here again systemload shows same as grafana, other stat which shows a different behaviour is the EFS data_read.iobytes graphs, see attached [efs_data_read_iobytes.png]Graphs bellow span 30days, as you can see, easy to pinpoint upgrade day without looking at the dates.
Any idea? I've been monitoring the group, didn't see anything similar pass through.

Check if you run git gc on a regular schedule.
Run git count-objects -vH on the involved repositories in order to see if you are running it properly.
Run git count-objects -vH on the involved repositories in order to see if you are running it properly.
Check number of loose and total number of refs in affected repositories:
cd to bare repository
find refs -type f | wc -l
git show-ref | wc -l
cd to bare repository
find refs -type f | wc -l
git show-ref | wc -l
I'll upgrade to 2.16.25 this Sunday, will see if next week is better, and if not I might have to downgrade back to 2.16.22 if our community start noticing, never did a downgrade, might be a first for me.Many thanks,Cedric.
--
--
To unsubscribe, email repo-discuss...@googlegroups.com
More info at http://groups.google.com/group/repo-discuss?hl=en
---
You received this message because you are subscribed to the Google Groups "Repo and Gerrit Discussion" group.
To unsubscribe from this group and stop receiving emails from it, send an email to repo-discuss...@googlegroups.com.
To view this discussion on the web visit https://groups.google.com/d/msgid/repo-discuss/9b18b180-ac6d-4df7-bcd1-05ef90304614n%40googlegroups.com.
elzoc...@gmail.com
Nov 27, 2020, 6:53:04 AM11/27/20
to Repo and Gerrit Discussion
(sorry Groups gave me an error when I try publishing, I hope it won't send 5 copies... as I was going to retry new message from Matthias so will add my answers here too. thanks!)
Thanks for your answers, will answer most of it inline,
To Anish question for Gerrit Stats am using the Grafana dashboards which were posted a few weeks back. AWS/EFS stats are from datadog.
Last note from Lucas, I do not have any meaningful sshd_log, the Server is behind an AWS ELB, and it only allows https traffic through.
ssh is enabled in the config so we can perform maintenance tasks like gc, flush, or adding internal users.
I took a look through random show-threads I took over the past few month, that project caches is rarely different than 90%.
to answer Matthias,
it's high, but that's just the system load, cpu are low so it's probably IO.
I included a top.txt in the first message, it's an output of "top -H" sorted by process status, and reverted so the "D"s are on top.
His cloning slaves are within the VPC, all in the same AWS AZ so interconnect should be optimal.
Git GC is run every morning through the gerrit.config [gc] fields.
>> Do you use parallel gc or G1GC ? I don't know, sorry, my java exp. is somewhat limited.
I did the refs on 2 repo which was stalling for 5min earlier, there were 5 other similar clones in that show-threads, (<1MiB)
repo 1
du -h | tail -n 1
380K .
find refs -type f | wc -l
0
git show-ref | wc -l
129
repo 2
du -h | tail -n 1
7.7M .
git show-ref | wc -l
1025
find refs -type f | wc -l
0
Thanks,
Le vendredi 27 novembre 2020 à 09:38:36 UTC, lucamilanesio a écrit :
Hi Cedric,Thanks for your long and comprehensive e-mail.I would recommend to keep the future e-mails more focussed, as in your current message you are covering *a lot* of stuff and, at times, it is difficult to focus exactly on the problem you want to highlight and the question to the community.
wilco, tks.
See my feedback inline.On 27 Nov 2020, at 09:27, elzoc...@gmail.com <elzoc...@gmail.com> wrote:Hi Gerrit Community,First a 3.2 upgrade status, I have a snapshot of our production currently running, and upgraded successfully to 3.2.5.1, all basic tests look good, that's promising, I am hoping to move prod before the end of December!Am currently taking a look at the Gatling suit, very satisfying to see the clones ramping up, fast :) I still need to integrate it to a jenkins server, and setup the gatling servers in the cloud as my home connection ain't that good. and also need to figure out how to add other stuff than clones and fetches.One strange thing I have noted though during one of hops to 3.2, I was asked if I wanted to install the Plugin manager plugin, I said yes to see what it was, once gerrit was booted, clicking to the new Plugins tab, it displayed the plugin manager page with a "back to gerrit" (or something similar) link to the left, maybe an icon to the right, but nothing else, no plugins displayed. I checked the setting, I have the allowRemoteAdmin set, I tried to set the jenkinsUrl to the default gerrit-forge but I couldn't get anything displayed.Since then I destroyed the server and restarted from scratch, second time I didn't say yes to install the plugin, so can't check further on that point.OK that's it for 3.2 status.Now to prod, on the 8th of November, we upgraded Prod to 2.16.23.You should consider v2.16.25, which has two *important* security fixes. Be just careful on the reverse-proxy configuration and make sure you test your upgrades in staging before going to production.
That's planned for Sunday (or was planned, not sure anymore, might want to get the java gc logs running for a while before upgrading),
proxy is the AWS ELB, am pretty sure I tried to log-in without problems when I did the hop to 2.16.25 before going to 3, but just in case will redo the manip, thanks for the warning.
Since then, I've received a few alerts from our monitoring tool about some very high system-load (ubuntu 18.04 LTS) logs tell me system_load has been over 40 in the 1min, 5min stat, and over 30 in the 15min one, CPU activity during those times is normal.Is Gerrit the only process that is running on the box?
It is the only intensive process, I also have a puppet agent running once every 5min, a Datadog agent, and tanium/qualys, but those are very lightweight, do not do anything to the EFS.
Yesterday I've seen my first one live, when one on my collegue told his clones were stalling.Attached [show-threads-queue.txt] a example of the show-caches show-queue at that time. only a few clones in progress, very light repos (<100MiB). all the clones at that time where comming from the same VPC as Gerrit, so proximity/speed should be as good as it can be, no flaky home network :)repo1 - 97Mrepo2 - 3.7Mrepo3 - 1.1Mrepo4 - 5.6Mrepo5 - 484Krepo6 - 1.6Mrepo7 - 1.8Mrepo8 - 5.3Mrepo9 - 14MWhat are those numbers referring to? The size of the clone? The size of the bare repository?
Those were the bare repo.
I got to do top in time attached [top.txt], as you can see lots of HTTP threads are stuck in un-interruptible sleep. at 17:25:46 all 9 clones were still there, at 17:26:16, they were all gone, was looking at the top the `D` threads all disappeared at the same time.On the Stats side (thanks for the gerrit-monitoring project I've added added those dashboards last month, they look good :)), over the past 2 months, there is no real variations,On the grafana prometheus side, only the systemload shows a noticable different behaviour, java Heap is creeping up, but that has always been the case.That’s not normal: are you collecting the JVM GC logs and analysed them?
am not, did a bit of googling, will try to add "javaOptions = -XX:+PrintGCDetails -Xloggc:/gerrit/logs/java_gc.log" before our next restart.
On the AWS monitoring side, here again systemload shows same as grafana, other stat which shows a different behaviour is the EFS data_read.iobytes graphs, see attached [efs_data_read_iobytes.png]Graphs bellow span 30days, as you can see, easy to pinpoint upgrade day without looking at the dates.<efs_data_read_iobytes.png><grafana_system.png>Be careful on the AWS EFS settings: I have noticed that the throughput configuration has a huge impact on Gerrit performance.Out of topic: why are you using EFS and not EBS? Are you in an HA configuration?
I only took the mantle last year so might not have the full reasoning, from what I understand, EFS was chosen because, it's easily scalable, and could be mounted to multiple EC2s in different AZs. So we have the master in one AZ, and a hot replica in readonly in an other, so that if heath check detects an issue, traffic gets redirected to the replica.
I've added last year when we migrated to 2.16, the high-availability plugin so the replica review changes are keept up-to-date (before PolyGerrit we had a maintenance banner hiding everything). git is the same folder shared via the EFS and mounted as ro- on the replica.
The EFS burst credits are always full, except during the daily GC when it drops a bit.
Any idea? I've been monitoring the group, didn't see anything similar pass through.For giving you the root cause of the slowdown, I would need to have access to the full configuration (apart secrets) and the past 30days of logs, so that I can analyse the performance figures over time.
Attaching redacted gerrit.config and high-avail., they have not really changed in the past Year or so, before that summer 19, I doubled the heap/threads, when we increased the EC2 to an m5.4xl.
Also have notedb.config which appeared with the noted migration a year back, and a replication one.
Also, you need to enable the JVM GC log for understanding *IF* the problems noticed are caused by excessive GC.
Will take a look at that and add them before the next restart.
We’ve noticed that tuning the JGit cache settings can highly reduce the frequency and severity of full and ergonomics GCs.
I can't find anything about JGit cache in our config, so I guess that's something I will take a look at, is there any docs on how to tune that? will do some googling.
I'll upgrade to 2.16.25 this Sunday, will see if next week is better, and if not I might have to downgrade back to 2.16.22 if our community start noticing, never did a downgrade, might be a first for me.
I won’t recommend to upgrade/downgrade without any evidence of what’s the problem.I would be like giving random medicines to a sick patience: may go better, may go even worse, you just don’t know ;-(HTHLuca.
Thanks again!
Cedric.
Matthias Sohn
Nov 27, 2020, 7:08:10 AM11/27/20
to elzoc...@gmail.com, Repo and Gerrit Discussion
Hi,(sorry Groups gave me an error when I try publishing, I hope it won't send 5 copies... as I was going to retry new message from Matthias so will add my answers here too. thanks!)Thanks for your answers, will answer most of it inline,To Anish question for Gerrit Stats am using the Grafana dashboards which were posted a few weeks back. AWS/EFS stats are from datadog.Last note from Lucas, I do not have any meaningful sshd_log, the Server is behind an AWS ELB, and it only allows https traffic through.ssh is enabled in the config so we can perform maintenance tasks like gc, flush, or adding internal users.I took a look through random show-threads I took over the past few month, that project caches is rarely different than 90%.to answer Matthias,it's high, but that's just the system load, cpu are low so it's probably IO.I included a top.txt in the first message, it's an output of "top -H" sorted by process status, and reverted so the "D"s are on top.His cloning slaves are within the VPC, all in the same AWS AZ so interconnect should be optimal.Git GC is run every morning through the gerrit.config [gc] fields.
ok, double-check using git count-objects if it works (it should) ?
>> Do you use parallel gc or G1GC ? I don't know, sorry, my java exp. is somewhat limited.
Parallel GC has higher throughput but longer stop-the-world pauses.
I did the refs on 2 repo which was stalling for 5min earlier, there were 5 other similar clones in that show-threads, (<1MiB)repo 1du -h | tail -n 1380K .find refs -type f | wc -l0git show-ref | wc -l129repo 2du -h | tail -n 17.7M .git show-ref | wc -l1025find refs -type f | wc -l0
that's tiny and shouldn't cause performance issues
core.packedGitLimit | 10 MiB | ✅ | Maximum number of bytes to cache in memory from pack files. Maximum 1/4 of max heap size. |
core.packedGitMmap | false | ✅ | Whether to use Java NIO virtual memory mapping for JGit buffer cache. When set to true enables use of Java NIO virtual memory mapping for cache windows, false reads entire window into a byte[] with standard read calls. true is experimental and may cause instabilities and crashes since Java doesn't support explicit unmapping of file regions mapped to virtual memory. |
core.packedGitOpenFiles | 128 | ⃞ | Maximum number of streams to open at a time. Open packs count against the process limits. |
core.packedGitUseStrongRefs | false | ⃞ | Whether the window cache should use strong references (true) or SoftReferences (false). When false the JVM will drop data cached in the JGit block cache when heap usage comes close to the maximum heap size. |
core.packedGitWindowSize | 8 kiB | ✅ | Number of bytes of a pack file to load into memory in a single read operation. This is the "page size" of the JGit buffer cache, used for all pack access operations. All disk IO occurs as single window reads. Setting this too large may cause the process to load more data than is required; setting this too small may increase the frequency of read() system calls. |
The JGit cache should be large enough to cache the total packfile contents of your hot repositories to reduce IO.
We use the following settings for a server with 256GB max heap size:
We use the following settings for a server with 256GB max heap size:
packedGitOpenFiles = 30000
packedGitLimit = 30G
packedGitUseStrongRefs = true
To view this discussion on the web visit https://groups.google.com/d/msgid/repo-discuss/e3832060-88ad-45cc-97f9-cb33118936f6n%40googlegroups.com.
Matthias Sohn
Nov 27, 2020, 7:11:13 AM11/27/20
to elzoc...@gmail.com, Repo and Gerrit Discussion
elzoc...@gmail.com
Nov 27, 2020, 1:17:31 PM11/27/20
to Repo and Gerrit Discussion
Thanks Mathias,
will definitively look at those, I can't see any jgit.config, so there is probably some running that I can do there.
--
one of our jenkins job in the same VPC failed earlier, time coincide with a system_load spike,
the job sent a "git --no-pager remote -v show cmf" at 14:43:55
and received the fatal at 14:48:55
fatal: unable to access 'https://gerrit.example.com/r/notify/': The requested URL returned error: 504
in the httpd log I can see the 2 expected traces:
x.xx.xx.xx [HTTP-8437377] - - [27/Nov/2020:14:43:55 +0000] "GET /r/notify/info/refs?service=git-upload-pack HTTP/1.1" 401 12 - "git/2.17.1"
x.xx.xx.xx [HTTP-8437379] - jenkins [27/Nov/2020:14:49:04 +0000] "GET /r/notify/info/refs?service=git-upload-pack HTTP/1.1" 200 2566 - "git/2.17.1"
no mention of the "notify" repo in the error log.
--
Lucas questions got dropped earlier,
A quick sum-up:
We were planning to move to 2.16.25 this Sunday, not sure its wise anymore.
Java GC logs where not logged, I've added them to gerrit.config, will do a restart during the WE, probably sunday instead of the upgrade.
Gerrit is the only real process on the EC2, a few agents such as puppet, datadog are also present but very light weight.
The sizes of the repo I was refering to was the bare repo.
We are using EFS mostly for HA has it can be mouted accross different AZs withing a region. so replica is in a different AZ. EFS Bursting credits are topped almost 100% for the day, only exception is the nightly git gc where they drop a bit.
Will take a look to try to customize the cache settings as everything is default.
Thanks for your help!
Cedric.
elzoc...@gmail.com
Nov 27, 2020, 1:53:04 PM11/27/20
to Repo and Gerrit Discussion
And apologies @Matthias and @Luca, you are helping me and I managed to misspell your first names...
time to go to bed early, will take a new look at those configs with a fresh mind tomorrow!
Tks,
Reply all
Reply to author
Forward
0 new messages