Monophyletic... or?

164 views
Skip to first unread message

jj biodiversity

unread,
Jun 12, 2022, 8:36:39 PM6/12/22
to raxml
Dear community,

This is my first time using RAxML. I would appreciate if you could take a look at this issue.

I made a ML tree, and found these apparently two distinct group of taxa. However, transforming it into cladogram suggests that they are monophyletic with bootstrap support of 71. 

I am unsure if I should interpret them as monophyletic and this is a problem of how the tree was drawn by RAxML, despite the zero branch length from the clade to ancestral node. 

Any insights?

Thank you kindly in advance,
Jeong

RAXMLhyal20.JPG
RAXMLhyal20C.JPG

Alexandros Stamatakis

unread,
Jun 12, 2022, 11:20:27 PM6/12/22
to ra...@googlegroups.com
Dear Jeong,

Which tool are you using to visualize the tree and which RAxML output
file are you using as input for your visualization tool?

There are some known problems with tree viewers and support values that
are described in the following paper:

https://pubmed.ncbi.nlm.nih.gov/28369572/

Alexis
> RAXMLhyal20.JPG
> RAXMLhyal20C.JPG
>
> --
> You received this message because you are subscribed to the Google
> Groups "raxml" group.
> To unsubscribe from this group and stop receiving emails from it, send
> an email to raxml+un...@googlegroups.com
> <mailto:raxml+un...@googlegroups.com>.
> To view this discussion on the web visit
> https://groups.google.com/d/msgid/raxml/4bfcc66c-978d-4905-bb65-d7a806fd62f8n%40googlegroups.com
> <https://groups.google.com/d/msgid/raxml/4bfcc66c-978d-4905-bb65-d7a806fd62f8n%40googlegroups.com?utm_medium=email&utm_source=footer>.

--
Alexandros (Alexis) Stamatakis

Research Group Leader, Heidelberg Institute for Theoretical Studies
Full Professor, Dept. of Informatics, Karlsruhe Institute of Technology
Affiliated Scientist, Evolutionary Genetics and Paleogenomics (EGP) lab,
Institute of Molecular Biology and Biotechnology, Foundation for
Research and Technology Hellas

www.exelixis-lab.org

Lucas Czech

unread,
Jun 13, 2022, 12:11:02 AM6/13/22
to ra...@googlegroups.com

Dear Jeong,

to add to this, it might also be that you indeed have a branch with virtually zero branch length there. Judging from the images you posted, there are some (almost-) zero branch lengths within these clades, so I am assuming that you are trying to resolve a phylogeny of very closely related sequences there, such as strains from the same species? It might just be that these three involved clades (including the one at the top of your picture that is not shown) are indeed very close to being trifurcating, so that they appear as zero branch lengths.

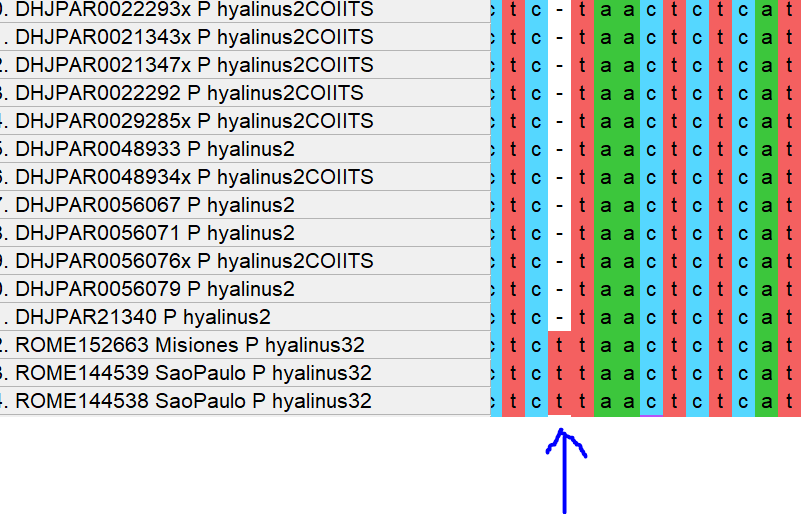
Alternatively, it might be an issue with the alignment, such as sequences aligning to different regions of the alignment, so that their respective phylogeny cannot be properly resolved:

Seq1    AAAAAA----
Seq2    AAATAA----
Seq3    ----AACCCC
Seq4    ----AACGCC

Here, Seq1 and Seq2 would be in one clade, and Seq3 and Seq4 in another, but their respective parent branch that leads to these four sequences cannot properly resolve between the two clades. That might be worth checking with some alignment viewer, such as AliView.

Lastly, which RAxML version are you using? We always suggest to switch to RAxML-ng, which is the current and maintained version.

Cheers and so long
Lucas

jj biodiversity

unread,
Jun 13, 2022, 1:57:41 AM6/13/22
to raxml
Dear Alexis and Lucas, thank you for your inputs.

I used Figtree. I am unsure if this is the problem of visualization tool however, as I'm getting the same result with Dendroscope. For the alignment, there are overlap of at least 80% of sites, so the alignment is likely not an issue.

As you say Lucas, the sequences are from the same species complex. The ones in the same "clade" are from what I speculate as identical species.

Additionally, I used species delimitation method PTP, which suggested that these taxon form a single species. My understanding is that monophyly is required for species to be delimited in PTP. Hmm....

Regards,
Jeong

Lucas Czech

unread,
Jun 13, 2022, 2:10:10 AM6/13/22
to ra...@googlegroups.com

Well, in that case, it might just be that these are the maximum likelihood branch lengths for that tree :-) or is there a reason why that seems improbable?

To unsubscribe from this group and stop receiving emails from it, send an email to raxml+un...@googlegroups.com.
To view this discussion on the web visit https://groups.google.com/d/msgid/raxml/8b9d2cec-d0ce-4f2d-88b7-e0b149a7ea15n%40googlegroups.com.

jj biodiversity

unread,
Jun 13, 2022, 2:36:24 AM6/13/22
to raxml
I just thought it is very odd to have a monophyletic group that has zero branch length to its ancestor.
Is this a known occurrence among the closely related lineages? 

Regards,
Jeong

Alexandros Stamatakis

unread,
Jun 13, 2022, 8:34:50 AM6/13/22
to ra...@googlegroups.com
can you send me the RAxML output file you are visualizing?

Also to answer a previous question, yes for (m)PTP to consider a bunch
of sequences as stemming from one single species they need to be
monophyletic in the tree.

Alexis
>> viewer, such as AliView <https://ormbunkar.se/aliview/>.
>>
>> Lastly, which RAxML version are you using? We always suggest
>> to switch to RAxML-ng <https://github.com/amkozlov/raxml-ng>,
>>>> <https://groups.google.com/d/msgid/raxml/4bfcc66c-978d-4905-bb65-d7a806fd62f8n%40googlegroups.com?utm_medium=email&utm_source=footer>
>>>> <https://groups.google.com/d/msgid/raxml/4bfcc66c-978d-4905-bb65-d7a806fd62f8n%40googlegroups.com?utm_medium=email&utm_source=footer>.
>>>>
>>>
>> --
>> You received this message because you are subscribed to the Google
>> Groups "raxml" group.
>> To unsubscribe from this group and stop receiving emails from it,
>> send an email to raxml+un...@googlegroups.com.
>> To view this discussion on the web visit
>> https://groups.google.com/d/msgid/raxml/8b9d2cec-d0ce-4f2d-88b7-e0b149a7ea15n%40googlegroups.com
>> <https://groups.google.com/d/msgid/raxml/8b9d2cec-d0ce-4f2d-88b7-e0b149a7ea15n%40googlegroups.com?utm_medium=email&utm_source=footer>.
>
> --
> You received this message because you are subscribed to the Google
> Groups "raxml" group.
> To unsubscribe from this group and stop receiving emails from it, send
> an email to raxml+un...@googlegroups.com
> <mailto:raxml+un...@googlegroups.com>.
> To view this discussion on the web visit
> https://groups.google.com/d/msgid/raxml/e0c6f24b-f735-43be-b7fb-cb07b1551448n%40googlegroups.com
> <https://groups.google.com/d/msgid/raxml/e0c6f24b-f735-43be-b7fb-cb07b1551448n%40googlegroups.com?utm_medium=email&utm_source=footer>.

jj biodiversity

unread,
Jun 13, 2022, 10:57:41 AM6/13/22
to raxml
Hello Alexis,

I sent you the tre file to your email.

Regards,
Jeong

Grimm

unread,
Jun 13, 2022, 2:55:46 PM6/13/22
to raxml
Hi Jeong,

" have a monophyletic group that has zero branch length to its ancestor. Is this a known occurrence among the closely related lineages? "

The short answer is yes. Near-zero length branches are rather the rule when you look at closely related lineages. It's also not unusual to get a "high" support for a bipartition that is connected to a (near)-zero branch. The "71" for the (near)zero branch just tell you that 71% of the bootstrap replicates grouped the ROME... tips from all others but that this bipartition has no or very diffuse character support in the matrix (hence the collapsed branch)

The long answer is that molecular phylogenetic tree are inferences under a specific model of evolution: dichotomy. Dichotomy implies that our data doesn't include any ancestors, only sister taxa. When we label a clade in the inferred tree as "monophyletic", we do this under the further assumption that the inferred tree = the 'true tree'. For many and data-wise trivial cases this is ok.
But the closer you get to the leaves of the tree of life our model of evolution is wrong: species don't form exclusively during dichotomous splits. Pending the overall differentiation, the amount of lineage-specific fixed mutational patterns that are accumulated during the process of species in the data we used, it may actually happen that our data include ancestral sequence and their satellites types (which can be one or many), something a ML phylogenetic tree cannot resolve at all. There also may be further distorting ambiguous signal effects from reticulation: the mixing of lineages. The result are "false positives", clades that are not monophyletic but tree inference branching artefacts. In molecular phylogeny, we use the terminologies as synonymes but in reality, close to the leaves of the Coral of Life, an inferred clade in a tree is neither a sufficient nor a necessary criterium (https://en.wikipedia.org/wiki/Necessity_and_sufficiency) for monophyly, i.e. inclusive common origin: a group that includes the (hypothetical) ancestor and all its descendants.

Cheers, Guido

Alexandros Stamatakis

unread,
Jun 13, 2022, 11:21:44 PM6/13/22
to ra...@googlegroups.com
Thanks,

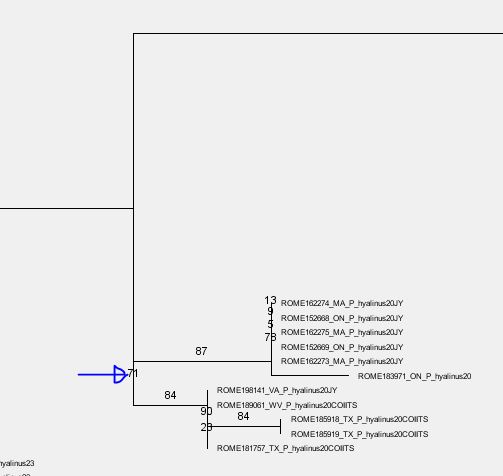
I just visualized it and it seems that the support of 71 you have there
refers to the entire group you are interested in. I assume it might be a
visualization issue due to the short branch lengths.

The partially very small branch lengths are okay here I believe as you
want to delimit species on the tree so you do need/expect near-zero
branch lengths in some parts of the tree.

Alexis
> <https://groups.google.com/d/msgid/raxml/8b9d2cec-d0ce-4f2d-88b7-e0b149a7ea15n%40googlegroups.com?utm_medium=email&utm_source=footer
> <https://groups.google.com/d/msgid/raxml/8b9d2cec-d0ce-4f2d-88b7-e0b149a7ea15n%40googlegroups.com?utm_medium=email&utm_source=footer>>.
>
> >
> > --
> > You received this message because you are subscribed to the Google
> > Groups "raxml" group.
> > To unsubscribe from this group and stop receiving emails from it,
> send
> > an email to raxml+un...@googlegroups.com
> > <mailto:raxml+un...@googlegroups.com>.
> > To view this discussion on the web visit
> >
> https://groups.google.com/d/msgid/raxml/e0c6f24b-f735-43be-b7fb-cb07b1551448n%40googlegroups.com
> <https://groups.google.com/d/msgid/raxml/e0c6f24b-f735-43be-b7fb-cb07b1551448n%40googlegroups.com>
>
> >
> <https://groups.google.com/d/msgid/raxml/e0c6f24b-f735-43be-b7fb-cb07b1551448n%40googlegroups.com?utm_medium=email&utm_source=footer
> <https://groups.google.com/d/msgid/raxml/e0c6f24b-f735-43be-b7fb-cb07b1551448n%40googlegroups.com?utm_medium=email&utm_source=footer>>.
>
>
> --
> Alexandros (Alexis) Stamatakis
>
> Research Group Leader, Heidelberg Institute for Theoretical Studies
> Full Professor, Dept. of Informatics, Karlsruhe Institute of Technology
> Affiliated Scientist, Evolutionary Genetics and Paleogenomics (EGP)
> lab,
> Institute of Molecular Biology and Biotechnology, Foundation for
> Research and Technology Hellas
>
> www.exelixis-lab.org <http://www.exelixis-lab.org>
>
> --
> You received this message because you are subscribed to the Google
> Groups "raxml" group.
> To unsubscribe from this group and stop receiving emails from it, send
> an email to raxml+un...@googlegroups.com
> <mailto:raxml+un...@googlegroups.com>.
> To view this discussion on the web visit
> https://groups.google.com/d/msgid/raxml/3fba1797-ea89-4afa-8834-8830d1231b51n%40googlegroups.com
> <https://groups.google.com/d/msgid/raxml/3fba1797-ea89-4afa-8834-8830d1231b51n%40googlegroups.com?utm_medium=email&utm_source=footer>.

jj biodiversity

unread,
Jun 14, 2022, 8:06:59 PM6/14/22
to raxml
Dear Grimm,

Thank you for the detailed explanations. If I understand correctly, are you referring to incomplete lineage sorting? If so, that does seem to explain this ambiguous pattern..

Dear Alexis,

Thank you kindly for analyzing the tree. 71 is indeed the support value for the group of interest.

Regards,
Jeong

Grimm

unread,
Jun 15, 2022, 3:45:07 AM6/15/22
to raxml
Hi Jeong,

ILS is yet another issue but may indeed inflict similar signal issues. But ILS is just a sorting phenomenon that occurs also when the evolution was dichotomous.

Whether it is ancestor-descendant noise or ILS or reticulation (non-treelike evolution), and whether BS = 71  also depends whether the data you used to infer the tree is sufficient for your particular question is single-gene or multi-gene.

In multi-gene, ILS may decrease BS support, because some genes prefer a different topology because they are not sorted during the dichotomous speciation events.
In multi-gene and single-gene data, lack of signal can be behind ambiguous support but also tree-incompatible signal, e.g. an ancestral species splitting up in many not only two species (very common when looking at virus phylogenies or "coalface" phylogenies: populations sorting into forming species), heterozygosity effects, or evolutionary anastomoses (secondary lineage mixing) such as introgression, hybridisation or horizontal gene flow. We may also look at gene families without realising: genetic paralogy, sequences from similar but non-orthologous genes. In plants, we have in addition polyploids and homeology.
In single-gene data (especially or more primitive live forms) we may have recombination: naturally occurring chimeric sequences.

The BS = 71 means that if we resample the character matrix, most trees will still have this split. So, to delimit a species, it would be ok: the branch your are interested in has BS = 71. The surrounding branches all are long: the two ROME haplo-/genotypes (BS = 87 viz BS = 84; subspecies of ROME) are genetically clearly distinct from everything else and most similar (phylogenetically and probably absolutely) to each other. This would be a good argument for a species as Alexi pointed out having looked at the tree. Very importantly: irrespective of whether we apply a cladistic or biological or other species concept; or follow Mallet's and few others philosophy seeing species as what they are: groups of obviously similar individuals/genetic types within a phylogenetic lineage that can be recognised and defined (are "coherent") and have a purpose.

Mallet J. 1995. A species definition for the Modern Synthesis. Trends in Ecology and Evolution 10:294-299. [PDF by the author]
Mallet J. 2001. The speciation revolution. Journal of Evolutionary Biology 14:887-888.
Mallet J. 2007. Hybrid speciation. Nature 446:279-283. [PDF]
Mallet J. 2008. Hybridization, ecological races, and the nature of species: empirical evidence for the ease of speciation. Philosophical Transactions of the Royal Society of London, Series B 363:2971–2986.
Mallet J. 2010. Why was Darwin’s view of species rejected by twentieth century biologists? Biology and Philosophy 25:497-527. [on ResearchGate]

If the tree is well sampled, i.e. if you can be sure the other tips cover all putative related sibling lineages (haplo-/genotypes) of the two ROME populations, such a signal pattern also points to an inclusive common origin (if you want to apply the cladistic species concept): a putative monophyletic ROME species that goes back to a single shared, exclusive to them, common ancestor.

In such a scenario, the lack of a visible root branch (a non-zero-length branch) associated to the BS = 71 only means there's is no fixed mutation linked to the last common ancestor, the actual population that split into the two ROME lineages.

But if your main interest is phylogeny, the evolution of a group your tree has some red flags:
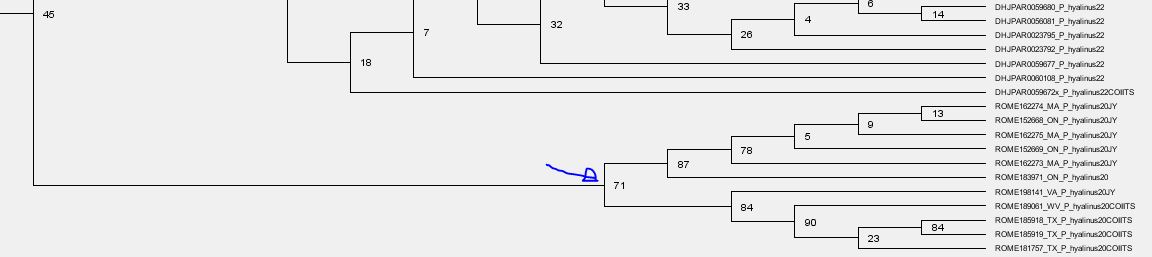
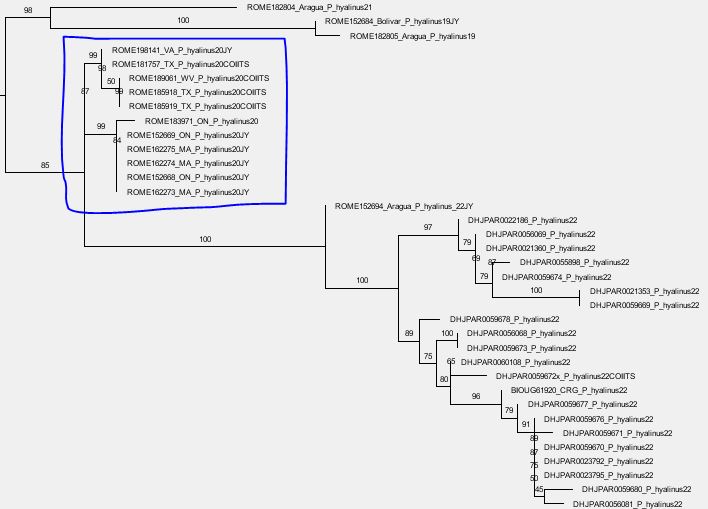
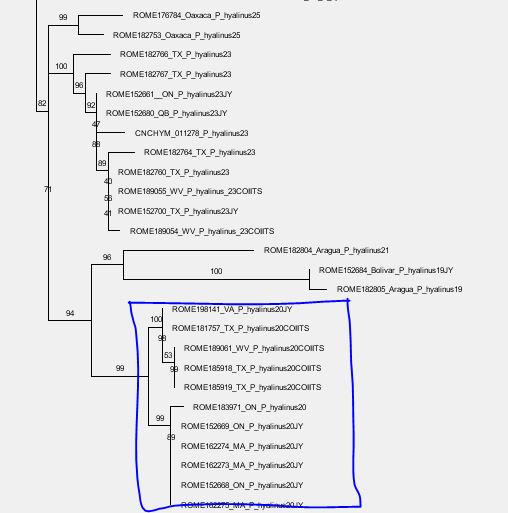
  • The next deeper branch, albeit being very prominent, has a BS = 45. Long branches + low BS support are usually related to strongly tree-incompatible signal: we use a tree for data that is not the product of dichotomous evolution. For instance, if you add a chimeric sequence C of two non-sister lineages A and B as "donors", which is 50% A and 50% B, the tree will place it as sister to either A or B with a BS < 50. Your tree may show you BS = 45 for C sister to A, but the BS sample may have equally as much topologies with C sister to B (BS ~ 45). Any mutation patterns shared with the respective other, the rejected sister but donor, conflicting with the tree's branching pattern will inflate the branch leading to C. The same applies if C is a natural recombinant (e.g. virus data, certain fungi) or hybrid of A and B (higher organisms). On the other hand, a low and deep (tree-root proximal) BS support may simply be a long-branching artefact/signal issue because (a) too distant outgroup(s) were used that the tree has to put somewhere but don't really fit anywhere.
  • The sister lineage (assuming your tree has the evolutionary correct root) of the ROME species is very distant and (from the screenshots) much more diverse from the two ROME clades. This is a tree topology that may be highly biased by sampling bias. Either because you didn't capture the phylogenetically closer groups of the ROMEs or because they cannot be captured because they are long extinct/ ROMEs split from the rest much earlier than the rest diverged. In such a case the lack of character support for the all-ROME branch indicates that the ROMEs are just relicts of the first radiation which may be monophyletic (sister lineages) or paraphyletic, i.e. independently derived from the last common ancestor of the entire subtree (ROME + long-rooting sister).
Thus, several general tips, when you're uncertain about topological aspects of your tree:
  1. Never only look at the (outgroup-)rooted tree but always also at the actually inferred unrooted tree.
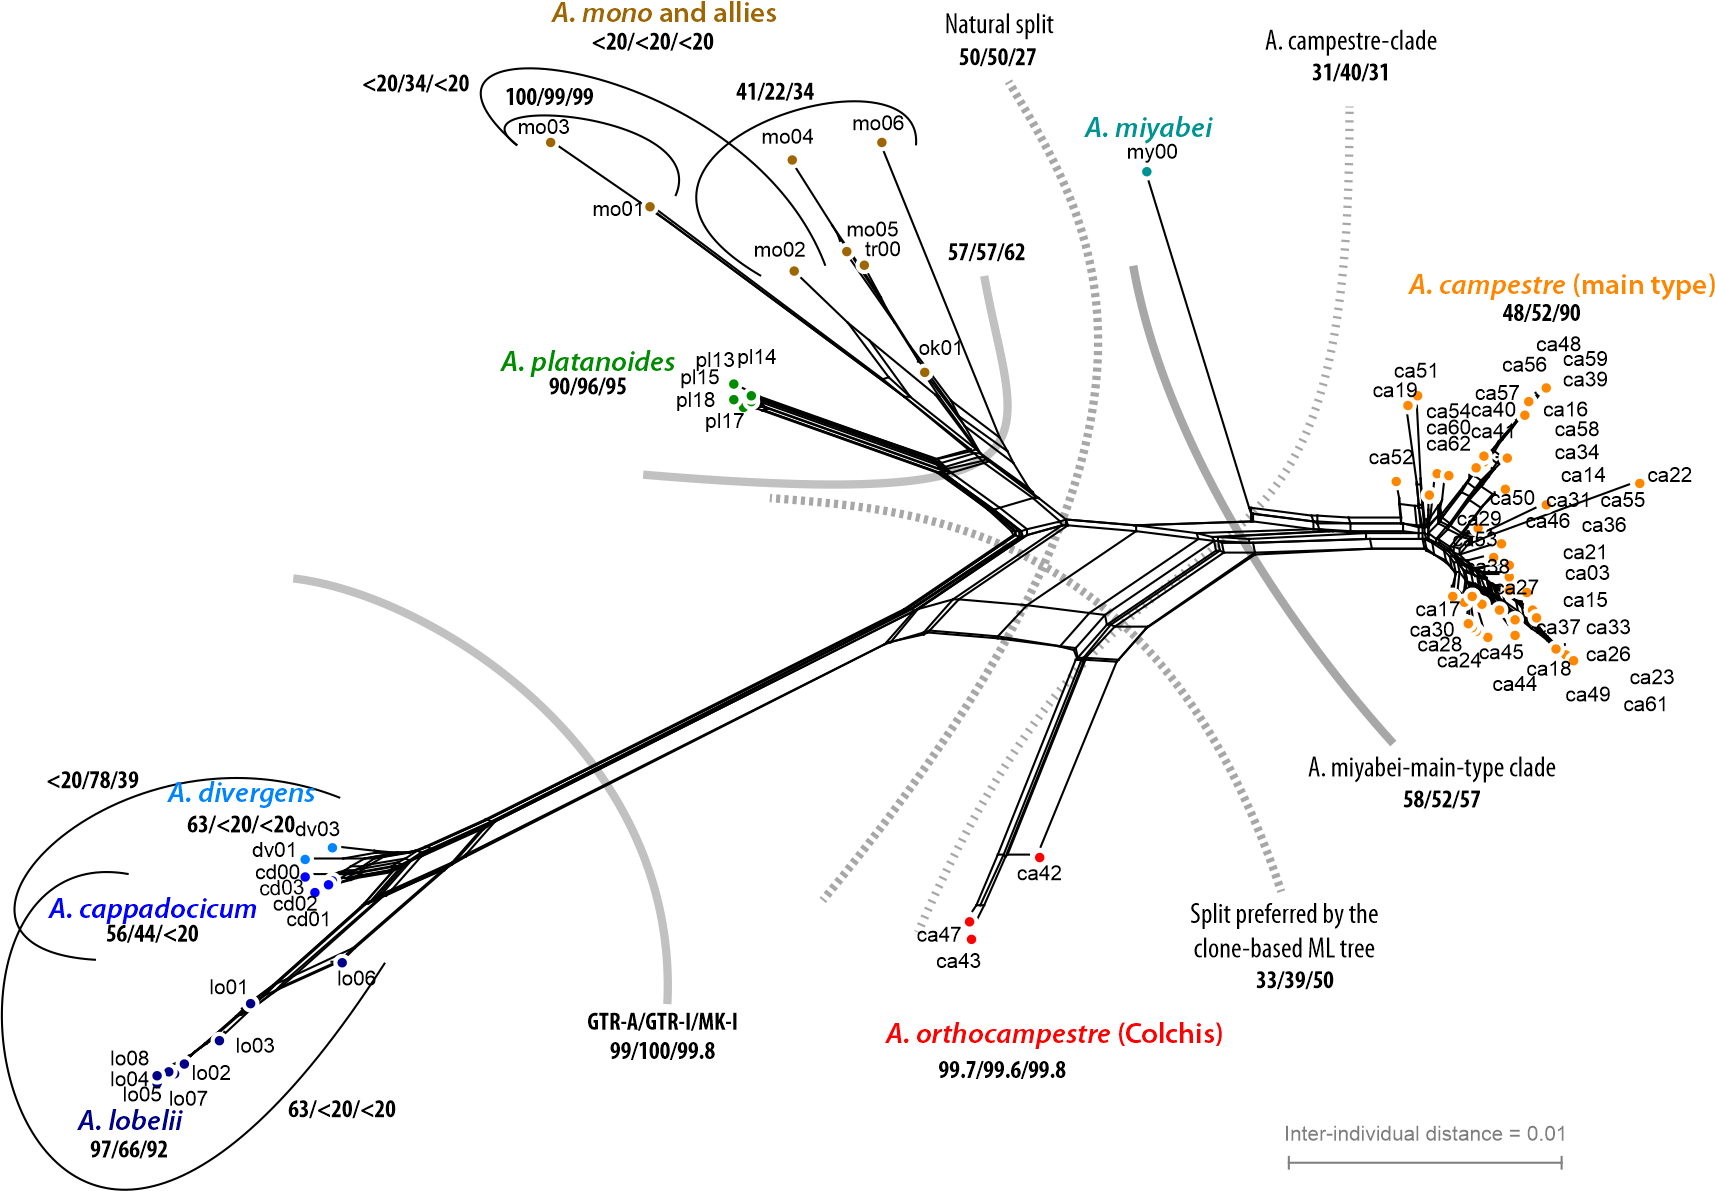
  2. Check the absolute similarity, the genetic coherence of your clades/putative species: either by phylogeny-sorted (using the inferred tree topology) heat-map or map the clades and eventual ambiguous ML-BS support on a neighbour-net, which is a planar (2-dimensional vs. 1 dimension we model in a tree) distance-based, very quick-to-infer (meta-)phylogenetic network. A further option for easy visualisation of overall diversity to compare with the inferred tree may be phytools new phylogenetic PCoA.
  3. If you have ambiguous support, use RAxML's bootstrap sample to generate what we called "bootstrap consensus networks". In contrast to a consensus tree, which only mask intra-analysis, intra-data conflict by collapsing non-trivial branches, a consensus network visualises competing topologies.
Basic network and tree-network-information-transfer capability has been implemented in phangorn library for R:

Schliep K, Potts AJ, Morrison DA, Grimm GW. 2017. Intertwining phylogenetic trees and networks. Methods in Ecology and Evolution 8:1212–1220. http://onlinelibrary.wiley.com/doi/10.1111/2041-210X.12760/full

For real world applications dealing with split BS support and topological ambiguity focussing at evolution's coal face (the formation and interaction of species), see the references and the various papers we wrote (relying on RAxML since 2005)


Here's a picture as an appetiser of the core graphic we used to define a new cryptic species of maples (common northern hemispheric actual trees; Acer orthocampestre) using a species-diagnostic nuclear genetic but multi-copy region: the graph is a neighbour-net based on pairwise inter-individual 'phylogenetic Bray-Curtis' distance, the values are bootstrap support established with RAxML using three different flavours of ML for data with intra-individual site polymorphism (cf. Potts et al. 2014, Syst. Biol., https://academic.oup.com/sysbio/article/63/1/1/1687378). For more background see the related post on my Res.I.P blog.

AcerAorthocampestreGrmmDnk14.png

jj biodiversity

unread,
Jun 20, 2022, 11:16:30 PM6/20/22
to raxml
Hello Grimm,

Thank you kindly again for your inputs. I had to mull over this for quite some time, and it was very educational!

The tree is made with single gene, COI. As you say, the sister relationship between ROMEs and the long branch taxa could be due to lack of taxon sampling as this group is rather speciose.. My initial thought however was potential homoplasy shared between ROMEs and long branch taxa from saturation in COI. 

I also have ITS2, in which ROMEhyalinus20 are grouped as sister of another species (hyalinus23), which makes more sense morphology-wise. Interestingly, they show less intraspecific variation than in COI. I'm unsure of the reasoning behind this discordance, but now I feel more confident that the odd monophyly in COI likely reflects true monophyly.
ITS2 (2).JPG

I noticed that you also used ITS2 previously. Have you ever dealt with ITS2 indels in your analyses? I have similar "monophyletic problem" with ITS2: hyalinus32 grouped together with BS=78. I believe this is due to unique insertion in hyalinus32, which I didn't code separately for ML.  

Snippy2 (1).JPGunnamed.jpg  32.PNG


Best regards,
Jeong

Grimm

unread,
Jun 21, 2022, 4:08:16 AM6/21/22
to raxml
Hi Jeong,

this sounds that you're probably too close to the speciation horizont to rely solely on phylogenetic tree inference.

3rd codon saturation in mitochondrial genes: To test for the topological effect of potential saturation just re-run the inference excluding the third-codon position and, as cross-check, run an analysis only on the 3rd codon position. Tangle the two trees (e.g. with Dendroscope) or compare them using weighted Robinson-Foulds distances: if their topologies are very different, the signal in either the 1st and 2nd or the 3rd codon position is severely biased. In plants, for instance, mitochondrial genes are utterly useless at the intra-family level: they mostly show mutations at the 3rd codon position, but even if a test for saturation fails, they are not phylogenetically sorted along the species/mothers tree at all.
To make a call, the ITS2 data can be helpful.

The ITS2  underlies fundamentally different evolutionary constraints than mitochondrial genes. There are two antagonistic processed shaping its sequences:
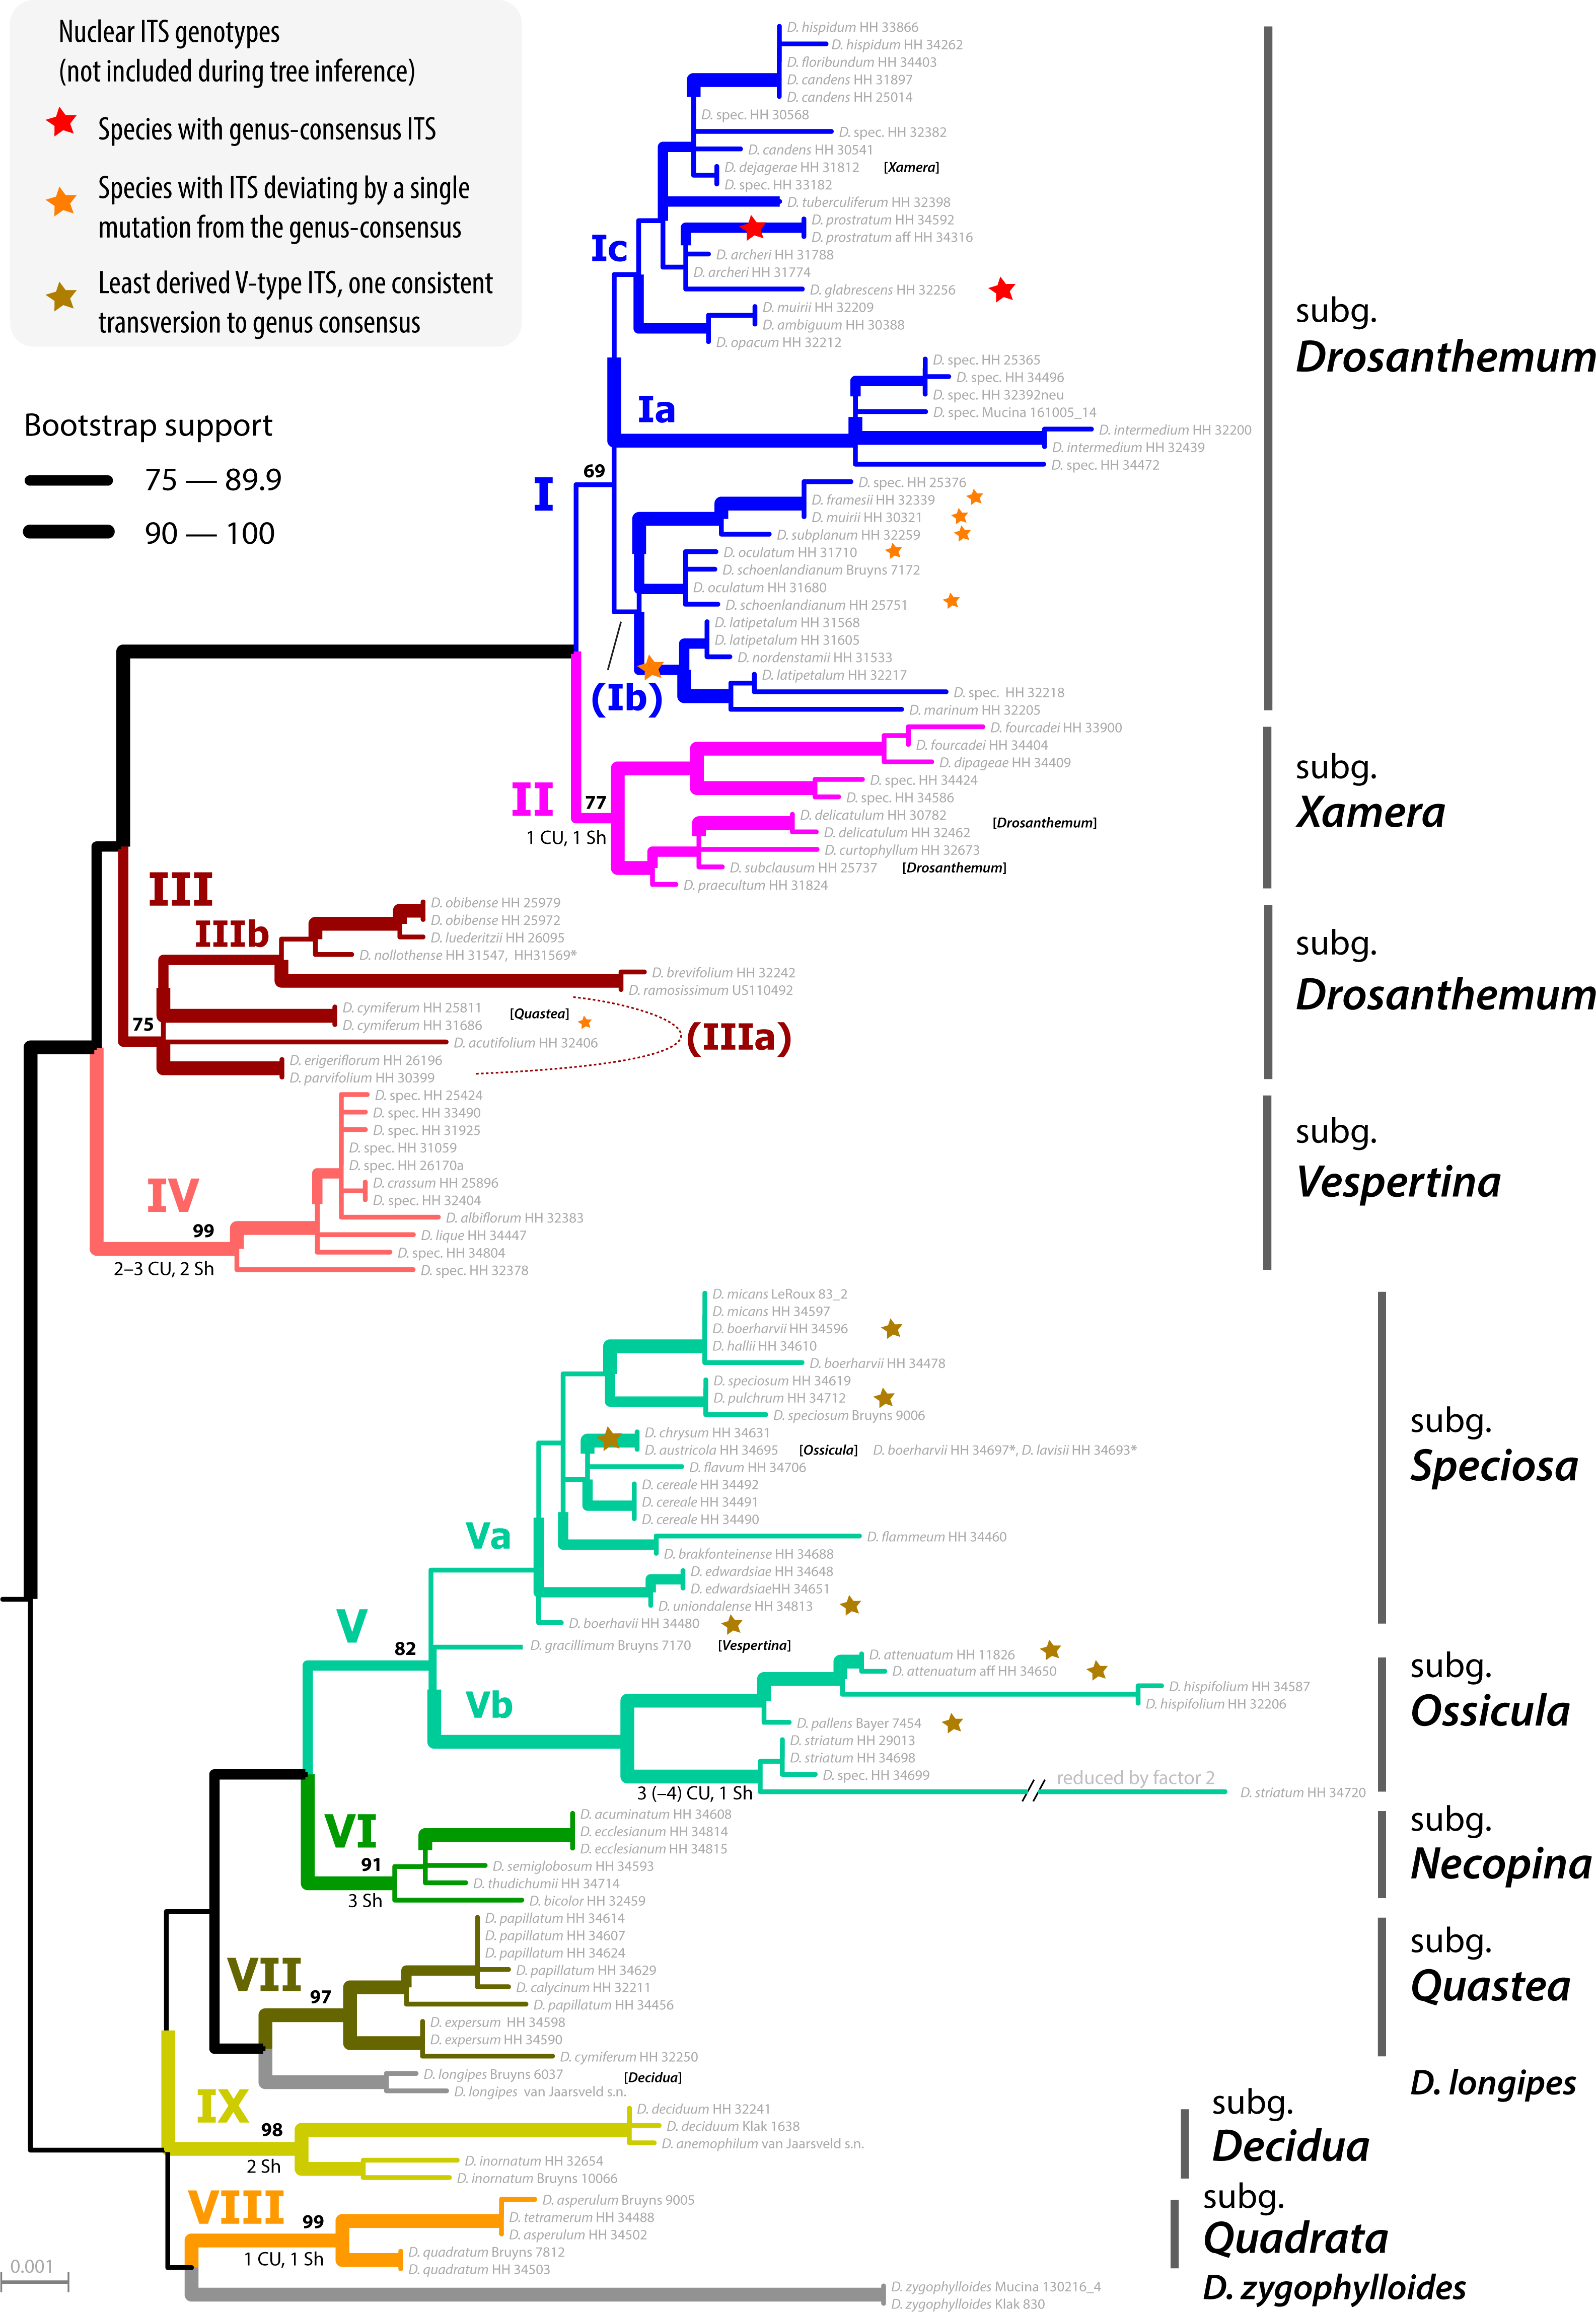
  • Being a part of the nuclear-encoded 35S (or 45S) rDNA cistron arrays, they are inherited from both parents. Since these arrays comprise extremely conserved sequence bits (and hundreds if not thousands of them), they are prone to crossing over, so a F1-heterozygote can pass on its paternal, maternal but also recombinant nrDNA arrays. In plants that lack selective fertilisation barriers, especially the wind-pollinated ones, this leads to puzzling intragenomic variation. If you do a direct classic Sange sequencing or NGS like genome skimming you end up with a lot of ambiguous base calls in what is effectively a ITS(2) consensus sequence.
  • On the other hand concerted evolution homogenises the arrays, and across the genomes; and this process adds to inbreeding homogenisation effects due to selective fertilisation (e.g. by active choosing of the sex partner, e.g. in birds due to particular courting behaviour). I have not looked at a lot of animal ITS data sets, but this seems to be more or less the rule in most animals. Your ITS(2) sequences are free of ambiguous bases.
ITS2 indels: single-nt insertions are quite common and sometimes really specific. If the rest of the alignment looks like this (few SNPs, no prominent length-polymorphism), you can just run a haplotype network treated gaps as 5th base to get an idea about the ITS2 differentiation and main genotypes/ genetic lineages.

cox1 diversity > ITS2: This seems to be counter-intuitive because the one is a coding gene but the other isn't. But 3rd codons in mitochondrial genes are oddly divergent and easily saturated, and ITS2 can be oddly low-divergent (in contrast to ITS1, it's not a intergenic spacer but evolved from a variable stem-loop region in the original large subunit ribosomal RNA gene). Third-codon position saturation in mitochondrial genes like cox1 indeed inflate branch-lengths, eventually leading to LBA. On the other hand, your ITS2 tree has very short branches. While being a nuisance for tree inference (too little signal), it's an asset to cross-check the cox1 data:
  • If the 1st+2nd codon-based cox1 tree congruent with the ITS2 tree (or differentiation pattern), the 3rd codon position is biased by saturation effects.
  • If the 3rd codon-based cox1 tree is congruent with the ITS2 tree (or differentiation pattern), the 1st+2nd codon position do not have enough signal to resolve these deep relationships.
I wrote "tree (or differentiation pattern)" because of the short branches and very flat terminal subtrees in the ITS2 tree(s): the signal in the ITS2 may not have the amplitude needed for probabilistic tree inference, this looks like parsimony haplotype network level differentiation.

Where to go from here? I would first run a haplotype network on the ITS2 data (median-network, reduced median or statistical parsimony) to identify the main ITS2 genotypes in your data sample. Then select one placeholder per main ITS2 genotype, only individuals for which you also have cox1 data, to put together a (much) reduced but representative tip set with no missing data for either marker. Maybe try the same with 1st and 2nd codon position of cox1.

Use that set to run the comparative tree inferences: 1st+2nd codon cox1 vs 3rd codon cox1 vs ITS2. By tangling the resultant trees against each other pairwise (Dendroscope) or overlaying them (strict consensus network) and/or establishing the weighted Robinson-Foulds distances, do an all vs. all AU-test (or SH-test, implemented in classic RAxML), you can assess whether there is any significant topological conflict in the used data.

If there's no significant conflict, you just combine all data to run an all-inclusive tree. If product of the same species tree, the low-diverged partitions will sort out the deep splits, and the 3rd codon cox1 resolve the tips. The branch-length and branching pattern will tell you how good of a species the ROME populations are (the shared ITS2 genotype may just be ancestral-shared, i.e. a genetic "symplesiomorphy").

If only two fit (ITS2 + cox1 partition), drop the one (the other cox1 partition) that doesn't, for the combined tree (but keep e.g. a tanglegram showing the conflict as supplement). If you can't decide, just discuss the two options. Regarding species identification, it hardly matters where the species is placed in either tree, as long as it is cleary distinct, forming it's own exclusive subtree in both of them.

If the intra-clade divergence is too low for ML tree-inference of the whole tip set in e.g. co-informative 1st+2nd cox1 and ITS2, you just take the tip-reduced tree as your phylogenetic backbone (if their differentiation is too low, you won't find a significant conflict: the tree may look different but the cox1 3rd codon topology would not be rejected on either 1st-2nd or ITS2 data matrix). The cox1 1st+2nd codon pos. and ITS2 networks can be used to identify the major genotypes of all samples; and the 3rd codon (assuming it's the most divergent partition) to diagnose the actual species (e.g. via PTP, GMYC, NHSC etc.)
 
One could even just visually map them on the all-tip cox1 3rd position tree, if it reasonably agrees with the (combined) phylogenetic backbone tree. Which directly gives you an idea about ILS (ITS2 genotypes shared across non-sister cox1 lineages). Here's an example from our plant research: low-divergent ITS (too young speciation) mapped on the plastid (maternal) tree (insect-pollinated, speciose and currently niching genus of southern Africa).

The stars give the tips still showing the genus-ancestral ITS genotype, the "1 CU, 1 Sh" (CU = plastid clade-unique: genetic "synapomorphies"; Sh = shared across plastid clades: typically genetic "homoiologies": convergently evolved but representing a parallelism rather than random homoplasy) at branches (plastid) lineage-conserved ITS mutations.
While an ITS tree would look superfically very different from the plastid tree, by mapping the notably few ITS mutation patterns on the plastid tree, we can see it can all be explained by low-divergent data incompletely sorted on essentially the same evolutionary tree (it's plants, so there will be reticulation towards the tips, too, but one would need a much more informative nuclear marker to test this).

fig-2-full.png

jj biodiversity

unread,
Aug 6, 2022, 1:23:56 PM8/6/22
to ra...@googlegroups.com
Hello Grimm,
Apologies for the late reply. Thank you very much again for your informative inputs, and reference to your paper. 
My speculation also is that I'm dealing with recently diverged species, making species delimitation even more convoluting! 

I made a tanglegram which showed both agreements and disagreements between the COI and ITS2 trees. I plan to analyze them both separately and combined.

I also tried out making the two trees with 1+2 and the third codon, and found:
- 1+2 codons aren't informative in both shallow and deep relationships. 
- 3rd codon tree is closer to ITS2. But interestingly, many more species in addition to the original problematic group (hyalinus 20) are now non-monophyletic compared to making a tree with COI as a single partition. This also happens when I Include all codons but apply separate substitution models.

So it seems that third codon saturation isn't an issue... 

I also did another analysis excluding the long-branch sister group (hyalinus 22), resulting in the problematic groups to be clearly monophyletic, although still showing two separate sub-lineages. Perhaps this is indeed a visualization issue as Alex pointed out.
with 22.JPG    
without22.JPG


Forgive me for going back to my original question: would it be correct/incorrect to say this group is recovered as monophyletic in the COI tree?

Regards,
Jeong


Virus-free. www.avast.com

You received this message because you are subscribed to a topic in the Google Groups "raxml" group.
To unsubscribe from this topic, visit https://groups.google.com/d/topic/raxml/uOuuXhVC9Q8/unsubscribe.
To unsubscribe from this group and all its topics, send an email to raxml+un...@googlegroups.com.
To view this discussion on the web visit https://groups.google.com/d/msgid/raxml/55fea670-98dc-4d9f-a418-e55f22f1606dn%40googlegroups.com.

Virus-free. www.avast.com

Grimm

unread,
Aug 8, 2022, 3:37:06 AM8/8/22
to raxml
Hi Jeong,

The fact that the 1st and 2nd on their own are largely uninformative, we can deduce it's a flat, young divergence, so saturation is indeed unlikely for the 3rd codon position.

Re: Monophyly. In a general sense (common origin), definitely. And probably in a strict sense, too (inclusive common origin). Although the latter technically cannot be applied here, because we are looking at data of the same species (P. hyalinus), i.e. a population genetic not a phylogenetic dataset. Geographic or ecologically triggered differentiation patterns. So, I would not mention "phyly" at all in a paper on these data unless you want to refine the species concept and split hyalinus. Just use "common origin" and "(phylogenetic) lineage".

We can exclude reticulation as a (major) issue. That the 3rd codon-based tree further converges to the ITS tree is something you wouldn't find in a group where the mitochondrial and nuclear genomes had different evolutionary histories. Note also the branch-lengths distribution in both trees, in particular the terminal tips: long-branched cox1 tips are equally long-branched in the ITS tree. This indicates very stringent phylogenetic sorting of the used gene regions. Excluding reticulation is paramount, because reticulation always inflict branching artefacts. That's the first clue.

The second clue regarding the blues' common origin is the coherence and consistence of the grouping of the blues. They are phylogenetically (i.e. where they are placed in the inferred trees) and absolutely (probably, note branch-lengths of the according subgraphs; visually this is best-shown using neighbour-nets or phylogenetically sorted heat maps of pairwise distances) closer to each other in both datasets than to any of the included other tips/groups. This indicates that they form a group of interrelated tips going back to the same ancestral population (species). So, the lack of a prominent inclusive subtree root in the top-tree is no argument against the hypothesis of a monophyletic blue group (even in a strict, Hennigian sense).

The third clue is the phylogenetic neighbourhood of the blues. In both trees we have the "...Bolivar..."-containing clade as one subtree, and all the rest in the other. Both splits (Bolivar-group vs. blue + rest; rest-group vs. blue + Bolivar-group) have near-unambiguous support. Hence, the BS = 87 for the non-visible clade of both blue groups in the (top) cox1 tree: the blue group bipartition is apparently found in 87% of the BS pseudoreplicate trees. It only has little direct character support, hence, the according branch has near-zero length. But there may be a basepair or two that differ them from all others also in cox1, compatible with the sequence patterns supporting the Bolivar-group and the rest-group. Again, the congruence to the ITS tree cannot be underestimated: there we have a 100% corresponding clade with not only high branch but also character support but also the same two subclades.

Overall, the evolutionary scenario to explain these trees is that the blues are monophyletic (probably in a strict sense, Hennig's monophyly, what Ashlock re-termed holophyly) and that the lack of a prominent root in the cox1 tree is simply due to missing signal amplitude: the blue's shared ancestor cox1 just didn't accumulate as much lineage-specific mutations as its ITS.

From a haplotype/genetic evolutionary perspective, the blue cox1 haplotypes are probably most similar to the all-ancestral haplotype (i.e. most primitive), while their ITS are as derived/evolved (or more) than that of the other tips.

From an applied species viewpoint, if you want to split the P. hyalinus, the blues may well qualify as one species, being genetically distinct and coherent in both the nuclear and mitochondrial marker, in addition to the Bolivar- and rest-groups as the other two species. Species or not, it's three, today isolated, evolutionary lineages within the hyalinus-complex.

Cheers, Guido

PS Any incongruence towards the tips (e.g. in the larger rest-group) may well be just too-little-signal-issues and common incomplete sorting at population-level. Avoid getting lost in describing them all, focus on prominent incongruences in case there are any, and otherwise on the strongly congruent patterns: the three coherent subtrees, with the blues as a new (I guess) distinct lineage.

For the tips, to structure them more and get a grip on them, haplotype networks may be an option here, too. You reduce the tip set to the according subtree and run each on its own to reduce noise because of convergent mutations between the main lineages (the blues, the Bolivar-lineage, the rest-lineage)

jj biodiversity

unread,
Aug 27, 2022, 3:48:13 PM8/27/22
to raxml
Hello Guido,

After comparing with the known glacial refugia and the distribution of two COI clusters, I've recently made the conclusion that this split in COI populations may be due to accrued differentiations from the isolations during the last glacial period. The secondary contact in post-glacial period also explains entirely homogenized ITS2 between the populations.

With this, and along with your kind explanations, I am now confident that blue indeed represents a unique lineage.

Thank you so much for your help!

Regards,
Jeong

Grimm

unread,
Aug 29, 2022, 3:37:47 AM8/29/22
to raxml
Hi Jeong,

just a little thing you may want to check (if possible with your data) regarding your conclusion: can you be certain that the ITS2 split is older than the cox1 split? Little idea about faunal patterns but in plants we have either the one or the other.

We often do not (or cannot) dwelve into it, but there are two possible explanations for a fit with known glacial refugia.
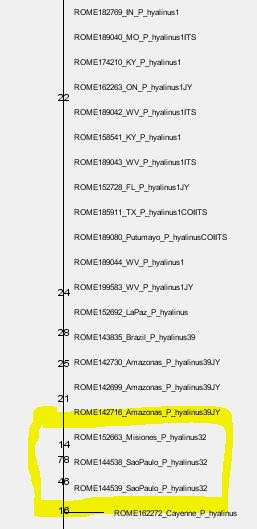
  1. Standard explanation: they got isolated during the LGM (or an earlier stage), i.e. the maternal differentiation (here: cox1 pattern) happened after the (starting) speciation events (here: ITS2 patterns): few mothers survived, and their slightly different signatures (within-species variation) got established in the according nearby populations.
  2. Often left-aside alternative: an already mito-polymorphic ancestral species (e.g. a widespread species starting to speciate and bud, with marginal, small populations becoming increasing isolated: differential genetic drift across the total range of the species) was sorted during the Ice Age bottlenecks, with one maternal signature surviving in the one, and the other in another refugium. That is the maternal (cox1) pattern pre-dates the ITS2 differentiation/ongoing speciation.
In the extratropical tree genera I worked with, phylogenomics have finally demonstrated what we long pondered: all those nice Pleistocene refugia fits observed for any species studied in detail using chloroplast data (which is often maternally inherited) have little to do with LGM (or earlier) relictisation and subsequent genetic drift between the refugia: it's all ancestral, (much-)older plastome polymorphism getting sorted during the Pleistocene.

Close to the speciation horizont, dating is nigh-difficult. One can always try of course: e.g. using the same good root age constraint and then see whether the cox1 splits predate the ITS2 or vice versa. Also for this particular question, alternative insights can be obtained by establishing explicit ancestor-descendant relationships:
  • Do the cox1 variants of an ITS2 lineage go back to a potentially shared by that ITS2 lineage common cox1 ancestor? This would support scenario 1: Homogenised ancestral species geographically drifting during the Ice Age retractions.
  • Or are cox1 variants shared by different, phylogenetically distant ITS2 lineages? This would support scenario 2. Non-homoginised ancestral species being sorted during the Ice Age bootlenecks.
Cheers Guido.

PS That's just advanced evolutionary thinking, a tip for going beyond the usual. Far the most reviewers would never think of asking for it.


Reply all
Reply to author
Forward
0 new messages