RabbitMQ 3.6.12 memory usage
130 views
Skip to first unread message

Dmitry Andrianov
Sep 16, 2017, 7:42:55 PM9/16/17
to rabbitm...@googlegroups.com
Hello.
We are running various experiments with the latest RabbitMQ and collecting metrics to see how it behaves over time.
One of the tests suggests that there can be some constant growth in reported memory usage.
(Or it can be that I completely misunderstand how RabbitMQ/Erlang uses memory)
The load-test setup:
* Single RabbitMQ 3.6.12 broker (Erlang 19) on AWS EC2 node
* several load-generating nodes establishing persistent AMQP over TLS connections.
* there is a single consumer that gets messages from the broker and basically discards them
Together all the load-generators keep 3600 connections established and combined publish rate is about 400 messages per second.
This is way beyond a node (c4.2xlarge I believe) can handle.
The test is running for more than 24 hours now with all "input" parameters being steady.
(All the charts below should have the same time scale going from Friday 15, 16:00 to Saturday 16, 23:00)
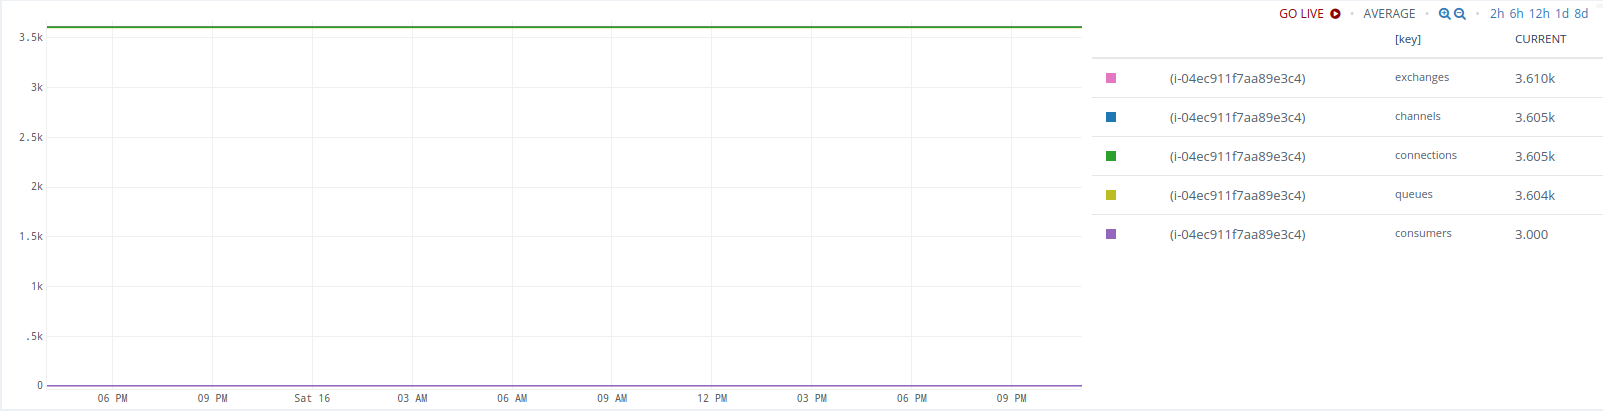
overview object_totals:
overview message_details:

Now, what observations caused concerns (and this email):
1. the mem_used metric keeps growing even after all these hours - the growth is not too large now but the trend is clearly visible.
It is still under mem_limit so I am not sure if this is a kind of expected behavior or what it going to happen when limit is reached.

2. in an attempt to explain that growth, we collected memory distribution metrics (by passing ?memory=true to the /node/xxx REST API)
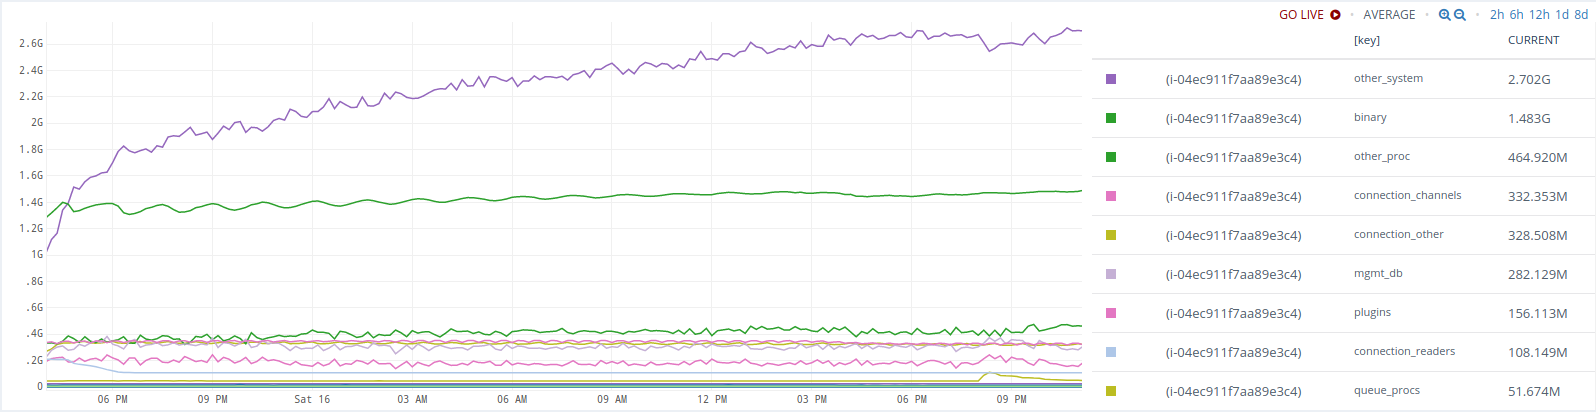
There is some (barely visible) upward trend in memory.binary
And a better visible trend in memory.other_system
3. we added binary=true to the /node/xxx REST API to get more insight into that binary thing

So binary.connection_readers was growing rather rapidly in the very beginning, then it hit 100Mb and jumped down where it stayed flat for the rest of the test. Not sure what the initial quick growth means really.
And binary.connection_channels kept growing since the start of test and until about 140Mb. Then fallen and then it is growing again (even beyond 140 Mb)
To be honest, I know very little on how Erlang works. Maybe some sort of a garbage collection only kicks in at a certain point and all these charts represent an expected behaviour.
It just feels a bit strange that a process keeps growing in memory (even slowly) when there aren't any messages to queue etc.
Also, there is just too little info on what memory.other_system really means.
The doc ( https://www.rabbitmq.com/memory-use.html ) says
but that does not really explain much.
4. Other observations - the sum of binary.* is not the same as memory.binary - is that expected? I could not find explanation what these metrics really mean.

If someone could shed some light on what I am observing on these charts, that would help a lot.
If there are some other metrics that need to be collected from a [still running] RabbitMQ process - I can do that.
Many thanks
Dmitry
We are running various experiments with the latest RabbitMQ and collecting metrics to see how it behaves over time.
One of the tests suggests that there can be some constant growth in reported memory usage.
(Or it can be that I completely misunderstand how RabbitMQ/Erlang uses memory)
The load-test setup:
* Single RabbitMQ 3.6.12 broker (Erlang 19) on AWS EC2 node
* several load-generating nodes establishing persistent AMQP over TLS connections.
* there is a single consumer that gets messages from the broker and basically discards them
Together all the load-generators keep 3600 connections established and combined publish rate is about 400 messages per second.
This is way beyond a node (c4.2xlarge I believe) can handle.
The test is running for more than 24 hours now with all "input" parameters being steady.
(All the charts below should have the same time scale going from Friday 15, 16:00 to Saturday 16, 23:00)
overview object_totals:
overview message_details:
Now, what observations caused concerns (and this email):
1. the mem_used metric keeps growing even after all these hours - the growth is not too large now but the trend is clearly visible.
It is still under mem_limit so I am not sure if this is a kind of expected behavior or what it going to happen when limit is reached.
2. in an attempt to explain that growth, we collected memory distribution metrics (by passing ?memory=true to the /node/xxx REST API)
There is some (barely visible) upward trend in memory.binary
And a better visible trend in memory.other_system
3. we added binary=true to the /node/xxx REST API to get more insight into that binary thing
So binary.connection_readers was growing rather rapidly in the very beginning, then it hit 100Mb and jumped down where it stayed flat for the rest of the test. Not sure what the initial quick growth means really.
And binary.connection_channels kept growing since the start of test and until about 140Mb. Then fallen and then it is growing again (even beyond 140 Mb)
To be honest, I know very little on how Erlang works. Maybe some sort of a garbage collection only kicks in at a certain point and all these charts represent an expected behaviour.
It just feels a bit strange that a process keeps growing in memory (even slowly) when there aren't any messages to queue etc.
Also, there is just too little info on what memory.other_system really means.
The doc ( https://www.rabbitmq.com/memory-use.html ) says
Other system memory
Other memory used by Erlang. One contributor to this value is the number of available file descriptors.
but that does not really explain much.
4. Other observations - the sum of binary.* is not the same as memory.binary - is that expected? I could not find explanation what these metrics really mean.
If someone could shed some light on what I am observing on these charts, that would help a lot.
If there are some other metrics that need to be collected from a [still running] RabbitMQ process - I can do that.
Many thanks
Dmitry
hivehome.com

Hive | London | Cambridge | Houston | Toronto
The information contained in or attached to this email is confidential and intended only for the use of the individual(s) to which it is addressed. It may contain information which is confidential and/or covered by legal professional or other privilege. The views expressed in this email are not necessarily the views of Centrica plc, and the company, its directors, officers or employees make no representation or accept any liability for their accuracy or completeness unless expressly stated to the contrary.
Centrica Connected Home Limited (company no: 5782908), registered in England and Wales with its registered office at Millstream, Maidenhead Road, Windsor, Berkshire SL4 5GD.
Michael Klishin
Sep 16, 2017, 11:25:09 PM9/16/17
to rabbitm...@googlegroups.com
The charts suggest that memory usage plateaus.
"That binary thing" is usually message payloads. You can see binary heap breakdown
on the node page in the management UI. rabbitmq-top can be used to see what individual
processes use most RAM or CPU resources. You also can see message location
(RAM, disk, transient but paged out) on individual queue pages.
Without having application activity metrics that can be correlated to these values I don't
know what conclusions can be drawn from that.
If your workload involves thousands of connections, it may make sense to reduce
TCP buffer size (or at last consider it as it certainly has a downside mentioned in the docs)
and make sure heartbeat and kernel TCP settings make sure connections of "gone" clients
are reaped in a timely manner:
--
You received this message because you are subscribed to the Google Groups "rabbitmq-users" group.
To unsubscribe from this group and stop receiving emails from it, send an email to rabbitmq-users+unsubscribe@googlegroups.com.
To post to this group, send email to rabbitmq-users@googlegroups.com.
For more options, visit https://groups.google.com/d/optout.
MK
Staff Software Engineer, Pivotal/RabbitMQ
Michael Klishin
Sep 16, 2017, 11:32:23 PM9/16/17
to rabbitm...@googlegroups.com
By the way, we have stared a monitoring guide [1] but your team seems to already
know everything we have there so far :)
Covering application behaviour metrics would make it actually useful
but it's a pretty wide topic and not all client libraries collect metrics, different communities
have different cultures when it comes to metrics collection, etc. Several open ended questions to
work through first.
To post to this group, send email to rabbitm...@googlegroups.com.
For more options, visit https://groups.google.com/d/optout.
--MKStaff Software Engineer, Pivotal/RabbitMQ
Reply all
Reply to author
Forward
0 new messages