grid cells occupied by data
22 views
Skip to first unread message

Boris Espinasse
Aug 11, 2022, 5:50:26 AM8/11/22
to R-inla discussion group
Hello,
I was wondering if there is a way to know ho much of the mesh nodes are occupied by data?
thanks
Boris

Finn Lindgren
Aug 11, 2022, 6:27:46 AM8/11/22
to Boris Espinasse, R-inla discussion group
Hi,
I'm guessing you're referring to inla.mesh.2d meshes, with geo-located
observations?
The "amount of data at/near each mesh vertex/node can be obtained from
the mesh-to-observation A-matrix:
Aobs <- inla.spde.make.A(mesh, loc = locations)
data_per_node <- colSums(Aobs)
An observation exactly at a node will contribute 1 to the
corresponding data_per_node value.
An observation exactly at the centre of a triangle will contribute 1/3
to data_per_node for each of the three triangle vertices.
The total number of observations is sum(data_per_node).
Not sure if that's what you were looking for, but it provides a simple
way of counting "data per node".
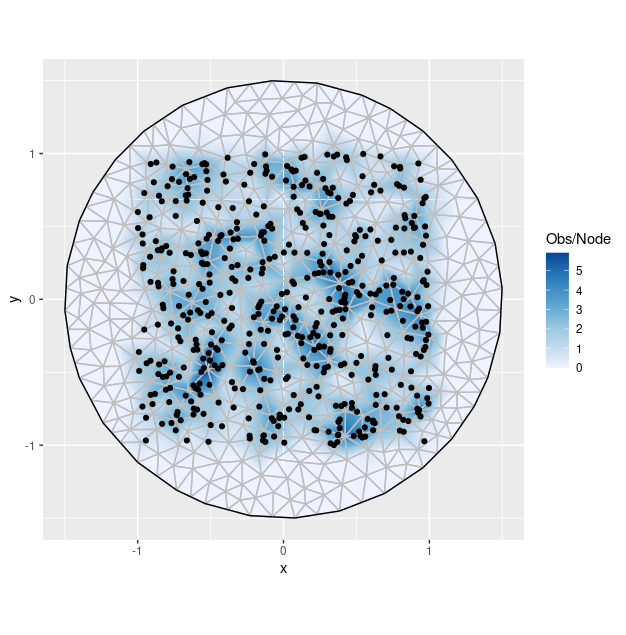
Example that generates the attached figure:
library(INLA)
# For plotting:
library(inlabru)
library(ggplot2)
# A circular mesh:
bnd <- inla.nonconvex.hull(cbind(0,0), convex = 1.5)
mesh <- inla.mesh.2d(boundary = list(bnd), max.edge = 0.2)
# Random data locations, mapped to the mesh:
loc <- matrix(runif(1000) * 2 - 1, 500, 2)
Aobs <- inla.spde.make.A(mesh, loc)
data_per_node <- colSums(Aobs)
sum(data_per_node) # = nrow(loc)
# Plot the result
ggplot() +
gg(mesh) +
gg(SpatialPoints(loc))
ggplot() +
gg(mesh, colour = data_per_node) +
gg(mesh) +
gg(SpatialPoints(loc)) +
coord_equal() +
scale_fill_distiller("seq", "Blues", direction = +1,
breaks = seq(0, ceiling(max(data_per_node)), 1),
labels = seq(0, ceiling(max(data_per_node)), 1)) +
guides(fill = guide_colourbar(title = "Obs/Node"))
Finn
> --
> You received this message because you are subscribed to the Google Groups "R-inla discussion group" group.
> To unsubscribe from this group and stop receiving emails from it, send an email to r-inla-discussion...@googlegroups.com.
> To view this discussion on the web, visit https://groups.google.com/d/msgid/r-inla-discussion-group/1c0834e7-742f-4a0b-966b-d41fb2b0b0bcn%40googlegroups.com.
--
Finn Lindgren
email: finn.l...@gmail.com
I'm guessing you're referring to inla.mesh.2d meshes, with geo-located
observations?
The "amount of data at/near each mesh vertex/node can be obtained from
the mesh-to-observation A-matrix:
Aobs <- inla.spde.make.A(mesh, loc = locations)
data_per_node <- colSums(Aobs)
An observation exactly at a node will contribute 1 to the
corresponding data_per_node value.
An observation exactly at the centre of a triangle will contribute 1/3
to data_per_node for each of the three triangle vertices.
The total number of observations is sum(data_per_node).
Not sure if that's what you were looking for, but it provides a simple
way of counting "data per node".
Example that generates the attached figure:
library(INLA)
# For plotting:
library(inlabru)
library(ggplot2)
# A circular mesh:
bnd <- inla.nonconvex.hull(cbind(0,0), convex = 1.5)
mesh <- inla.mesh.2d(boundary = list(bnd), max.edge = 0.2)
# Random data locations, mapped to the mesh:
loc <- matrix(runif(1000) * 2 - 1, 500, 2)
Aobs <- inla.spde.make.A(mesh, loc)
data_per_node <- colSums(Aobs)
sum(data_per_node) # = nrow(loc)
# Plot the result
ggplot() +
gg(mesh) +
gg(SpatialPoints(loc))
ggplot() +
gg(mesh, colour = data_per_node) +
gg(mesh) +
gg(SpatialPoints(loc)) +
coord_equal() +
scale_fill_distiller("seq", "Blues", direction = +1,
breaks = seq(0, ceiling(max(data_per_node)), 1),
labels = seq(0, ceiling(max(data_per_node)), 1)) +
guides(fill = guide_colourbar(title = "Obs/Node"))
Finn
> You received this message because you are subscribed to the Google Groups "R-inla discussion group" group.
> To unsubscribe from this group and stop receiving emails from it, send an email to r-inla-discussion...@googlegroups.com.
> To view this discussion on the web, visit https://groups.google.com/d/msgid/r-inla-discussion-group/1c0834e7-742f-4a0b-966b-d41fb2b0b0bcn%40googlegroups.com.
--
Finn Lindgren
email: finn.l...@gmail.com
Finn Lindgren
Aug 11, 2022, 6:42:00 AM8/11/22
to R-inla discussion group
For "number of observations per unit area", use the code below.
# Obs per area
va <- inla.mesh.fem(mesh)$va # Area per vertex
ggplot() +
gg(mesh, colour = data_per_node / va) +
labels = seq(0, ceiling(max(data_per_node / va)), 100)) +
guides(fill = guide_colourbar(title = "Obs/Area", ticks = FALSE))
# Obs per area
va <- inla.mesh.fem(mesh)$va # Area per vertex
ggplot() +
gg(mesh, colour = data_per_node / va) +
gg(mesh) +
gg(SpatialPoints(loc)) +
coord_equal() +
scale_fill_distiller("seq", "Blues", direction = +1,
breaks = seq(0, ceiling(max(data_per_node / va)), 100),
gg(SpatialPoints(loc)) +
coord_equal() +
scale_fill_distiller("seq", "Blues", direction = +1,
labels = seq(0, ceiling(max(data_per_node / va)), 100)) +
guides(fill = guide_colourbar(title = "Obs/Area", ticks = FALSE))
Boris Espinasse
Aug 11, 2022, 6:45:04 AM8/11/22
to Finn Lindgren, R-inla discussion group
Hi Finn,
I was thinking that if two observational data have very similar geographical coordinates then they will end up in the same triangle / node ?
In my case I have 4317 nodes and 560 observations, so I assume ca 13% of the nodes have observations associated, but what if some of these observations are linked to the same node/ triangle, that would decrease this number?
Thanks
boris
Boris Espinasse
Aug 11, 2022, 6:51:13 AM8/11/22
to Boris Espinasse, Finn Lindgren, R-inla discussion group
I guess I just have to count the non zero values in data_per_node and I'll get my answer?
You received this message because you are subscribed to a topic in the Google Groups "R-inla discussion group" group.
To unsubscribe from this topic, visit https://groups.google.com/d/topic/r-inla-discussion-group/S0OP9duLGjs/unsubscribe.
To unsubscribe from this group and all its topics, send an email to r-inla-discussion...@googlegroups.com.
To view this discussion on the web, visit https://groups.google.com/d/msgid/r-inla-discussion-group/000901d8ad6f%24680d5930%2438280b90%24%40laposte.net.
Finn Lindgren
Aug 11, 2022, 6:51:30 AM8/11/22
to Boris Espinasse, R-inla discussion group
With the normal approach, each observation is linked to its own
location, and the corresponding field value is a weighted average of
the values at the triangle nodes.
So observations are only linked to a single node if they are exactly
at that node.
You can have multiple observations at the same location, whether
that's at a vertex or inside a triangle.
If you run the "obs/node" and "obs/area" code example, you'll see that
the number of observations per vertex is zero outside the square where
I simulated the observations, and ranges between 0 and 6 inside the
square.
The observations per area goes up above 300, even though there are 500
observations and the area is 4, so on average it would be 125
observations per unit are in the square (and less across the mesh as a
whole).
Perhaps I can give a more useful answer if I know why you are asking
the question?
Finn
Finn Lindgren
Aug 11, 2022, 6:52:45 AM8/11/22
to Boris Espinasse, R-inla discussion group
Yes, if you want to know how many nodes are _directly_ associated with
at least one observation, then sum(obs_per_node > 0) gives you that.
Finn
On Thu, 11 Aug 2022 at 11:51, 'Boris Espinasse' via R-inla discussion
> To view this discussion on the web, visit https://groups.google.com/d/msgid/r-inla-discussion-group/000a01d8ad70%2442905fd0%24c7b11f70%24%40laposte.net.
at least one observation, then sum(obs_per_node > 0) gives you that.
Finn
On Thu, 11 Aug 2022 at 11:51, 'Boris Espinasse' via R-inla discussion
Boris Espinasse
Aug 11, 2022, 6:56:51 AM8/11/22
to Finn Lindgren, R-inla discussion group
Yes, this is what I was looking for,
The question I got from one reviewer was 'what percentage of the study area is covered by observations? '
Thanks for you reactivity and patience
To view this discussion on the web, visit https://groups.google.com/d/msgid/r-inla-discussion-group/CAHC4gzbq%2BEvVek6aDUFPHnBSZs8zEj79yG-DyuN4n0Z6S8vkdw%40mail.gmail.com.
The question I got from one reviewer was 'what percentage of the study area is covered by observations? '
Thanks for you reactivity and patience
Finn Lindgren
Aug 11, 2022, 7:09:52 AM8/11/22
to Boris Espinasse, R-inla discussion group
Then the number of vertices associated with observations is the wrong
measure, as it's dependent on the mesh; it would change depending on
the mesh resolution, and in the limit be equal to the number of
observations. This means it would give different values depending on
the mesh details, even for meshes that give equivalent estimates.
Strictly speaking the reviewer's question isn't well defined, since
observation locations are points, and the study area is, well, an
_area_, so the percentage of the area covered by pointwise
observations is always _zero_.
More relevant measure is how many observations there are within the
distance given by the spatial correlation length, and how that varies
across space.
If the observations are evenly spread out you'll have a different kind
of information than if the observations are clustered together; in
clusters, you get more information, but in the gaps between them you
have no information.
In the EUSTACE project we tried to address this question by measuring
the "relative variance decrease"; if the model posterior variance is
sigma^2(s) and the data-conditional posterior variance is
sigma_post^2(s), then
the average of 1-\sigma_post^2(s)/\sigma^2(s) across the domain is a
measure the "information percentage"; where sigma_post is close to
sigma, the observations gave no information, and where it's close to
zero, they did give information. This number is linked to the
"observations within correlation length distance", but in terms of
information, not number of observations.
Finn
On Thu, 11 Aug 2022 at 11:56, 'Boris Espinasse' via R-inla discussion
> To view this discussion on the web, visit https://groups.google.com/d/msgid/r-inla-discussion-group/000b01d8ad71%240d02d9f0%2427088dd0%24%40laposte.net.
measure, as it's dependent on the mesh; it would change depending on
the mesh resolution, and in the limit be equal to the number of
observations. This means it would give different values depending on
the mesh details, even for meshes that give equivalent estimates.
Strictly speaking the reviewer's question isn't well defined, since
observation locations are points, and the study area is, well, an
_area_, so the percentage of the area covered by pointwise
observations is always _zero_.
More relevant measure is how many observations there are within the
distance given by the spatial correlation length, and how that varies
across space.
If the observations are evenly spread out you'll have a different kind
of information than if the observations are clustered together; in
clusters, you get more information, but in the gaps between them you
have no information.
In the EUSTACE project we tried to address this question by measuring
the "relative variance decrease"; if the model posterior variance is
sigma^2(s) and the data-conditional posterior variance is
sigma_post^2(s), then
the average of 1-\sigma_post^2(s)/\sigma^2(s) across the domain is a
measure the "information percentage"; where sigma_post is close to
sigma, the observations gave no information, and where it's close to
zero, they did give information. This number is linked to the
"observations within correlation length distance", but in terms of
information, not number of observations.
Finn
On Thu, 11 Aug 2022 at 11:56, 'Boris Espinasse' via R-inla discussion
Finn Lindgren
Aug 11, 2022, 7:13:28 AM8/11/22
to Boris Espinasse, R-inla discussion group
"The proportion of the study domain with at least one observation
within the correlation length distance" might be a crude approximation
of what the reviewer asks for.
There are likely sf and/or other packages that can help compute this,
but I'm not sure exactly how.
An approximation would be to build a new mesh for this computation
that has max.edge equal to the correlation length, and compute it from
the obs_per_node>0 values for that mesh.
Finn
Boris Espinasse
Aug 11, 2022, 8:40:52 AM8/11/22
to Finn Lindgren, R-inla discussion group
I think it was an innocent question, and the reviewer did not realize it could be technically difficult to answer this question accurately.
I'll probably stick to the number of nodes/triangles with at least one observation, stipulating that, as you mentioned, it is dependant on the mesh characteristics, but also that the area influenced by the observations depends on the spatial correlation length.
Thanks again
Boris
I'll probably stick to the number of nodes/triangles with at least one observation, stipulating that, as you mentioned, it is dependant on the mesh characteristics, but also that the area influenced by the observations depends on the spatial correlation length.
Thanks again
Boris
Finn Lindgren
Aug 11, 2022, 8:45:59 AM8/11/22
to Boris Espinasse, R-inla discussion group
The "observations per areal unit" is also easy to compute, so you
could give them that as well.
Finn
could give them that as well.
Finn
Finn Lindgren
Aug 11, 2022, 8:47:42 AM8/11/22
to Boris Espinasse, R-inla discussion group
"Zero" is a both easy and technically accurate answer to the question.
;) But the reviewer will hopefully be happier with a more thoughtful
reply, yes.
Finn
;) But the reviewer will hopefully be happier with a more thoughtful
reply, yes.
Finn
Reply all
Reply to author
Forward
0 new messages