Penalized splines using INLA (Canadian Age Income Data)
809 views
Skip to first unread message

Mahasen Dehideniya
Oct 2, 2014, 9:56:07 AM10/2/14
to r-inla-disc...@googlegroups.com
Hi all,
I'm new to INLA and trying to fit a penalized splines model of degree 2, to model Canadian Age Income Data as described in section 3 of Bayesian Analysis for Penalized Spline Regression Using WinBUGS by Ciprian M. Crainiceanu, David Ruppert and M.P. Wand.
I have create design matrices for fixed effects and random effects as described in the original reference. And I used age.income data set in SemiPar package
data(age.income)ageIncome <- age.incomeknot=c(23,24,25,27,30,32,35,38,40,42,46,49,52,55,59)nknots = 15
# Create fixed effects matrixageIncome <- cbind(ageIncome,row.names(ageIncome))names(ageIncome)[3] <- "obsn"ageIncome[,3] <- as.numeric(ageIncome[,3])ageIncome[,4] <- ageIncome[,1]^2names(ageIncome)[4] <- "age2"

#Create random effects matrix ZZ <- matrix(NA,nrow=n,ncol=nknots)u <- Z
for (i in 1:n){  for (k in 1:nknots)  {    u[i,k]<-(covariate[i]-knot[k])*step(covariate[i]-knot[k])    Z[i,k]<-pow(u[i,k],degree)  }}
Here the code segment I used for fit the model using INLA
formula <- log.income ~ age + age2 +f(obsn,model='z',Z=Z,hyper='gamma',param=c(.001, 0.001))
inla.fit <- inla(formula,data=ageIncome, family="gaussian", control.predictor=list(compute=TRUE) )
summary(inla.fit)
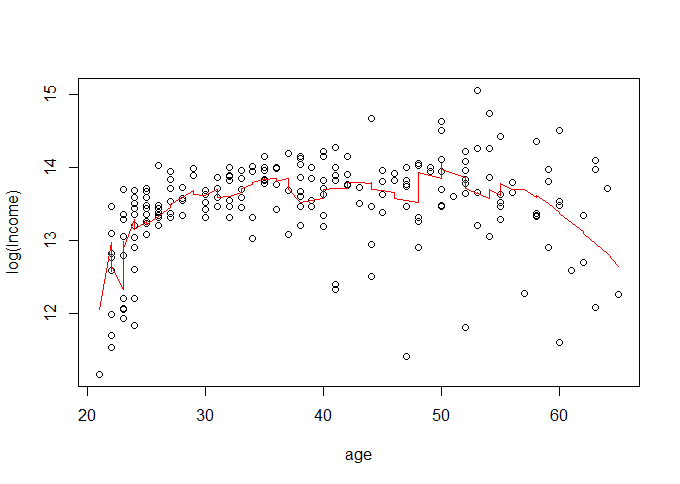
plot(ageIncome$age,ageIncome$log.income,xlab="age",ylab="log(Income)")lines(ageIncome$age,inla.fit$summary.fitted.values[,1],col='red')However, I'm unable to get the expected results. Could you please help me to pin point in the mistake I have done here. I'm using INLA stable version (0.0-1404466487).
Thanks in Advance.
Mahasen Dehideniya
Summary of the model

The plot I have obtained is given bellow.

Håvard Rue
Oct 2, 2014, 2:10:32 PM10/2/14
to Mahasen Dehideniya, r-inla-disc...@googlegroups.com
On Thu, 2014-10-02 at 06:56 -0700, Mahasen Dehideniya wrote:
> Hi all,
>
>
> I'm new to INLA and trying to fit a penalized splines model of degree
> 2, to model Canadian Age Income Data as described in section 3 of
> Bayesian Analysis for Penalized Spline Regression Using
> WinBUGS by Ciprian M. Crainiceanu, David Ruppert and M.P. Wand.
>
>
> I have create design matrices for fixed effects and random effects
> as described in the original reference. And I used age.income data
> set in SemiPar package
Hi,
> Hi all,
>
>
> I'm new to INLA and trying to fit a penalized splines model of degree
> 2, to model Canadian Age Income Data as described in section 3 of
> Bayesian Analysis for Penalized Spline Regression Using
> WinBUGS by Ciprian M. Crainiceanu, David Ruppert and M.P. Wand.
>
>
> I have create design matrices for fixed effects and random effects
> as described in the original reference. And I used age.income data
> set in SemiPar package
I try to rerun it, but I miss variable 'n' and 'covariate'. The first
one is easy, what is the second one?
H
--
Håvard Rue
Department of Mathematical Sciences
Norwegian University of Science and Technology
N-7491 Trondheim, Norway
Voice: +47-7359-3533 URL : http://www.math.ntnu.no/~hrue
Mobile: +47-9260-0021 Email: havar...@math.ntnu.no
R-INLA: www.r-inla.org
Mahasen Dehideniya
Oct 2, 2014, 6:41:51 PM10/2/14
to r-inla-disc...@googlegroups.com, mahasend...@gmail.com, hr...@r-inla.org
Dear Professor,
Sorry I have missed those as I put code segments.
Here n = 205 # number of observations and covariate is the predictor variable - age (vector).
I have attached my r script here. - PenalizedSplineINLA.R
Thank you very much.
Mahasen Dehideniya
Håvard Rue
Oct 3, 2014, 2:22:25 AM10/3/14
to Mahasen Dehideniya, r-inla-disc...@googlegroups.com
On Thu, 2014-10-02 at 15:41 -0700, Mahasen Dehideniya wrote:
> Dear Professor,
>
>
> Sorry I have missed those as I put code segments.
>
>
> Here n = 205 # number of observations and covariate is the predictor
> variable - age (vector).
>
>
> I have attached my r script here. - PenalizedSplineINLA.R
Hi,
> Dear Professor,
>
>
> Sorry I have missed those as I put code segments.
>
>
> Here n = 205 # number of observations and covariate is the predictor
> variable - age (vector).
>
>
> I have attached my r script here. - PenalizedSplineINLA.R
I don't understand this code and especially 'obsn' . I suggest to try
to code on a simpler simulated example where you know the truth and move
on from there
In any case, there is a spline-model buildt in, and is much easier to
use:
r = inla(log.income ~ f(age, model="rw2"),
control.predictor = list(compute=TRUE), data = ageIncome)
plot(ageIncome$age,ageIncome$log.income,xlab="age",ylab="log(Income)")
lines(ageIncome$age,r$summary.fitted.values[,1],col='red')
Mahasen Dehideniya
Oct 3, 2014, 3:30:58 AM10/3/14
to r-inla-disc...@googlegroups.com, hr...@r-inla.org
Dear Professor,
Thank you for your advice and solution. It gives the expected outcome and I test it with a known function : y = x*x + 2.
In my problem, I'm trying to fit penalized regression model as a mixed model. When I was searching for relevant examples I found this R code.
The example given in that code is little bit complicated. So I tried same code segment with Canadian Age Income Dataset. Because my intention is learn how to use INLA in the context of Semi-parametric regression .
In my code , 'obsn' is the observation number.
Thank you very much.
Mahasen Dehideniya
Hi,
Reply all
Reply to author
Forward
0 new messages