Tutorial code is not working
131 views
Skip to first unread message

Archie B
Aug 26, 2022, 5:14:40 PM8/26/22
to QuTiP: Quantum Toolbox in Python
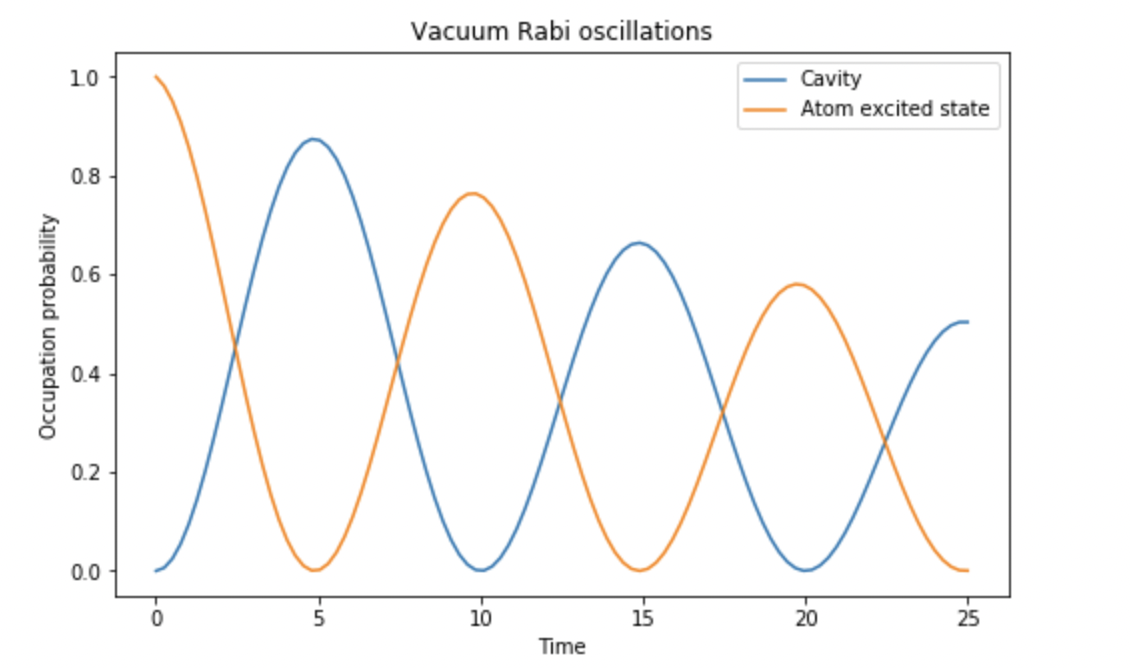
Hi, I've been starting to learn qutip to write my dissertation on Quantum computing. I was running the script on Vacuum Rabi oscillations in the Jaynes-cummings model from the example section on qutip.com. Originally it was working correctly. How ever, I have come back to it after about a month and I have run into an issue. When I run the code copied straight from the website it returns this error
"ODE integration error: Try to increase the allowed number of substeps by increasing the nsteps parameter in the Options class."
so I increase the nsteps to 100000:
output = mesolve(H, psi0, tlist, c_op_list, [a.dag() * a, sm.dag() * sm], options = Options(nsteps= 10000))
however I get an output that is completely different to what I should be getting.
What I should be getting:
What my code is outputting:
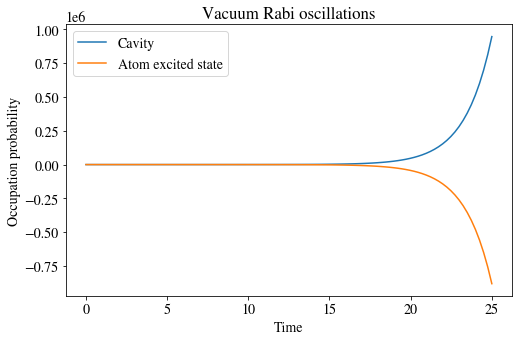
Do you have any idea what could be causing this error?
Any help would be hugely appreciated
my code:
import matplotlib.pyplot as plt
import numpy as np
from qutip import *
wc = 1.0 * 2 * np.pi # cavity frequency
wa = 1.0 * 2 * np.pi # atom frequency
g = 0.05 * 2 * np.pi # coupling strength
kappa = 0.005 # cavity dissipation rate
gamma = 0.05 # atom dissipation rate
N = 15 # number of cavity fock states
n_th_a = 0.0 # temperature in frequency units
use_rwa = True
tlist = np.linspace(0, 25, 100)
# intial state
psi0 = tensor(basis(N, 0), basis(2, 1)) # start with an excited atom
# operators
a = tensor(destroy(N), qeye(2))
sm = tensor(qeye(N), destroy(2))
# Hamiltonian
if use_rwa:
H = wc * a.dag() * a + wa * sm.dag() * sm + g * (a.dag() * sm + a * sm.dag())
else:
H = wc * a.dag() * a + wa * sm.dag() * sm + g * (a.dag() + a) * (sm + sm.dag())
c_op_list = []
rate = kappa * (1 + n_th_a)
if rate > 0.0:
c_op_list.append(np.sqrt(rate) * a)
rate = kappa * n_th_a
if rate > 0.0:
c_op_list.append(np.sqrt(rate) * a.dag())
rate = gamma
if rate > 0.0:
c_op_list.append(np.sqrt(rate) * sm)
output = mesolve(H, psi0, tlist, c_op_list, [a.dag() * a, sm.dag() * sm], options = Options(nsteps= 10000))
fig, ax = plt.subplots(figsize=(8, 5))
ax.plot(tlist, output.expect[0], label="Cavity")
ax.plot(tlist, output.expect[1], label="Atom excited state")
ax.legend()
ax.set_xlabel("Time")
ax.set_ylabel("Occupation probability")
ax.set_title("Vacuum Rabi oscillations")
plt.show()

Simon Cross
Aug 27, 2022, 10:45:44 AM8/27/22
to qu...@googlegroups.com
Just a quick note that this appears to be another Apple M1 SciPy issue and we're discussing it further in https://github.com/qutip/qutip/issues/1987.
Reply all
Reply to author
Forward
0 new messages