Qubit is not affected by simple pulses
24 views
Skip to first unread message

Brett Green
Jan 18, 2023, 2:44:11 AM1/18/23
to QuTiP: Quantum Toolbox in Python
Working in natural units (so that spins have energies +/-1), if I start with a qubit in the state |0> and apply a sigmax pulse of length pi/2, the qubit should be flipped to the |1> state. If I then apply a sigmay pulse of length pi/2, the qubit should be flipped back to the |0> state.
As a simple demonstration, I have coded this in QuTiP as follows between the hashes. My intent is to apply a sigmax pulse from t=1 to t=1+pi/2 and then to apply a sigmay pulse from t=3 to 3=3+pi/2.
##################################
import numpy as np
import matplotlib.pyplot as plt
pi = np.pi
from qutip import expect
from qutip.qip.device import Processor
from qutip.operators import sigmay, sigmax
from qutip.states import basis, ket2dm
processor = Processor(N=1)
processor.add_control(sigmax(), targets=0, label="sigmax")
processor.add_control(sigmay(), targets=0, label="sigmay")
# SOME PULSES HERE
fig, ax = processor.plot_pulses(show_axis=True)
fig.show()
initial_state = basis(2, 0)
result = processor.run_state(init_state=initial_state, analytical=False, noisy=False)
plot_data_0 = expect(ket2dm(basis(2, n=0)), result.states)
plot_data_1 = expect(ket2dm(basis(2, n=1)), result.states)
tlist = processor.get_full_tlist()
fig, ax = plt.subplots()
ax.plot(tlist, plot_data_0, label="0 occupation")
ax.plot(tlist, plot_data_1, label="1 occupation")
ax.set_xlabel("t")
ax.set_ylabel("")
ax.legend()
fig.show()
##################################
In the code above, the line "# SOME PULSES HERE" is replaced with one of the following:
processor.pulses[0].coeff = [1]
processor.pulses[0].tlist = [1, 1+pi/2]
processor.pulses[1].coeff = [1]
processor.pulses[1].tlist = [3, 3+pi/2]
or
processor.pulses[0].coeff = [0, 1, 0, 0, 0]
processor.pulses[0].tlist = [0, 1, 1+pi/2, 3, 3+pi/2, 5]
processor.pulses[1].coeff = [0, 0, 0, 1, 0]
processor.pulses[1].tlist = [0, 1, 1+pi/2, 3, 3+pi/2, 5]
or
processor.pulses[0].coeff = [0, 0, 1, 1, 0, 0, 0, 0]
processor.pulses[0].tlist = [0, 0.5, 1, 1.5, 1+pi/2, 3, 3+pi/2, 3.5, 5]
processor.pulses[1].coeff = [0, 0, 0, 0, 0, 1, 1, 0]
processor.pulses[1].tlist = [0, 0.5, 1, 1.5, 1+pi/2, 3, 3.5, 3+pi/2, 5]
processor.pulses[1].tlist = [0, 0.5, 1, 1.5, 1+pi/2, 3, 3.5, 3+pi/2, 5]
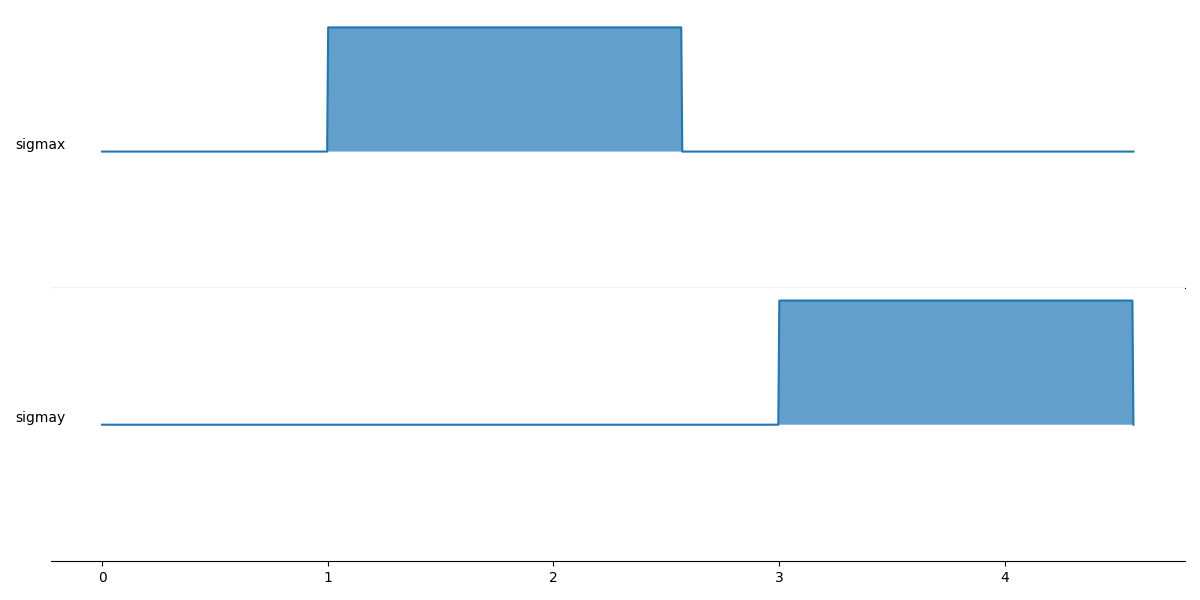
As I understand it, each of these should produce a unit-strength pulse of sigmax from time 1 to time 1+pi/2, and a unit-strength pulse of sigmay from time 3 to time 3+pi/2. My call of
processor.plot_pulses()
confirms that these are indeed the pulses generated in each case. However, the qubit does not behave as expected.
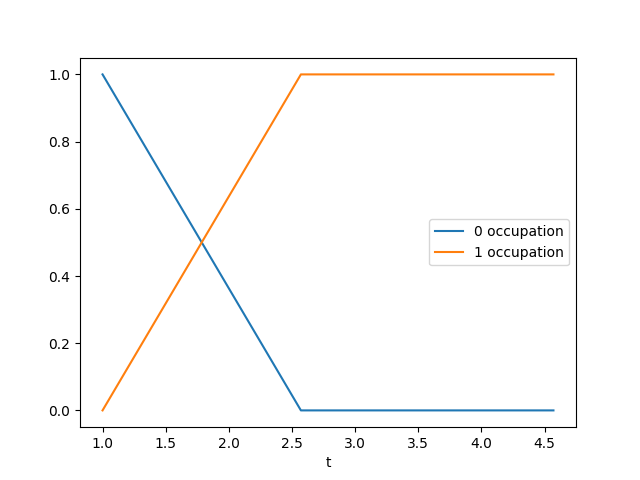
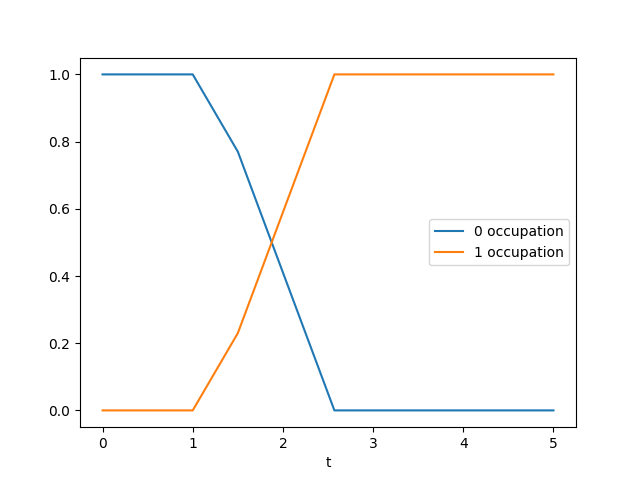
In the first case, the sigmax pulse flips the qubit successfully, but the sigmay pulse doesn't do anything to the qubit.
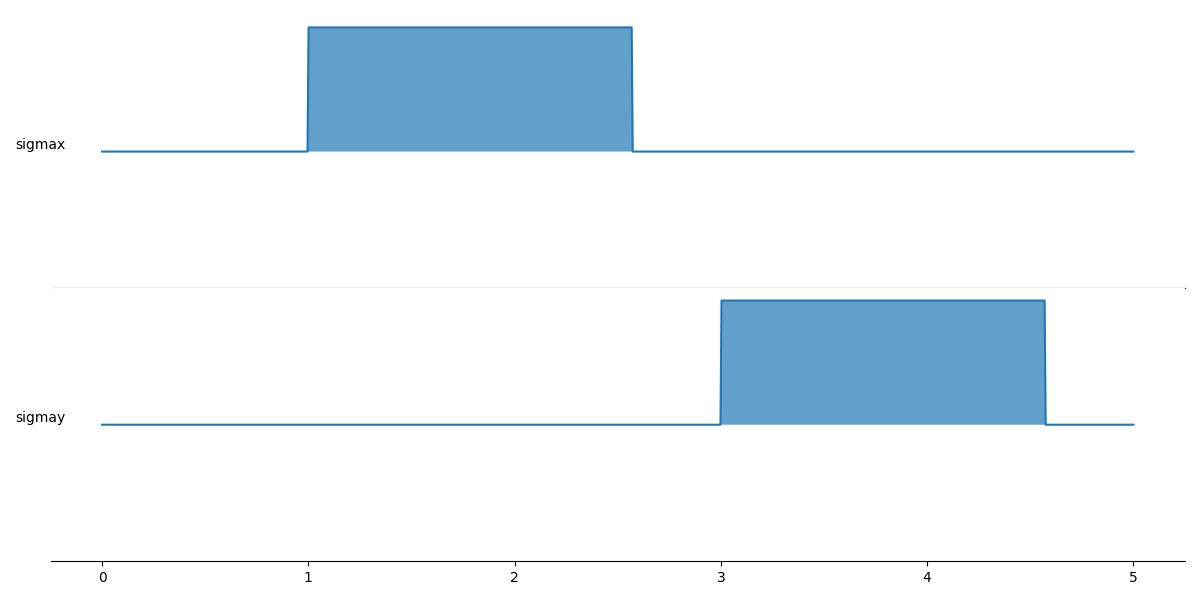
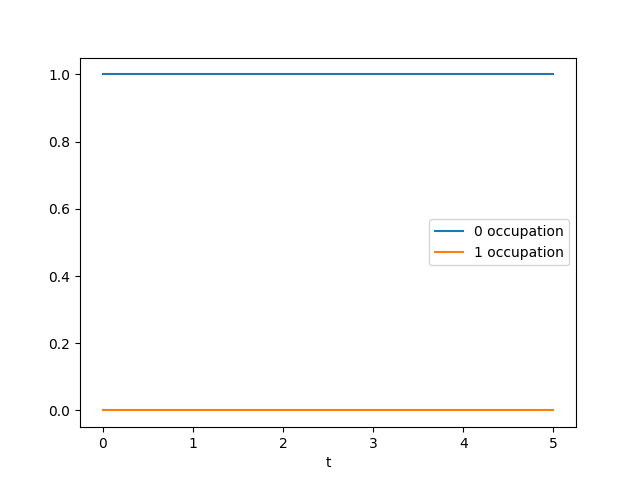
In the second case, neither pulse affects the qubit.
In the third case, the sigmax pulse affects the qubit but the sigmay pulse does not.

What is the issue here? Is there something I have misunderstood in the code?

Boxi Li
Jan 18, 2023, 8:39:24 PM1/18/23
to QuTiP: Quantum Toolbox in Python
Hello!
I haven't run your code yet. But from the figures, it looks very similar to this issue. https://github.com/qutip/qutip-qip/issues/172
You may find the solution in the last comment of mine on that issue, i.e. adding an option for max_step:
> myprocessor.run_state(..., options=qutip.Options(max_step=0.1))
Let me know if it does not work.
Best wishes
Boxi Li
Brett Green
Jan 23, 2023, 10:52:11 AM1/23/23
to qu...@googlegroups.com
Thank you very much! Yes, this does resolve the non-appearance of the pulses.
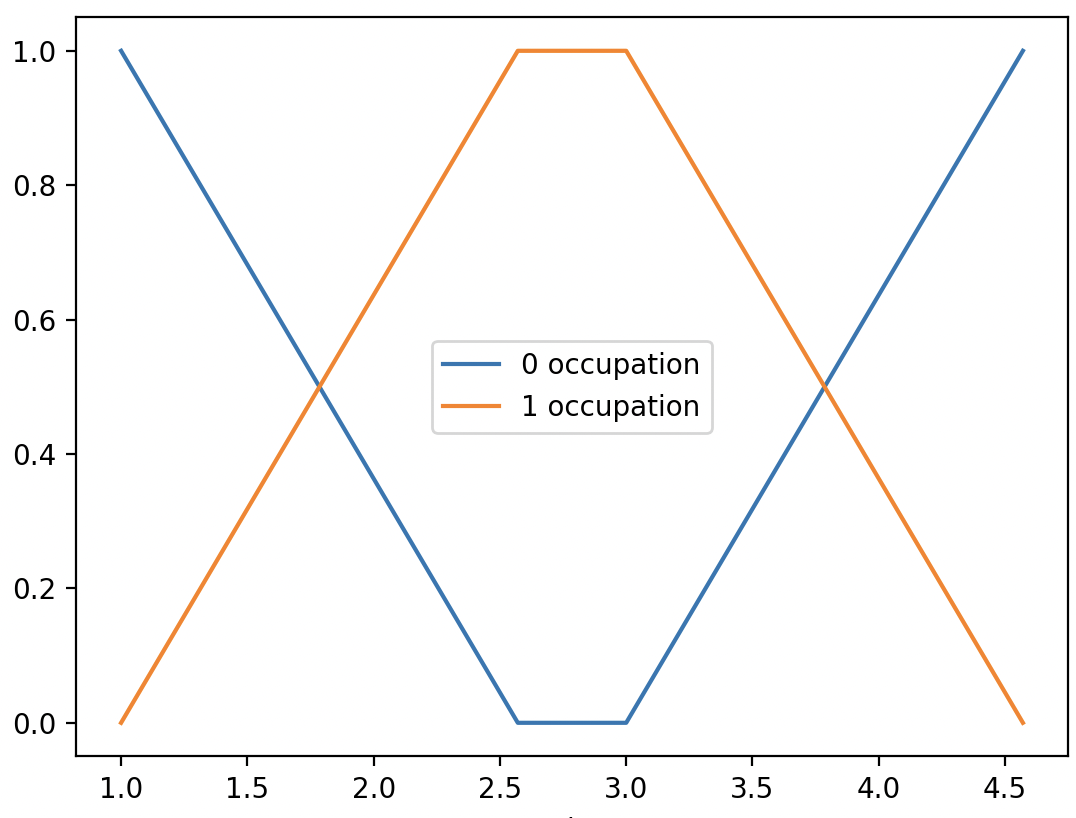
The populations are plotted as lines rather than sinusoids because my tlist contains only those few points at which the pulse height changed. To get a smoother plot, rather than adding in many more points by hand, does QuTiP have a convenient built-in method for filling out the tlist for plotting purposes?
- Brett Green
--
You received this message because you are subscribed to the Google Groups "QuTiP: Quantum Toolbox in Python" group.
To unsubscribe from this group and stop receiving emails from it, send an email to qutip+un...@googlegroups.com.
To view this discussion on the web visit https://groups.google.com/d/msgid/qutip/c6a03f4e-f58e-4ffa-8535-84110e6d366dn%40googlegroups.com.
Boxi Li
Jan 27, 2023, 10:12:26 AM1/27/23
to QuTiP: Quantum Toolbox in Python
Yes, you can provide a separate `tlist` to the solver (e.g. mesovle), which is only used to obtain the intermediate states or expectation values.
For the processor class, this is achieved by a kwargs:
>
myprocessor.run_state(..., tlist=tlist_for_plotting)
This will not interfere with the `tlist` used to define the pulse shape.
Best wishes
Boxi
Brett Green
Jan 27, 2023, 5:39:36 PM1/27/23
to qu...@googlegroups.com
Thank you very much! This is great.
You received this message because you are subscribed to a topic in the Google Groups "QuTiP: Quantum Toolbox in Python" group.
To unsubscribe from this topic, visit https://groups.google.com/d/topic/qutip/NQVxtcNyuZs/unsubscribe.
To unsubscribe from this group and all its topics, send an email to qutip+un...@googlegroups.com.
To view this discussion on the web visit https://groups.google.com/d/msgid/qutip/7ded8102-e8da-4ad3-a371-acb776736a2dn%40googlegroups.com.
Reply all
Reply to author
Forward
0 new messages