Is it possible to modify the source code of a qutip object like Bloch?
189 views
Skip to first unread message

Joan Arrow
Oct 27, 2021, 9:06:12 AM10/27/21
to QuTiP: Quantum Toolbox in Python
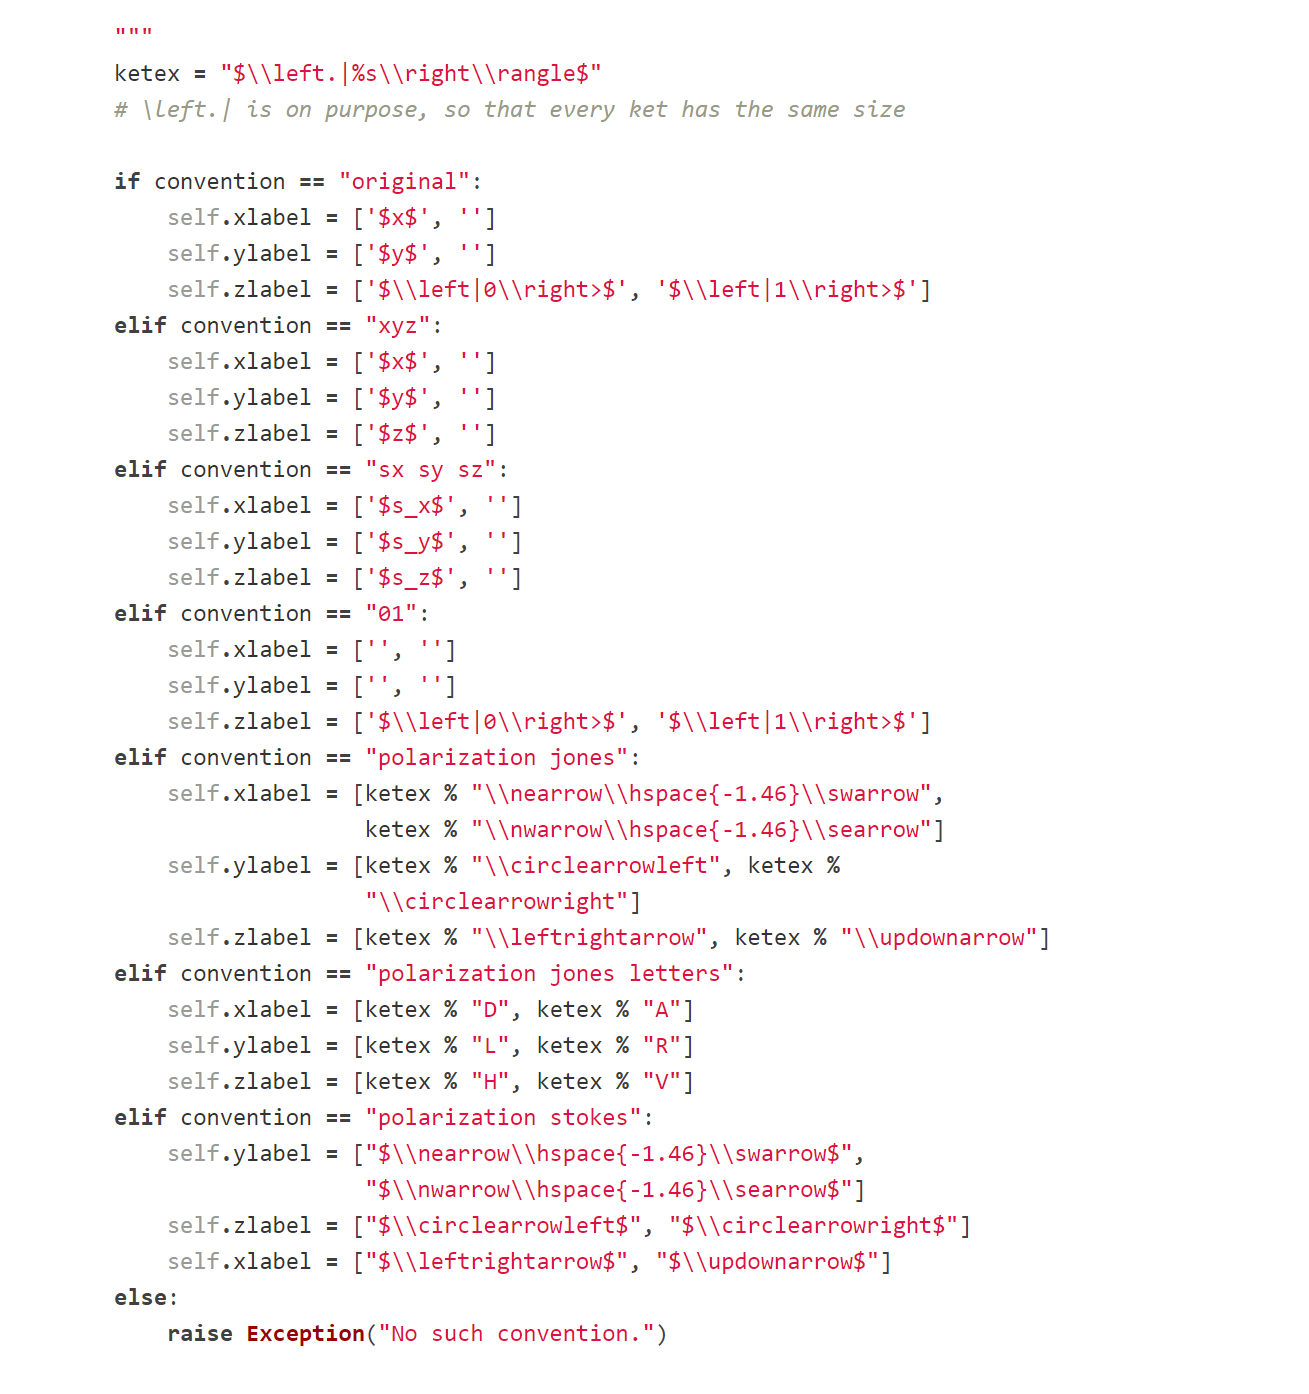
I would like to change the axis labels to display
|0> & |1> on the z axis (as is usual) and |+> & | - > instead of x and y. I found the relevent section of the source code in the documentation () but am relatively inexperienced with python and do not know how or whether it is possible to modify (or add to) these conventions.
Thanks for the help!

Gaurav Saxena
Oct 27, 2021, 9:37:26 AM10/27/21
to qu...@googlegroups.com
Hey Joan,
You can easily do something like this:
b= Bloch( figsize=[10,10])
b.xlabel = ['$\\left|+\\right>$', ' ']
b.ylabel = ['$\\left|+i \\right> $', ' ']
b.xlpos = [1.1,-1.1]
b.zlabel = [' $\\left|0\\right>$','$\\left|1\\right> $']
b.zlpos = [1.075,-1.08]
b.xlabel = ['$\\left|+\\right>$', ' ']
b.ylabel = ['$\\left|+i \\right> $', ' ']
b.xlpos = [1.1,-1.1]
b.zlabel = [' $\\left|0\\right>$','$\\left|1\\right> $']
b.zlpos = [1.075,-1.08]
The above code snippet will include a |0>,|1>, |+>, |+i> in your Bloch sphere.
Hope this helps.
Best,
Gaurav
On Wed, Oct 27, 2021 at 3:06 PM Joan Arrow <etude.o...@gmail.com> wrote:
I would like to change the axis labels to display |0> & |1> on the z axis (as is usual) and |+> & | - > instead of x and y. I found the relevent section of the source code in the documentation () but am relatively inexperienced with python and do not know how or whether it is possible to modify (or add to) these conventions.Thanks for the help!
--
You received this message because you are subscribed to the Google Groups "QuTiP: Quantum Toolbox in Python" group.
To unsubscribe from this group and stop receiving emails from it, send an email to qutip+un...@googlegroups.com.
To view this discussion on the web visit https://groups.google.com/d/msgid/qutip/01b5cf9a-de85-4b80-ad79-ea410bd4f612n%40googlegroups.com.
Gaurav Saxena(Ph.D. Candidate)
Department of Physics and Astronomy
University of Calgary
(+1-403-992-2974)Reply all
Reply to author
Forward
0 new messages