Workflow for counting cells with multiple fluorophores and puncta

2,734 views
Skip to first unread message

achamess

unread,
Dec 13, 2017, 10:45:28 AM12/13/17
to QuPath users

Hi,

QuPath looks like it could be an extremely useful tool for a standard analysis I do.

Basically, I want to:

  • Identify cells in spinal cord tissue sections, either automatically or by manually.
    • I'm willing to draw ROIs by hand or some combination of auto-detect plus clean-up by hand. That's not horrible. But counting and finding overlaps, that is the part that I need to automate.
  • Identify the cellular staining: Usually, cells have (DAPI) and then one or more IHC signals (antibody) or ISH signal (RNAscope, which usually show as puncta)
  • Count the overlapping events: I want to see which cells have combinations of fluorescent signals: red alone, red+green, green alone, etc. Sometimes this will be binary (yes/no) but it'd be nice to make more bins like absent, low, medium and high.
  • Optional for ISH: Count puncta inside of cells.

This is such a core analysis for a lot of neuroscience. I've tried to use Fiji and I still don't know how to do this in a straight forward way. I've resorted to just using Photoshop and manually counting, but that's a huge pain.

CellProfiler looks like it might have some cool features, and I presented the problem there too:
http://forum.cellprofiler.org/t/rnascope-in-spinal-cord-neurons-quantitation-of-overlap-between-different-in-situ-probes/5355/3

But could some combination of QuPath + Cell Profiler (or QuPath alone) get the job done? I feel like it can.

Here is an example image:


Any help would be greatly appreciated.


Note: I cross posted this on Github and @svidro gave a great response. But I'm putting it here to get more people involved. 

https://github.com/qupath/qupath/issues/126

micros...@gmail.com

unread,
Dec 13, 2017, 2:59:54 PM12/13/17
to QuPath users

As an addon to this, it looks like there is some issue exporting the multiple image projection from the Nikon software (NIS viewer)  which leads to losing/corrupting much of the metadata (pixel size, bit depth should be 14).  The QuPath side of things reminds me of https://github.com/qupath/qupath/issues/107

The starting .nd2 file runs fine, but the adjusted files... well I am having trouble getting 4 channels into a TIFF that QuPath can read.

I will give Fiji a try, but I don't have much experience editing metadata.  Anyone else have any ideas?


Pete

unread,
Dec 17, 2017, 1:10:41 PM12/17/17
to QuPath users
Hi, interesting problem.  It looks like something that QuPath could help with, although Fiji/CellProfiler could as well.

I'm joining a bit late and am confused about the status and have a couple of questions/suggestions...
PS. As far as I know, it's generally the same people reading/posting here as on GitHub... so best just use one or the other.  I'd prefer Google Groups for questions, and GitHub for issues/bug reports (I know there are a lot of questions on GitHub as well, but these will eventually be closed and harder to find - the main purpose there is to keep a todo list for needed fixes/feature requests).

Also if you do find a solution, please do post an update, no matter what software you use... thanks :)

achamess

unread,
Dec 17, 2017, 7:32:37 PM12/17/17
to QuPath users
Hi Pete,

Thanks for the reply. 

To your questions:

  • Is there already a CellProfiler solution?  If so, https://github.com/qupath/qupath/issues/123 might be interesting.  But in that case, would introducing QuPath help - or have you already got the result you need?
Not that I know of. I started that thread at CellProfiler to seek help in trying to get CellProfiler to do what i need. It segments nuclei OK, and seems great for batch processing, but I like how QuPath allows you to interact much more with the image manually and define areas of interest and do manual corrections if needed.
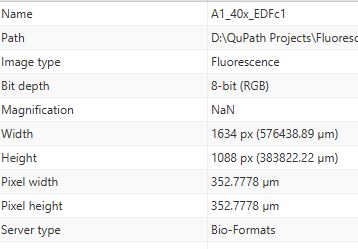
  • Something looks badly wrong in the metadata of microscopyra's screenshot (not just the RGB-ness, but also the pixel size), however I don't know where the .nd2 file came from.  Was it posted somewhere?
Not sure what's up. Research Associate has been extremely helpful in trying to find me a solution with QuPath. So I sent him the original nd2 file. I use a Nikon epifluorescence scope and the Nikon Elements software. The native file format is .nd2. I usually export as TIFFs. The TIFFs that get exported have the messed up metadata. So we tried the nd2 file directly, which can be viewed directly in QuPath using the Bio-Formats extension. In this way, the metadata were fine. I'm attaching an nd2 file here as an example. There is a blue channel (DAPI), red channel (one ISH signal) and white channel (another ISH signal).

Yes, this is the post that got me interested in QuPath in the first place. 

Anyway, to re-iterate the problem I'm trying to solve. I need to:
- Identify cells, either manually, automatically, or some combination of the two.
- See what's inside each cell (fluorescence signals... sometime a binary yes/no, sometimes an absolute measure)
- Quantitate the coincidence of different fluorescent signals

For the ISH images I work with, there are often individual puncta inside the cells, so spot counting seems appropriate. But with IHC, the signal usually fills the whole cell. 

Some specific questions:

- If I make automatic detections, which of the many measurements is the one that tells me how much signal is inside my cell? The sum or mean or what? What's the best way to see how much signal intensity is inside a detection?

- Is there a way to turn hand drawn annotations into detections? Alternatively, if I use the automated segmentation on DAPI, can I go and amend some of the detections manually? 

- Is there a way to identify whole cell boundaries, not just nuclei? 


micros...@gmail.com

unread,
Dec 17, 2017, 7:34:34 PM12/17/17
to QuPath users
Once bioformats was installed, he was able to open the .nd2 file.  The odd metadata seems to be a result of generating the multiple image projection (from a z stack, not something I have any experience with) through the Nikon software, which I was able to fix using ImageJ, but it was a bit involved since I had to:
"Unfortunately, it will take quite a bit of work to set the images up in ImageJ, as you have to import all 4 base images, split them all (Image-Stacks-Stack to images), edit the pixel size (Image-Properties), close all of the blank channels, then remerge them (Image-Stack-Images to stack), and finally create a composite (Image-Color-Merge channels).  You may end up wanting to ask on the ImageJ forums about writing a macro script for that, as it will require quite a bit of picking out the right file names, and which channels to keep based on the file names...  Not sure how many images you want to do this for, but at least this should work."

I think he ended up going with the original .nd2 file which only had data from 3 channels, but apparently that was enough.  It also turned out that I originally couldn't open the OME-TIFF (or the .nd2) generated by the above method until I updated my version of the bioformats jar, which hadn't been done in about 6 months or more.  Keeping up with those updates is important!

achamess

unread,
Dec 17, 2017, 7:35:16 PM12/17/17
to QuPath users
Here is the nd2 file:


Also, here is a recent automated solution to exactly the problem I'm positing using MatLab:

I still like the interactivity of QuPath and the ability to draw regions in the tissue. Also, for IHC, as I mentioned, I don't need to do spot counting, so much as quantify the intensity of the signal. 

micros...@gmail.com

unread,
Dec 17, 2017, 9:14:53 PM12/17/17
to QuPath users
Ah, the post didn't register that you updated in the 2 minutes before I posted the last one!  And thanks for the MatLab link!


- If I make automatic detections, which of the many measurements is the one that tells me how much signal is inside my cell? The sum or mean or what? What's the best way to see how much signal intensity is inside a detection?
The sum should be the total intensity in each pixel, and is great for Nuclear only measurements.  Unfortunately it is not included for the Cytoplasm when the cells are generated.  "Cell: Channel X mean" (or Cytoplasm) is probably your best bet if you do not want to generate other measurements.  You could also multiple the "Cell: Channel X mean" by the "Cell: Area" to get the whole cell sum, and then subtract the "Nucleus: Channel X sum" to get the cytoplasm sum if needed.  I tend to think best is related to the specific experiment, but maybe Pete will have some better ideas!


- Is there a way to turn hand drawn annotations into detections? Alternatively, if I use the automated segmentation on DAPI, can I go and amend some of the detections manually?
Sort of, see the final post of: https://groups.google.com/forum/#!topic/qupath-users/JBrVa0DQ8pk
This turns the annotation into a detection object, but NOT a cell.  I don't know of any way to draw a nucleus+cytoplasm, and I do not think the program is designed to allow editing of the detections.  As Pete just reminded me, annotations have their associated values updated dynamically, while detections have fixed measurements when they are created.  For example, if you did manage to edit a cell boundary, you would not be changing the measurement for "Cell: Area."


- Is there a way to identify whole cell boundaries, not just nuclei?
If you mean trying to use image information to create the cell boundaries, there is one experimental method (for H-DAB only I think?) called Cell+membrane detection, but I had mixed results with that.  Otherwise, I think it is up to the "Cell expansion" parameter when you are performing the segmentation.  One of the reasons I like the subcellular detection command for IHC is that you can increase the size of the cells dramatically without the extra "empty" space influencing the measurement like it would with a cell mean or cytoplasm mean intensity.  Subcellular detection isn't just for spot counting, it can be used as more of a general "threshold within a cell" measurement.

achamess

unread,
Dec 18, 2017, 12:24:22 PM12/18/17
to QuPath users
The sum should be the total intensity in each pixel, and is great for Nuclear only measurements.  Unfortunately it is not included for the Cytoplasm when the cells are generated.  "Cell: Channel X mean" (or Cytoplasm) is probably your best bet if you do not want to generate other measurements.  You could also multiple the "Cell: Channel X mean" by the "Cell: Area" to get the whole cell sum, and then subtract the "Nucleus: Channel X sum" to get the cytoplasm sum if needed.  I tend to think best is related to the specific experiment, but maybe Pete will have some better ideas!

OK. For the spinal cord image I'm using as an example (which has only 3 channels btw. Different from the original one I posted. No GFP), I'm going to conservatively take the nucleus as the cell. Even though that's not biologically correct, I worry about expanding the cell boundary because it will then overlap with other cells. 

So let's take nucleus == cell for now. So sum is the total sum of the intensities of all pixels inside of the detection (ROI)? And mean is the average intensity of the pixels? Which is the better metric for "amount of signal inside the cell"? I presume the sum vs the mean. But you've also mentioned that the empty space (areas inside ROI/detection without channel signal) influence that measure. What if we background subtract? Is there a way to do that? Or would dividing the sum by the cross sectional area (a derived metric) be better? Also, what is the best way to set a threshold in QuPath? Using the brightness/contrast? 

Sort of, see the final post of: https://groups.google.com/forum/#!topic/qupath-users/JBrVa0DQ8pk
This turns the annotation into a detection object, but NOT a cell.  I don't know of any way to draw a nucleus+cytoplasm, and I do not think the program is designed to allow editing of the detections.  As Pete just reminded me, annotations have their associated values updated dynamically, while detections have fixed measurements when they are created.  For example, if you did manage to edit a cell boundary, you would not be changing the measurement for "Cell: Area."

 the automated segmentation of nuclei is pretty good, but not perfect. 


So ultimately I see QuPath getting me part of the way with automatic detection and then I will go in and fix the obviously wrong ones. But it doesn't seem like that's really an option. In other scenarios, the nucleus and the cell are very different, and I see now way to do this but by hand (draw borders/ROIs around cells). 


So this is why I'm asking about turning annotations into detections, so I can get all the metrics I want (intensity, sum, spots, etc.)

So for this second kind of image, with these big round cells that I plan to draw by hand, is there a way for me to get the metrics I want? Forget the automated segmentation. Basically I just want to draw cells and then count puncta/spots inside. It seems like the subcellular detection is the way to go, but I don't know how to get this to work with the annotations. I open up that dialog box and nothing happens.

If you mean trying to use image information to create the cell boundaries, there is one experimental method (for H-DAB only I think?) called Cell+membrane detection, but I had mixed results with that.  Otherwise, I think it is up to the "Cell expansion" parameter when you are performing the segmentation.  One of the reasons I like the subcellular detection command for IHC is that you can increase the size of the cells dramatically without the extra "empty" space influencing the measurement like it would with a cell mean or cytoplasm mean intensity.  Subcellular detection isn't just for spot counting, it can be used as more of a general "threshold within a cell" measurement.

So my interest here is related to the last comment. For these big round cells that are much larger than the nucleus, I was hoping that there might be a way to automatically segment them, not nuclei. I have some cell-filling dyes that can show you the entire border of the cell. And sometimes the IHC/ISH stainings themselves give you the border of the cell. LIke this:


But for now, it seems that there isnt' a way to do that automatically. I'm OK with that. I can draw by hand. But after drawing, I want QuPath to basically automate the process of counting intersections of signal (blue + green, green + red, red + green + blue, etc). That's where the majority of the labor is.

micros...@gmail.com

unread,
Dec 18, 2017, 6:17:38 PM12/18/17
to QuPath users
So ultimately I see QuPath getting me part of the way with automatic detection and then I will go in and fix the obviously wrong ones. But it doesn't seem like that's really an option. In other scenarios, the nucleus and the cell are very different, and I see now way to do this but by hand (draw borders/ROIs around cells).
Not sure how much you have played around with the settings for the nuclear detection, but it looks like in the spinal cord image your threshold might be a little bit low.  I just played around with the other .nd2 file, and a decent threshold was around 1200-1500.  I assume, though, you would want to aim low since while it won't work very well to draw in new cells by hand, it's quite easy to manually delete cells, or select a subset based on some criteria (size, shape, intensity) and delete them.

But you've also mentioned that the empty space (areas inside ROI/detection without channel signal) influence that measure. What if we background subtract? Is there a way to do that? Or would dividing the sum by the cross sectional area (a derived metric) be better? Also, what is the best way to set a threshold in QuPath? Using the brightness/contrast?
Any type of measurement will be subject to both background and space, which is why it is so dependent on the experiment. If you are looking at a single spot in a very large cross section of a nuclei, vs a single spot in a very narrow tip of a nuclei, your mean is going to be very different.  On the other hand, if your background is strong, an empty "large" nuclei might sum up to the same intensity as a single spot.

To background subtract, you might take the mean intensity of a "typical" negative cell, or after performing the initial classification, take the mean of all negative cell means as something more representative of the overall population.  Of course, by then you have mostly solved your positivity problem, so the mean of means would mostly be used for accurate "sum" measurements when you compare positive cell populations to each other.

Thresholding can visually be handled through the brightness and contrast, but that has no effect on any of the detection measurements.  I am pretty sure the only ways to threshold for measurements are the settings that say threshold in the cell detection and subcellular detection dialogs (or anything you code yourself).

So for this second kind of image, with these big round cells that I plan to draw by hand, is there a way for me to get the metrics I want? Forget the automated segmentation. Basically I just want to draw cells and then count puncta/spots inside. It seems like the subcellular detection is the way to go, but I don't know how to get this to work with the annotations. I open up that dialog box and nothing happens.
Subcellular detections can only be performed on cells, and they require pixel width and height values in order to be run.  With either of those things missing, it will not run.  In your case, you don't have cells, you have annotations.  You can use the script previously linked to turn them into detections, but I am not sure how to fool the program into thinking they are cell objects, or what problems it might cause if you were able to (cell objects assume nucleus and cytoplasm, which you can see if you reduce the "Cell expansion" to 0 in cell detection.  You no longer get cells, just detection objects).

For the last bit, I think the easiest method would be to use the ImageJ macro runner due to wanting to detect multiple channels at once.  Your images are fairly small, so you would not need to downsample much, if at all, to drop them into ImageJ, remove the green channel maybe, and then perform a segmentation on a grayscale version of the no-green image (Analyze->Analyze Particles, along with Plugins->Send overlay to QuPath-Detections).  Once those detection measurements are back in QuPath,  you could generate measurements like "Blue mean" "Red Mean" etc. and classify off of that.  At least based on what I think you are wanting.  You could also segment WITH green, but that would be far messier, and you would probably want to remove some of the segmentation after getting it back into QuPath based on shape, size or color.

If you wanted to hand draw it, you could still do that, convert the annotations into detections, and then generate all of the measurements you need through Analyze-> Calculate Features-> Add intensity features.  For hundreds of images, the ImageJ Extension would be very useful, but for just a few it would probably work well enough.  Either way, once you were done, you would probably want to draw an annotation region around the whole thing so you could use Show Annotation Measurements to summarize.

On the other hand... I can't tell from the image but if the blue is just DAPI, and all of the cells have detectable nuclei, you could just do the nuclear segmentation with a 0.5-1um Cell expansion in order to make sure you only pick up the signal from that cell.  Then the "Cytoplasm: Channel X mean intensity" should work just fine.

achamess

unread,
Dec 21, 2017, 9:44:51 AM12/21/17
to QuPath users
Not sure how much you have played around with the settings for the nuclear detection, but it looks like in the spinal cord image your threshold might be a little bit low.  I just played around with the other .nd2 file, and a decent threshold was around 1200-1500.  I assume, though, you would want to aim low since while it won't work very well to draw in new cells by hand, it's quite easy to manually delete cells, or select a subset based on some criteria (size, shape, intensity) and delete them. 

Good point. I agree with being easier to remove than add (right now). What's a good way to systematically find a reasonable range for thresholds? I've just been putting numbers in and empirically testing whether the threshold value results in correct segmentation. How do I know the 'correct' numerical value to begin with?

Any type of measurement will be subject to both background and space, which is why it is so dependent on the experiment. If you are looking at a single spot in a very large cross section of a nuclei, vs a single spot in a very narrow tip of a nuclei, your mean is going to be very different.  On the other hand, if your background is strong, an empty "large" nuclei might sum up to the same intensity as a single spot.

I understand with mean, since that is the mean pixel intensity and that will diluted by more space. Should space (or mean) be normalized by cell area, so as to compare them? Since a larger cell will have more pixels. I suppose it depends on the question too. Background substracting will need to happen outside of QuPath, right? Like using the CSV file. I don't see any way to do that in QuPath. 

Subcellular detections can only be performed on cells, and they require pixel width and height values in order to be run.  With either of those things missing, it will not run.  In your case, you don't have cells, you have annotations.  You can use the script previously linked to turn them into detections, but I am not sure how to fool the program into thinking they are cell objects, or what problems it might cause if you were able to (cell objects assume nucleus and cytoplasm, which you can see if you reduce the "Cell expansion" to 0 in cell detection.  You no longer get cells, just detection objects).

This is the biggest impediment now to making QuPath do what I want. For spinal cord (where cell ~ nucleus), the automatic segmentation is pretty good. But in that other image (dorsal root ganglia), where the cells are large and round, and the nucleus is much smaller than the cell, there is no avoiding drawing by hand (unless QuPath or maybe Cell Profiler could detect the whole cell boundary). I've used your script for turning annotations to detections, but it doesn't turn them into cells. So I can't use the subcellular spot counting. 

Pete: Is there any way to turn a detection into a cell object?

When I use the annotation -> detection script, I can then use the 'calculate intensity' function. But what about sum? Can I get that?


For the last bit, I think the easiest method would be to use the ImageJ macro runner due to wanting to detect multiple channels at once.  Your images are fairly small, so you would not need to downsample much, if at all, to drop them into ImageJ, remove the green channel maybe, and then perform a segmentation on a grayscale version of the no-green image (Analyze->Analyze Particles, along with Plugins->Send overlay to QuPath-Detections).  Once those detection measurements are back in QuPath,  you could generate measurements like "Blue mean" "Red Mean" etc. and classify off of that.  At least based on what I think you are wanting.  You could also segment WITH green, but that would be far messier, and you would probably want to remove some of the segmentation after getting it back into QuPath based on shape, size or color.

 Could you clarify. What is this for? For detecting cells? 

If you wanted to hand draw it, you could still do that, convert the annotations into detections, and then generate all of the measurements you need through Analyze-> Calculate Features-> Add intensity features.  For hundreds of images, the ImageJ Extension would be very useful, but for just a few it would probably work well enough.  Either way, once you were done, you would probably want to draw an annotation region around the whole thing so you could use Show Annotation Measurements to summarize.
On the other hand... I can't tell from the image but if the blue is just DAPI, and all of the cells have detectable nuclei, you could just do the nuclear segmentation with a 0.5-1um Cell expansion in order to make sure you only pick up the signal from that cell.  Then the "Cytoplasm: Channel X mean intensity" should work just fine.

This seems viable. Draw the cells by hand, then turn annotations -> detections with the script. But per our discussion above, if I want to see how much signal is inside a detection, it seems like the sum of intensities is better than the mean. Can I get the sum somehow? Or am I misunderstanding that? I agree that the subcellular detection is the best way to figure out how much signal is into a cell, since it doesn't count the blank space. For IHC, where the cell is full, this isn't as much as an issue, but even then, I think you've suggested that the subcellular detection could still be used to count the whole internal contents of the cell as one big spot. Yes? 

Sorry for asking so many questions. Thanks so much for all your help. 

micros...@gmail.com

unread,
Dec 21, 2017, 2:12:20 PM12/21/17
to QuPath users
What's a good way to systematically find a reasonable range for thresholds?
The 1 2 and 3 keys let you individually select channels, and the numbers in the lower right show you pixel values for the currently visible channels.  That should give you a good starting point, and after that it is just playing with the Threshold and Sigma values while re-running the cell detection.

If you want a less biased measure of background, you could hand draw an annotation area somewhere within the sample but without any nuclei and use Calculate Intensity Features on that (generate the mean/min/max/std dev).


Background substracting will need to happen outside of QuPath, right?
It really depends on how you want to handle it.  You can use any cell values to create new values, and repeat as many times as you like, all within QuPath.  So if you found an "average" background value for the whole slide, you could easily create a new measurement using getMeasurementList().putMeasurement() to create a "background adjusted mean."  The actual math involved in calculating that value would depend on how you generated it and whether you were adjusting the sum or mean.  It could also be easily handled in R, Python, or many other programs.  The adjusted sum, for example, would be something like (mean detection intensity[from Calculate intensity features] - mean background intensity[calculated elsewhere])*(detection area[from Calculate shape features]).  Finding a rolling adjusted background would be significantly harder, and I don't know if it is warranted in your situation.  Your positive values seemed quite high compared to the background in that one image, so if the impact of the background is negligible... shrug.  I was mostly pointing it out for completeness.


When I use the annotation -> detection script, I can then use the 'calculate intensity' function. But what about sum? Can I get that?
Indirectly.  You would also need to add the Area (Add Shape Features), and once you have the mean and area, multiply.  Just make sure you are keeping the units consistent for area, as QuPath swaps back and forth between pixels and microns in places.


For the last bit, I think the easiest method would be to use the ImageJ macro runner due to wanting to detect multiple channels at once.  Your images are fairly small, so you would not need to downsample much, if at all, to drop them into ImageJ, remove the green channel maybe, and then perform a segmentation on a grayscale version of the no-green image (Analyze->Analyze Particles, along with Plugins->Send overlay to QuPath-Detections).  Once those detection measurements are back in QuPath,  you could generate measurements like "Blue mean" "Red Mean" etc. and classify off of that.  At least based on what I think you are wanting.  You could also segment WITH green, but that would be far messier, and you would probably want to remove some of the segmentation after getting it back into QuPath based on shape, size or color.

 Could you clarify. What is this for? For detecting cells?

Yes.  For automatically generating objects that could act as the whole cell.  Coming back from ImageJ into QuPath they would still just be detections, not pathCellObjects, but it might be better than hand drawing.  The specifics of the macro would be a little more tricky, since if you are starting with a .nd2 file, it starts off in ImageJ as an image stack, so you would need to merge the channels you wanted to use for cell detection, then perform the particle analysis.


Can I get the sum somehow? Or am I misunderstanding that? I agree that the subcellular detection is the best way to figure out how much signal is into a cell, since it doesn't count the blank space. For IHC, where the cell is full, this isn't as much as an issue, but even then, I think you've suggested that the subcellular detection could still be used to count the whole internal contents of the cell as one big spot. Yes?
Sum covered above, I think.  Any mean combined with area is going to get you some measure of the sum across an entire detection object.  And yes, subcellular detection is quite handy, though it does have that nagging cell requirement.  Whether it is necessary vs just using Cytoplamic mean will depend on whether you just want a binary classifier and how much the cell size, shape, and nuclear size vary.

And no problem, this is all for fun :)

Pete

unread,
Dec 26, 2017, 9:17:08 AM12/26/17
to QuPath users
Hi, a quick answer to this bit...


Pete: Is there any way to turn a detection into a cell object?


The type if fixed when the object is created (i.e. no converting later).  But I believe there was a script earlier that involved either
def detection = new PathTileObject(roi, pathObject.getPathClass())
or
def detection = new PathDetectionObject(roi, pathObject.getPathClass())

To create a cell you'd use
def detection = new PathCellObject(roi, null, pathObject.getPathClass())
where the extra 'null' means that a nucleus ROI isn't being specified.

achamess

unread,
Dec 26, 2017, 1:03:04 PM12/26/17
to QuPath users
Thanks Pete. 

I made the change to the script:

import qupath.lib.objects.PathTileObject
import qupath.lib.roi.RectangleROI
import qupath.lib.scripting.QP
import qupath.lib.objects.PathCellObject

// Set this to true to use the bounding box of the ROI, rather than the ROI itself
boolean useBoundingBox = false

// Get the current hierarchy
def hierarchy = QP.getCurrentHierarchy()

// Get the select objects
def selected = getAnnotationObjects()

// Check we have anything to work with
if (selected.isEmpty()) {
    print("No objects selected!")
    return
}

// Loop through objects
def newDetections = new ArrayList<>()
for (def pathObject in selected) {

    // Unlikely to happen... but skip any objects not having a ROI
    if (!pathObject.hasROI()) {
        print("Skipping object without ROI: " + pathObject)
        continue
    }

    // Don't create a second annotation, unless we want a bounding box
    if (!useBoundingBox && pathObject.isDetection()) {
        print("Skipping annotation: " + pathObject)
        continue
    }

    // Create an annotation for whichever object is selected, with the same class
    // Note: because ROIs are (or should be) immutable, the same ROI is used here, rather than a duplicate
    def roi = pathObject.getROI()
    if (useBoundingBox)
        roi = new RectangleROI(
                roi.getBoundsX(),
                roi.getBoundsY(),
                roi.getBoundsWidth(),
                roi.getBoundsHeight(),
                roi.getC(),
                roi.getZ(),
                roi.getT())
    def detection = new PathCellObject(roi,null,pathObject.getPathClass())
    newDetections.add(detection)
    print("Adding " + detection)
}

// Actually add the objects
hierarchy.addPathObjects(newDetections, false)
if (newDetections.size() > 1)
    print("Added " + newDetections.size() + " detections(s)")

And here is the output:

INFO: Adding Polygon
ERROR: Error at line 58: null

ERROR: Script error
    at qupath.lib.objects.hierarchy.PathObjectHierarchy.addPathObjectToList(PathObjectHierarchy.java:350)
    at qupath.lib.objects.hierarchy.PathObjectHierarchy.addPathObjects(PathObjectHierarchy.java:519)
    at qupath.lib.objects.hierarchy.PathObjectHierarchy$addPathObjects.call(Unknown Source)
    at org.codehaus.groovy.runtime.callsite.CallSiteArray.defaultCall(CallSiteArray.java:48)
    at org.codehaus.groovy.runtime.callsite.AbstractCallSite.call(AbstractCallSite.java:113)
    at org.codehaus.groovy.runtime.callsite.AbstractCallSite.call(AbstractCallSite.java:133)
    at Script10.run(Script10.groovy:59)
    at org.codehaus.groovy.jsr223.GroovyScriptEngineImpl.eval(GroovyScriptEngineImpl.java:343)
    at org.codehaus.groovy.jsr223.GroovyScriptEngineImpl.eval(GroovyScriptEngineImpl.java:152)
    at qupath.lib.scripting.DefaultScriptEditor.executeScript(DefaultScriptEditor.java:765)
    at qupath.lib.scripting.DefaultScriptEditor.executeScript(DefaultScriptEditor.java:695)
    at qupath.lib.scripting.DefaultScriptEditor.executeScript(DefaultScriptEditor.java:677)
    at qupath.lib.scripting.DefaultScriptEditor.access$400(DefaultScriptEditor.java:136)
    at qupath.lib.scripting.DefaultScriptEditor$2.run(DefaultScriptEditor.java:1029)
    at java.util.concurrent.Executors$RunnableAdapter.call(Executors.java:511)
    at java.util.concurrent.FutureTask.run(FutureTask.java:266)
    at java.util.concurrent.ThreadPoolExecutor.runWorker(ThreadPoolExecutor.java:1142)
    at java.util.concurrent.ThreadPoolExecutor$Worker.run(ThreadPoolExecutor.java:617)
    at java.lang.Thread.run(Thread.java:745)


Pete

unread,
Dec 26, 2017, 1:29:12 PM12/26/17
to QuPath users
Oh dear, you're right - I get the same error.  It happens because QuPath is expecting there to be a nucleus ROI and it would use it to figure out how to arrange the object hierarchy.  It shouldn't be this strict, but it seems that it is.

As a workaround, you could try the following:
def detection = new PathCellObject(roi,roi,pathObject.getPathClass())

Unfortunately this will mean that you cell has two ROIs - including a nucleus ROI that is exactly the same as the full cell ROI.  There is another (hack-y) way to fix this:
newDetections.each{it.nucleus = null}
fireHierarchyUpdate()
which will then remove the superfluous nucleus again.

And I think you'll probably want to clean up by removing the original hand-drawn annotations, which you can do by adding
removeObjects(selected, true)
at the end.

All this does seem like quite a lot of work to repurpose the existing commands inside QuPath, which weren't really designed with this specific application in mind.  A preferred solution would be to write a QuPath extension/script that does the automatic detection exactly the way you want.  This would be the QuPath equivalent of writing an ImageJ plugin... so may be a fairly big and challenging project that involves writing code.  I don't know of any QuPath extensions written by others that are publicly available, but I hope that this will happen in time...

micros...@gmail.com

unread,
Dec 27, 2017, 4:30:02 AM12/27/17
to QuPath users
Looks good, I get functional large pathCellObjects that I can run Subcellular spot detection in, which is amazing.  Is there a reason to eliminate the nucleus ROI?  I do not see it show up in the hierarchy at least, though I suppose it does create duplicate measurements when adding area to the cell.  Either way seems to work with subcellular detections.

I went ahead and wrote a test case that works be picking all annotations that are not on the "outside/top" layer so that you can have your tissue annotation drawn (possibly in multiple parts) and then convert all annotations within the largest annotations into detections.  If you don't want to have an outer tissue annotation, the previous script will work fine, though.  This might be more useful for anyone areas out of brightfield tissue samples and running subcellular detection on them.  Playing around with it a little, the speed of running subcellular detection blows away the positive pixel detection, does not run into threshold or divide by 0 problems, and does not seem to run into problems with needing tiling.  It does require slightly more calculations to get the percent positive, but that's fairly trivial at this point.

import qupath.lib.objects.PathCellObject


// Get the current hierarchy
def hierarchy = getCurrentHierarchy()


// Get the select objects

def targets = getObjects{return it.getLevel()!=1 && it.isAnnotation()}


// Check we have anything to work with
if ( targets.isEmpty()) {

   
print("No objects selected!")
   
return
}

// Loop through objects
def newDetections = new ArrayList<>()
for (def pathObject in  targets) {


// Unlikely to happen... but skip any objects not having a ROI
   
if (!pathObject.hasROI()) {
       
print("Skipping object without ROI: " + pathObject)
       
continue
   
}

   
def roi = pathObject.getROI()

   
def detection = new PathCellObject(roi,roi,pathObject.getPathClass())

    newDetections
.add(detection)
   
print("Adding " + detection)
}

removeObjects
( targets, true)

// Actually add the objects
hierarchy
.addPathObjects(newDetections, false)
//Remove nucleus ROI

newDetections
.each{it.nucleus = null}
fireHierarchyUpdate
()
if (newDetections.size() > 1)
   
print("Added " + newDetections.size() + " detections(s)")


Positive pixel detection on results, showing eosin subcellular detections in a large region.


Pete

unread,
Dec 27, 2017, 6:33:10 AM12/27/17
to QuPath users

Looks good, I get functional large pathCellObjects that I can run Subcellular spot detection in, which is amazing.  Is there a reason to eliminate the nucleus ROI?  I do not see it show up in the hierarchy at least, though I suppose it does create duplicate measurements when adding area to the cell.  Either way seems to work with subcellular detections.

The nucleus probably won't do any damage; it's not a separate 'object', so doesn't appear in the hierarchy.  Most objects in QuPath just have one ROI, accessible with getROI().  The main difference with cell objects is that they can optionally have an extra ROI for the nucleus, accessible with getNucleusROI().  Currently, this is mostly just for display - although because it's possible to access the nucleus ROI separately, it would potentially be possible to use it through scripting for other purposes (e.g. to check what is inside it). 

The assumption is that if you call 'getROI()' on a cell then you get the full cell region, not the nucleus only.  Also, getROI() should always return something, but getNucleusROI() is optional.  That's why if you run the cell detection without any cell expansion, you don't get cell objects back... you get detection objects, which just happen to represent nuclei.  I hope that makes some sense...

abou...@stanford.edu

unread,
May 21, 2018, 1:52:53 PM5/21/18
to QuPath users
Hi There - 

Responding to this thread because I am trying something similar in which I use "Cell Detection" and thresholding to automatically detect activated cells in each of three channels and then I am interested in how many cells are activated in one, two or all three channels. What I have done so far is create three ROI polygons and perform the cell detection on the desired channel. I assign each ROI annotation to a class, however, the detection objects do not have any kind of class so the measurement table is difficult to interpret. In addition, I would like to detect overlapping cells and "merge" them if possible. 

Any advice would be most appreciated.

Thank you sincerely.

micros...@gmail.com

unread,
May 21, 2018, 4:47:24 PM5/21/18
to QuPath users
It sounds like you may want to try using a script to handle your classification, which you can find a few of either by searching for classification within the forums or here: https://gist.github.com/Svidro/5b016e192a33c883c0bd20de18eb7764
You will need to change getCellObjects() to something else though if you are not using cells.  Or create your initial set of ROIs and then convert them into cells objects.

If you have a single channel you can use to define your cell ROIs, I would recommend using Subcellular detections to get either an area or an area*intensity measurement for each channel, then classify based off of that.


Once your classifier is set, you should be able to look at the Show Annotation Measurements to get your cell counts, or export the whole set of slides to a single file using Pete's scripts: https://petebankhead.github.io/qupath/scripting/2018/03/05/script-annotation-results-merge.html

fuhy...@gmail.com

unread,
May 22, 2018, 6:21:15 PM5/22/18
to QuPath users
Hi, 

I'm trying to quantify cells labeled in two or three channels too. I opened the pic and annotated it with a rectangle, but when I typed script from http://forum.imagej.net/t/counting-double-labeled-cells-in-fiji/3832/2 and run.there's no reaction. I think QuPath recognizes the functions in the script because the demands became yellow when I entered them. What should I do to count these multiple labeled cells before I run the script? 

Here is the pic I try to count. Thanks!


micros...@gmail.com

unread,
May 22, 2018, 7:06:36 PM5/22/18
to QuPath users
If you have only run exactly the script listed on that page after creating a bounding box, then you do not have any cells to classify.  You need to first create cell objects using Analyze/Cell Analysis/Cell detection or one of it's variants, based on some channel you want to use to define the outlines of your nuclei.

micros...@gmail.com

unread,
May 22, 2018, 7:10:53 PM5/22/18
to QuPath users
Also, if either of you need cell detection across multiple channels, I would recommend using an ImageJ script through the Extensions/ImageJ/ImageJ macro runner to import Analyze Particles results (that can use all channels to generate ROIs) back into QuPath.  Once you have the total area for the cell that way, you can subdivide it using subcellular detections to get areas and intensities.

abou...@stanford.edu

unread,
May 30, 2018, 2:16:24 PM5/30/18
to QuPath users
Hi - Thank you for your response on this issue. I do in fact need cell detection across multiple channels. Can you advise on the script which will allow me to merge cell detection objects across channels and import "Analyze Particles" results back into QuPath?

Thank you.

micros...@gmail.com

unread,
May 30, 2018, 3:30:27 PM5/30/18
to QuPath users
Unfortunately there are too many variables to easily do that sort of thing blindly.  Here is a script I created for a performing "Simple tissue detection" on a single 3 channel TMA core where I knew that the size of the image would be small enough.  You will need to change around the actual ImageJ macro and especially the analyze particles settings.  You will also need to choose to import the objects back into QuPath as detections, not an ROI/overlay (annotation).  Pete wrote this macro initially, so he might have a better idea of how to set the parameters to get the same effect as the checkboxes in the ImageJ macro runner within QuPath.  Also, if I recall correctly, you may need to play with the Analyze particles settings to make sure they generate an overlay, as overlays are what can be imported as detection objects.

//Adjust downsample if ImageJ macro runner generates area size errors.

double downsample = 1

createSelectAllObject
(true);
import qupath.imagej.plugins.ImageJMacroRunner
import qupath.lib.plugins.parameters.ParameterList

// Create a macro runner so we can check what the parameter list contains
def params = new ImageJMacroRunner(getQuPath()).getParameterList()
print ParameterList.getParameterListJSON(params, ' ')

// Change the value of a parameter, using the JSON to identify the key
params.getParameters().get('downsampleFactor').setValue(downsample)
print ParameterList.getParameterListJSON(params, ' ')

// Get the macro text and other required variables
def macro = 'run("8-bit");run("Gaussian Blur...", "sigma=4");setOption("BlackBackground", true);setAutoThreshold("Default");run("Threshold...");setThreshold(1, 255);run("Convert to Mask");run("Fill Holes");run("Close");run("Dilate");run("Dilate");run("Dilate");run("Dilate");run("Dilate");run("Dilate");run("Erode");run("Erode");run("Erode");run("Erode");run("Erode");run("Erode");run("Analyze Particles...", "size=1000-Infinity add");roiManager("Select", 0);run("Send ROI to QuPath");close();'
def imageData = getCurrentImageData()
def annotations = getAnnotationObjects()

// Loop through the annotations and run the macro
for (annotation in annotations) {
   
ImageJMacroRunner.runMacro(params, imageData, null, annotation, macro)
}
print 'Done!'
annotations
= getAnnotationObjects();
removeObject
(annotations[0], true)


Reply all
Reply to author
Forward
0 new messages