Skip to first unread message

Pritpal Bedi
Mar 13, 2013, 7:25:40 PM3/13/13
to qtcon...@googlegroups.com
Hello Everybody
Uploaded is new installer QtContribs_Mingw-461_Qt-483_r187_Setup.exe.
This installer includes a very important feature in HbIDE, viz., to view a map
of functions usage contained in one or multiple projects, in a useful viewable
format which has the ability to open and place edit cursor exactly where it
belongs to.
This important feature is explained in these commit:
2013-03-13 15:28 UTC-0800 Pritpal Bedi (bedipritpal at hotmail.com)(r185)
* hbide/findreplace.prg
! Fixed: not to consider lines starting with
METHOD, ACCESS, ASSIGN, MESSAGE in CLASS definitions.
% Refined: Functions Map layout.
Now it shows out like this, publishing the call with arguments:
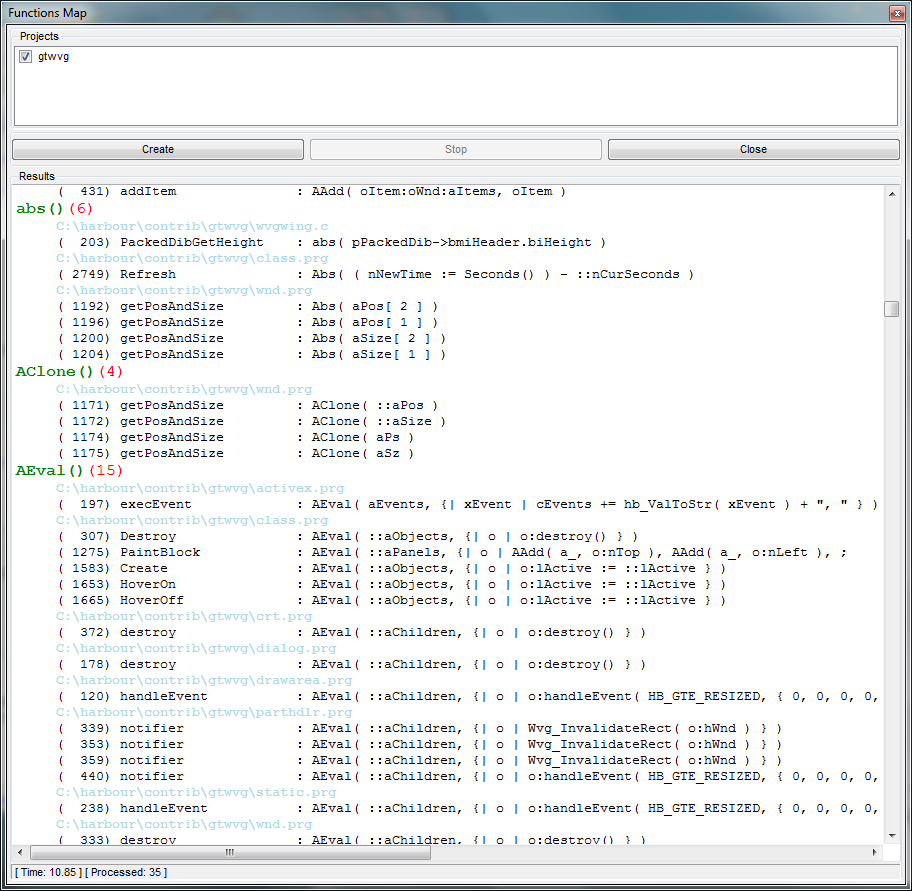
Alert()(10)
E:\harbour\addons\hbdbu\dbu.prg
( 282) exit : Alert( "Exit HbDBU ?", { "Yes", "No" } )
( 329) setDatabaseParams : Alert( "Could not Connect to Cache Server" )
( 429) saveMyTable : Alert( { cTable + ", already exists!", "DO you want to overwrite it ?" }, { "No", "Yes" }, , , "WARNING : Table could be Overwritten" )
( 448) saveMyTable : Alert( cTable + " : has been created successfully!" )
It helps to locate certain instances of wrongly passed arguments.
2013-03-12 15:10 UTC-0800 Pritpal Bedi (bedipritpal at hotmail.com)(r184)
+ hbide/resources/map.png
* hbide/hbide.qrc
+ Added: map.png.
+ hbide/functionsmap.ui
* hbide/hbide.hbp
+ Added: functionsmap.ui
* hbide/main.prg
+ Implemented: Printing option to <Show Code Fragment> window
which can be activated via context menu of <Functions List>.
Press CTRL+P when <Show Code Fragment> dialog is in focus.
A Print Preview dialog will be opened containing the printable
pages which, in turn, can be printed as per choice.
* hbide/edit.prg
* hbide/editor.prg
+ Implemented: printing of selected text.
How It Works:
============
1. Select the text by mouse or keyboard.
2. Right-Click to activate context menu.
3. Select <Show Selected Text>
4. A stay-on-top code-fragment window will be opened
containing the selected text.
5. Press CTRL+P to activate print preview dialog.
* hbide/actions.prg
* hbide/docks.prg
* hbide/misc.prg
* hbide/object.prg
+ Added: components to activate and manipulate feature
IdeFunctionsMap() (Read Below).
Will be referred as <Functions Map> in subsequent context.
* hbide/findreplace.prg
+ Implemented: CLASS IdeFunctionsMap()
<Functions Map> is a tool to view/print the functions usage
given a .hbp project or a combinations of .hbp projects.
It obtains a map of functions as:
1. Where they are defined, with arguments, if possible.
2. And from Where they are called, with source/function/line numbers.
It empowers a developer to optimize his/her source code,
to isolate functions which are never called, to determine
why a function is called so many times in a single function
or source, etc. Developers imagination is the limit as to
how this tool can be used to his advantage.
How It Works:
============
1. Click on <Functions Map> icon on the main toolbar.
Alternatively click <Main Menu><View><Docking Widgets><Functions Map>.
2. A docking widget will appear on the right docking area.
3. On the top, a selectable list of all projects visible in
<Projects Tree> will appear.
4. Select the projects for which to obtain Funtions Map.
5. Click on <Create> push-button visible right under projects
selection list.
6. The stat will start appearing in the lower edit control.
7. You can click on <Stop> push button anytime during the process.
8. After all source files will be processed, real-time map entries
will start appearing in the editor.
9. Have patient, it may take some time, depending upon the project(s)
size in terms of number of lines processed.
10.Once the map is complete, scrolling entries will stop to appear,
navigate the editor. Right-click context menu is avialble for
further options.
11.Double-clicking on a entry will open the relevant source,
positioning the cursor on relevant portion of the line.
The map is divided in two parts.
1st part shows the functions which have been called at least once.
2nd part shows only those functions which have never been called.
It make it easier to investigate sources.
These assumptions are relevant to this process:
1. Functions called in macros do not makeup to the map.
2. Function call is determined with this regular expression:
"\b[A-Za-z0-9_]+ ?(?=\()"
( Please shout if it is wrong ).
3. Commands are not parsed to functions and hence do not make up in map.
4. Only CLASS declation is considered as function, methods are not
taken into account.
5. No seperation id made for STATIC and PUBLIC functions, both
make up to the map.
6. Multi-line, single-line, in-line ( only at the end with // and && ) remarks
are left untouched.
Layout of Mapped Entries:
========================
Function contained the project(s) sources ( 1st Section ):
DecryptPass( cStr, nMode )(6) Prototype, times called.
(4) E:\Laptop-Vouch32\dev_sources\qdbu\dbumisc.prg Line#, Source Name CLICKABLE
E:\harbour\addons\hbdbu\dbu.prg Called-in Source
( 362) openConnections( aConxns ) Line#, Function called from CLICKABLE
( 362) openConnections( aConxns ) .
( 363) openConnections( aConxns ) .
( 363) openConnections( aConxns ) .
( 368) openConnections( aConxns ) .
( 369) openConnections( aConxns ) .
Function not contained in the sources but called ( 1st Section ):
DbuMGR()(1) Function w/out prototype, times called
E:\harbour\addons\hbdbu\dbu.prg Called-in Source
( 95) Main( ... ) Line#, Function called from CLICKABLE
Function contained in the source(s) but not called ( 2nd Section ):
Main( ... ) Prototype
(85) E:\harbour\addons\hbdbu\dbu.prg Line#, Source Name
How the Feature was conceived:
=============================
The other day, my manager asked me if we have some utility which can be used
to isolate those functions which are not being called any-more. The idea was
to optimize the huge application developed constantly in-house since 23+ years,
from Clipper to (x)Harbour. I posted the request on Harbour-devep list. Single
reply from Tamas was difficult to use plus was not satisfying what I wanted.
So, I thought, why not HbIDE should have this feature, and result is satisfying.
Your opinion and suggestions will matter.
Give it a try and you will discover a new way to optimize your application. This feature is
compiler independent, so everybody can take use of it.
And this is the image of one page-ful of contents:
Pritpal Bedi
a student of software analysis & concepts
Reply all
Reply to author
Forward
0 new messages