jackknifing PCoA plots
316 views
Skip to first unread message

Will Overholt
Feb 9, 2011, 2:47:35 PM2/9/11
to Qiime Forum
Dear Qiime_Forum,
I'm having problems getting 2D and 3D PCoA plots to display any kind
of jackknifing support. I've tried running the make_ND_plots.py
scripts on a folder containing multiple prinicipal coordinate files
(the result of running multiple_rarefactions_at_even_depth.py,
followed by running the beta_diversity.py script on the multiple
rarefied OTU tables, followed by generating principal coordinates on
the beta_diversity output folder). When I try and run the
make_2d_plots.py script on the folder, I get the following output
(I've only pasted a subset of the numbers):
kostka@T3500-Ubuntu:$ make_2d_plots.py -i rarefied_2400/
multiple_PCos_wunifrac -m aem_map.txt -k white -o rarefied_2400/
multiple_2dplots_wunifrac --ellipsoid_opacity=1 --
ellipsoid_method=IQR
[ 3.30960968e+01 1.75233856e+01 1.50471707e+01 6.79681018e+00
5.66340235e+00 5.11786656e+00 4.12700257e+00 2.23223796e+00
2.08511878e+00 1.34187045e+00 1.07384993e+00 9.31179543e-01
6.94751125e-01
...
kostka@T3500-Ubuntu:$
When I open the html file, the plots look exactly the same as if I
averaged the distance matrices and plotted those. Is this what the
script is supposed to output? And whats the point of the two --
ellipsoid variables then?
I also tried running the jackknifed_beta_diversity.py scripts, which
gives the exact same plot in both 2D and 3D forms.
Heres the output from print_qiime_config.py:
System information
==================
Platform: linux2
Python version: 2.6.5 (r265:79063, Apr 16 2010, 13:57:41) [GCC
4.4.3]
Python executable: /usr/bin/python
Dependency versions
===================
PyCogent version: 1.5.0
NumPy version: 1.3.0
matplotlib version: 0.98.5.2
QIIME library version: 1.2.0
QIIME script version: 1.2.0
PyNAST version (if installed): 1.1
Denoiser version (if installed): Not installed.
QIIME config values
===================
blastmat_dir: None
rdp_classifier_fp: /home/kostka/qiime/Qiime2/software/
rdp_classifier/rdp_classifier-2.0.jar
template_alignment_lanemask_fp: /home/kostka/qiime/Qiime2/
lanemask_in_1s_and_0s
cluster_jobs_fp: None
pynast_template_alignment_fp: /home/kostka/qiime/Qiime2/
core_set_aligned.fasta.imputed
seconds_to_sleep: 60
pynast_template_alignment_blastdb: None
pyronoise_data_fp: None
jobs_to_start: 1
qiime_scripts_dir: /home/kostka/qiime/Qiime2/bin/
working_dir: /home/kostka/qiime/Projects
python_exe_fp: python
temp_dir: None
blastall_fp: /home/kostka/qiime/Qiime2/software/
blast-2.2.22/bin/blastall
Am I doing something wrong or do I need to wait for a newer stable
release to come out before using these features?
Thanks for you time,
Will

Jesse Stombaugh
Feb 9, 2011, 2:51:52 PM2/9/11
to qiime...@googlegroups.com
Hello Will,
It is possible that the support is so strong that the ellipsoids are extremely small. If you zoom in on a specific point in the 3d plots or 2d plots and see a small transparent ellipsoid around each point, this is the reason. Let me know if this is the case and if not, we can try addressing some other possible issues.
-Jesse
--
Jesse Stombaugh, Ph.D.
Research Associate
University of Colorado, Boulder
Jesse Stombaugh, Ph.D.
Research Associate
University of Colorado, Boulder
Will Overholt
Feb 9, 2011, 3:08:19 PM2/9/11
to Qiime Forum
Hey Jesse,
You are absolutely right, the ellipsoids are there.
Thanks for the quick response!!
Best,
Will
You are absolutely right, the ellipsoids are there.
Thanks for the quick response!!
Best,
Will

Ivy Yang
Dec 11, 2013, 10:45:39 AM12/11/13
to qiime...@googlegroups.com, jesse.s...@colorado.edu, jisto...@gmail.com
Hi,
I just got a follow-up question regarding to the ellipsoid opacity.
I modified the command lines so I had 100 rarefied files each sampled 500 sequences. I did all the beta_diversity, upgma, pcoa steps and got the 2D graph. Here is the command line I typed in
qiime@qiime-VirtualBox:~/Desktop/Shared_Folder/fpnor4truncatewithnewversion$ make_2d_plots.py -i beta_div_weighted_pcoa_results -m fpivy.txt -b 'Treatment,StudentName' -o beta_div_PCOA_2D --scree
So I was using the default ellipsoid opacity = 0.33 and method = iqr.
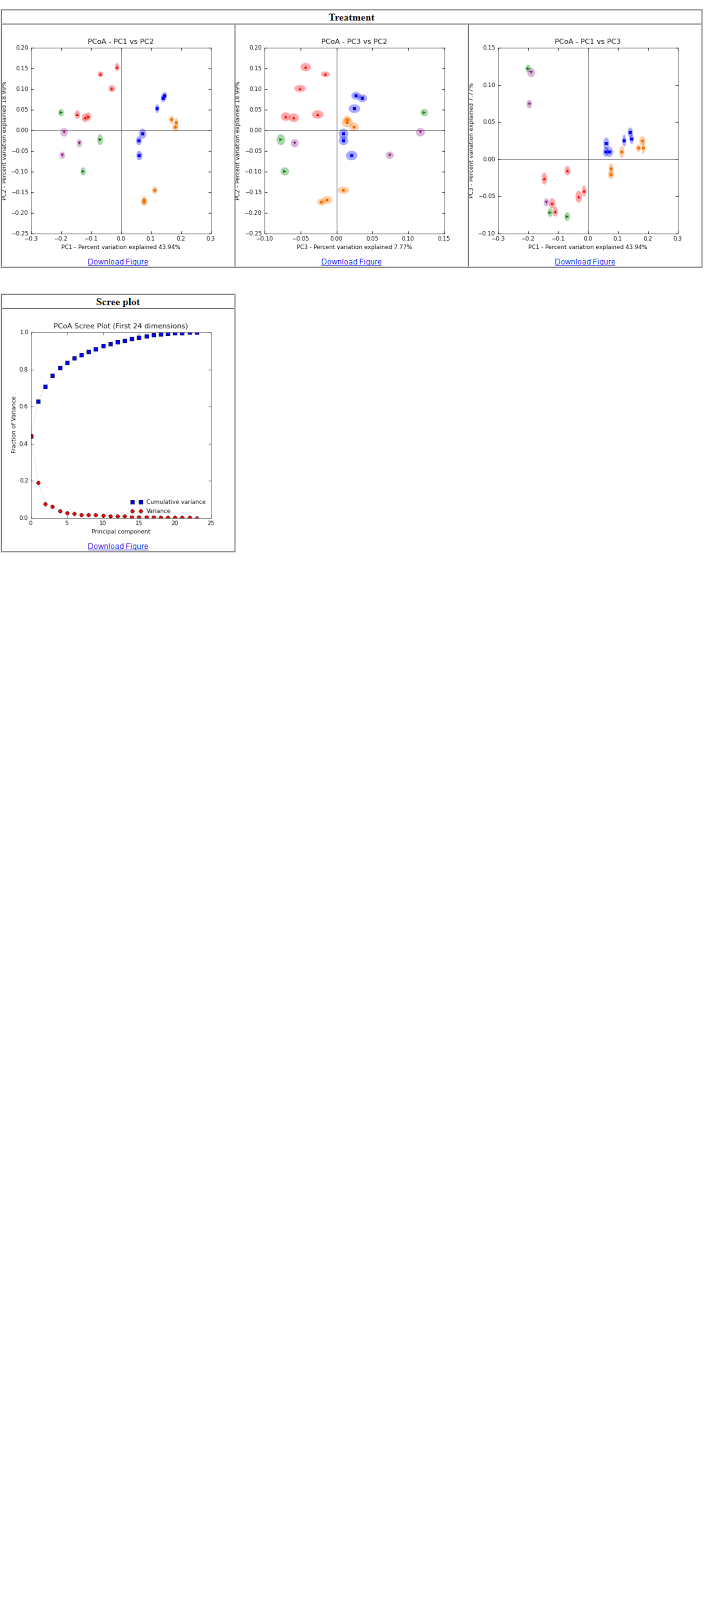
My question is, what exactly does ellipsoid opacity mean? Is it referred to the variation within the 100 rarefied files? or in other words,is it fare to say 'an ellipsoid with larger shadow has greater variation within that 100 rarefied files'? What do I need to specify a value or use the default value for that? I attached a screen shot of my 2d plot.
My second question is, is there anyway to plot the 4th pcoa?
My second question is, is there anyway to plot the 4th pcoa?
Thanks a lot!
Ivy

Luke Ursell
Dec 11, 2013, 10:49:09 AM12/11/13
to qiime...@googlegroups.com
Hi,
Ellipsoid opacity just means how dense you want that cloud to be surrounding your points when you are running those rarified beta diversity plots. The size of clouds demonstrates how variable the beta diversity is for that sample.
Also see the Emperor program (www.qiime.org/emperor) for an updated visualization program.
Luke
--
---
You received this message because you are subscribed to the Google Groups "Qiime Forum" group.
To unsubscribe from this group and stop receiving emails from it, send an email to qiime-forum...@googlegroups.com.
For more options, visit https://groups.google.com/groups/opt_out.

Tsung-Hao Lu
Feb 5, 2020, 5:31:44 AM2/5/20
to Qiime 1 Forum
I met a problem when I wanted to draw ellipsoid in the PcoA plots.
I followed the scripts but at the end I got the results like this.
I'm wondering if anyone knows how to fix this?
I want to have two ellipsoids to cluster two groups in the experiment.
May anyone help me out?
Lu
Reply all
Reply to author
Forward
0 new messages