Skip to first unread message

Prasanth S
Sep 12, 2017, 4:19:20 AM9/12/17
to Qiime 1 Forum
Hi,
We have two distance matrices for 6 subjects collected from "n" and "0" (say) .Our requirement is to create a 3D plots for procrustes analysis from this matrices using emperor.
we only have these matrices data available. We don't have any data for Barcodesequence, LinkerPrimerSequence,DOB,Treatment & Description. How we can proceed with this data to perform procrustes analysis.? Please help
Matrix_1 for "n":
1_n 2_n 3_n 4_n 5_n 6_n
1_n 0 0.3571579109 0.2243945249 0.3497900415 0.4904549333 0.339626282
2_n 0.3571579109 0 0.3606127292 0.4474355808 0.5343987341 0.3855148557
3_n 0.2243945249 0.3606127292 0 0.2543794679 0.3797520547 0.2933860357
4_n 0.3497900415 0.4474355808 0.2543794679 0 0.2300678446 0.2745535548
5_n 0.4904549333 0.5343987341 0.3797520547 0.2300678446 0 0.2930452708
6_n 0.339626282 0.3855148557 0.2933860357 0.2745535548 0.2930452708 0
Matrix_2 for "O":
1_0 2_0 3_0 4_0 5_0 6_0
1_0 0 0.0272716574 0.0296064573 0.5642054462 0.4580837086 0.5611546895
2_0 0.0272716574 0 0.0168651113 0.5755955941 0.4654149449 0.5660451122
3_0 0.0296064573 0.0168651113 0 0.5707971681 0.4602898962 0.5627154804
4_0 0.5642054462 0.5755955941 0.5707971681 0 0.2439560879 0.2858049466
5_0 0.4580837086 0.4654149449 0.4602898962 0.2439560879 0 0.2693592553
6_0 0.5611546895 0.5660451122 0.5627154804 0.2858049466 0.2693592553 0

Jenya Kopylov
Sep 12, 2017, 5:39:49 AM9/12/17
to Qiime 1 Forum
Hi Prasanth,
You may find this tutorial useful for Procrustes analysis in QIIME here?
Otherwise, as mentioned in this post, you can leave the columns for the mentioned metadata fields empty (though the column name should exist) and visualization should work.
Let us know if Emperor throws any errors,
Jenya
Prasanth S
Sep 12, 2017, 6:01:11 AM9/12/17
to Qiime 1 Forum
Hi Jenya Kopylov,
Thank you for your response.
we already did like this but we can't able to identify the two different samples from the plot.
SInce the samples in the two matrices are different the emperor is showing error.We created a sample_ID map as follows to compare the subjects from two different matrices.
Sample_id
1_n =1
2_n=2
...
1_0=1
2_0=2
...
In our output we are getting a bar between two subjects with two spheres at the end.
For example
in the case of subject "1"
we are getting a bar with one end "1_0" and the other end "1_1".
what is this " _0" and "_1" indicating??
How we can identify the two sample category from the plot??
In labels also its showing like this only. How we can customize with emperor?

Yoshiki Vázquez Baeza
Sep 12, 2017, 2:38:13 PM9/12/17
to Qiime 1 Forum
Dear Prasanth,
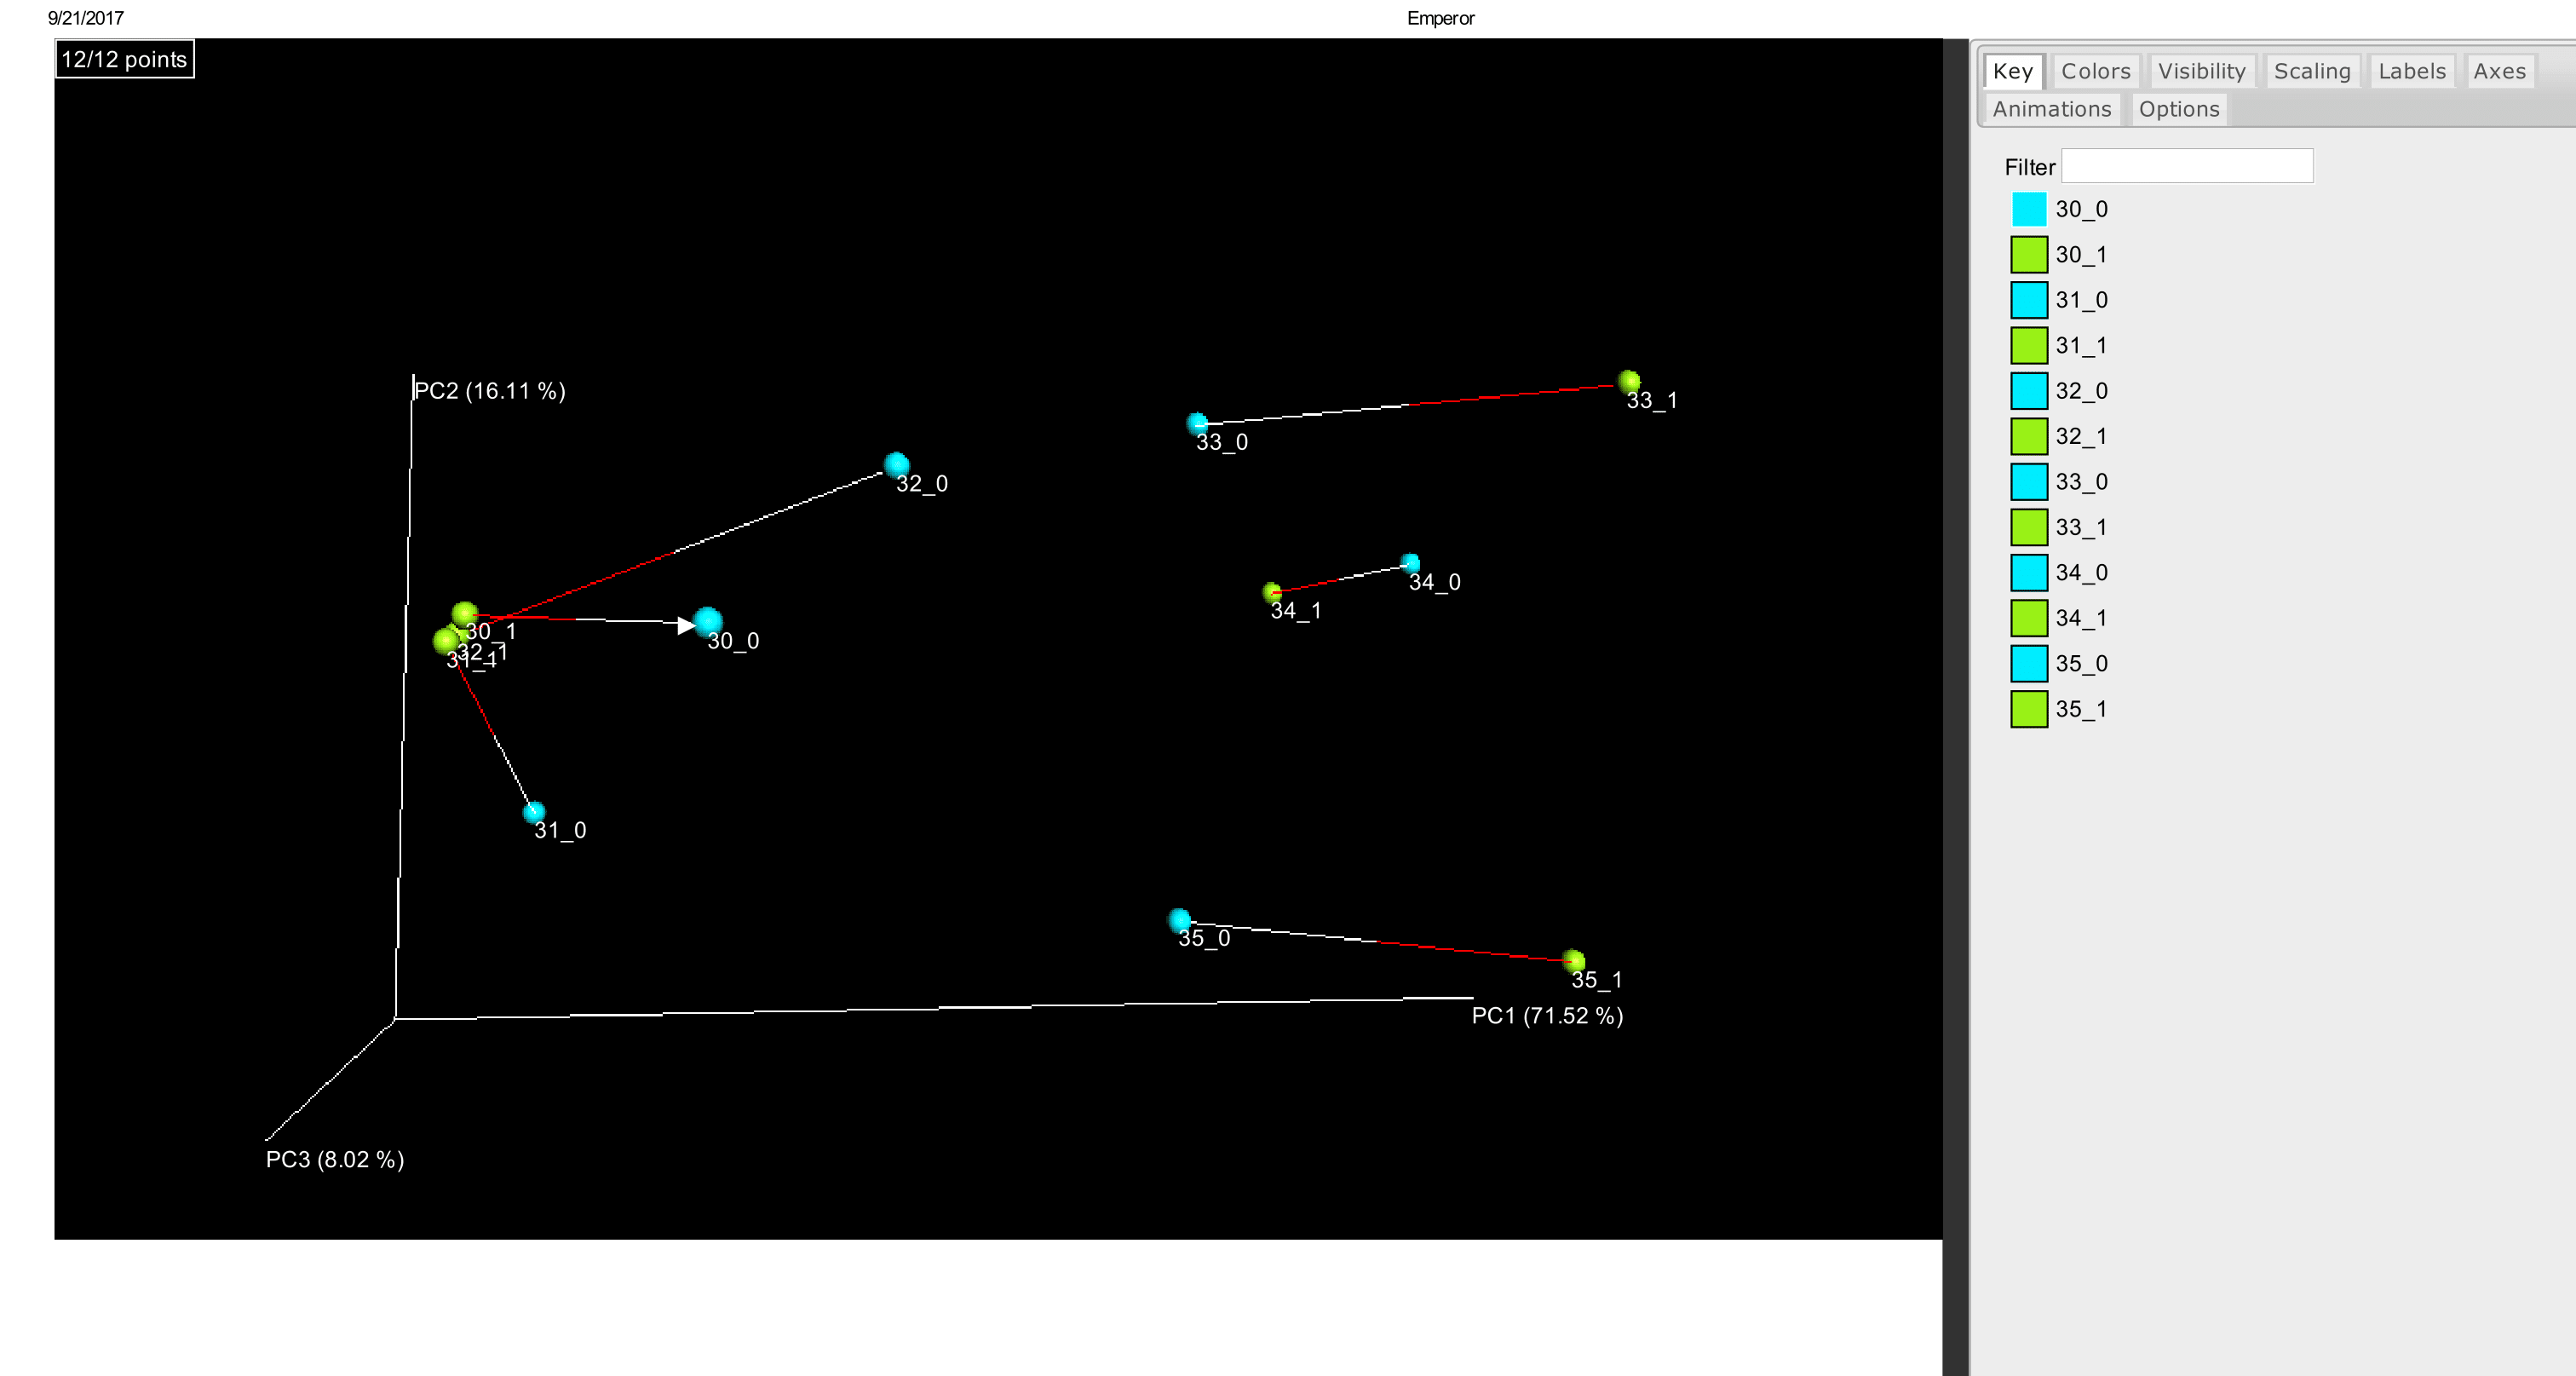
To answer your question, to answer this question, you can look at the Options tab, where there's an "edge color selector A" input and and "edge color selector B" input. By default A will be colored white and B will be colored red.
If you look at the Key tab, you'll see that your samples are suffixed with _0 and with _1, the samples suffixed with _0 are on the white end, and the samples suffixed with _1 are on the red end.
The order of these is as provided in the make_emperor.py command.
Thanks!
Yoshiki.
Prasanth S
Sep 13, 2017, 12:55:07 AM9/13/17
to Qiime 1 Forum
Hi Yoshiki,
Thanks for the reply. Our main issue is how to create a mapping file for this input matrices.
we have created a sample_id map like this for transforming the pcoa matrices
Thanks for the reply. Our main issue is how to create a mapping file for this input matrices.
we have created a sample_id map like this for transforming the pcoa matrices
Sample_id
1_n =1
2_n=2
...
1_0=1
2_0=2
1_n =1
2_n=2
...
1_0=1
2_0=2
Do we need to create a sample_id map like this?
we are very new to this platform? we only have this matrix data , no other information's available. Please help
here we are attaching a sample plot .We have to present like this
Thanks
Prasanth
we are very new to this platform? we only have this matrix data , no other information's available. Please help
here we are attaching a sample plot .We have to present like this
Thanks
Prasanth
Yoshiki Vázquez Baeza
Sep 13, 2017, 12:59:05 AM9/13/17
to Qiime 1 Forum
Dear Prasanth,
Procrustes analysis in Emperor, is intended to be used only with matching samples, meaning that you only use one mapping file which describes the samples contained in all the coordinates files.
If the first coordinate file includes samples A, B and C, the second coordinates file should include samples A, B and C as well. Therefore the mapping file only needs to describe the samples A, B and C.
Thanks!
Yoshiki.
Prasanth S
Sep 13, 2017, 2:38:20 AM9/13/17
to qiime...@googlegroups.com
HI Yoshiki Vázquez Baeza,
Thanks again for your reply
As you said
Thanks again for your reply
As you said
"The order of these is as provided in the make_emperor.py command."
How can we give order,since we can only give the file path?
My folder conataind transformed files for both "n" and "o".
How make_emperor taking these files ? by alphabetic order or they are taking the first one in the folder then second??
Thanks
Prasanth
My folder conataind transformed files for both "n" and "o".
How make_emperor taking these files ? by alphabetic order or they are taking the first one in the folder then second??
Thanks
Prasanth
Yoshiki Vázquez Baeza
Sep 13, 2017, 4:24:24 PM9/13/17
to Qiime 1 Forum
Hello,
If the filenames in the folder you have are numbered with an underscore and a number, the number will be used to sort the files.
For example coordinates_0.txt, coordinates_1.txt will make it such that the data in _0 will be first and the data in _1 will be the second (with the order as described above).
Thanks!
Yoshiki.
Prasanth S
Sep 20, 2017, 11:09:30 AM9/20/17
to Qiime 1 Forum
Hi Yoshiki Vázquez Baeza,
Thanks for the reply. It was very helpful.
we have few more doubts regarding this.
1) How we can change the colour of spheres?
example:- In our plot for two transformed pcoa values from samples "0" and "1" ,the subjects "A" ,"B" and "C" are connected as follows.
A_0----------------A_1
B_0----------------B_1
C_0----------------C_1
we need to colour all "_0" in one colour and "_1" to other colour. How it is possible? Colour by option is not working since we only have sample id values.No other informations available.
Please help.
Yoshiki Vázquez Baeza
Sep 20, 2017, 1:06:01 PM9/20/17
to Qiime 1 Forum
Hello,
This is currently not possible in Emperor, since all pairs of samples share metadata, so they are all the same color.
Thanks!
Yoshiki.
Prasanth S
Sep 21, 2017, 3:23:37 AM9/21/17
to qiime...@googlegroups.com
Hi Yoshiki,
Thanks again for your valuable reply.
We got the graphs. Now as part of the publication purpose,we need to convert this to a png file. But after converting it, the image don't have that much clarity.
We first convert it into pdf and then convert it to png. But we are not getting clarity images.
How you people are presenting this 3D images on your publications?? Please help.
Thanks
Prasanth
| |
Yoshiki Vázquez Baeza
Sep 21, 2017, 1:13:17 PM9/21/17
to Qiime 1 Forum
Hello,
You can save the plot as an SVG file (see the Options tab) and then convert that SVG file to whatever format you want using Inkscape, for example:
inkscape -f figure_example.svg -A figure_example.pdf
You could also do that using Inkscape's GUI.
Thanks!
Yoshiki.
Reply all
Reply to author
Forward
0 new messages