Visible seam between VIIRS granules

Isaac Wilmur
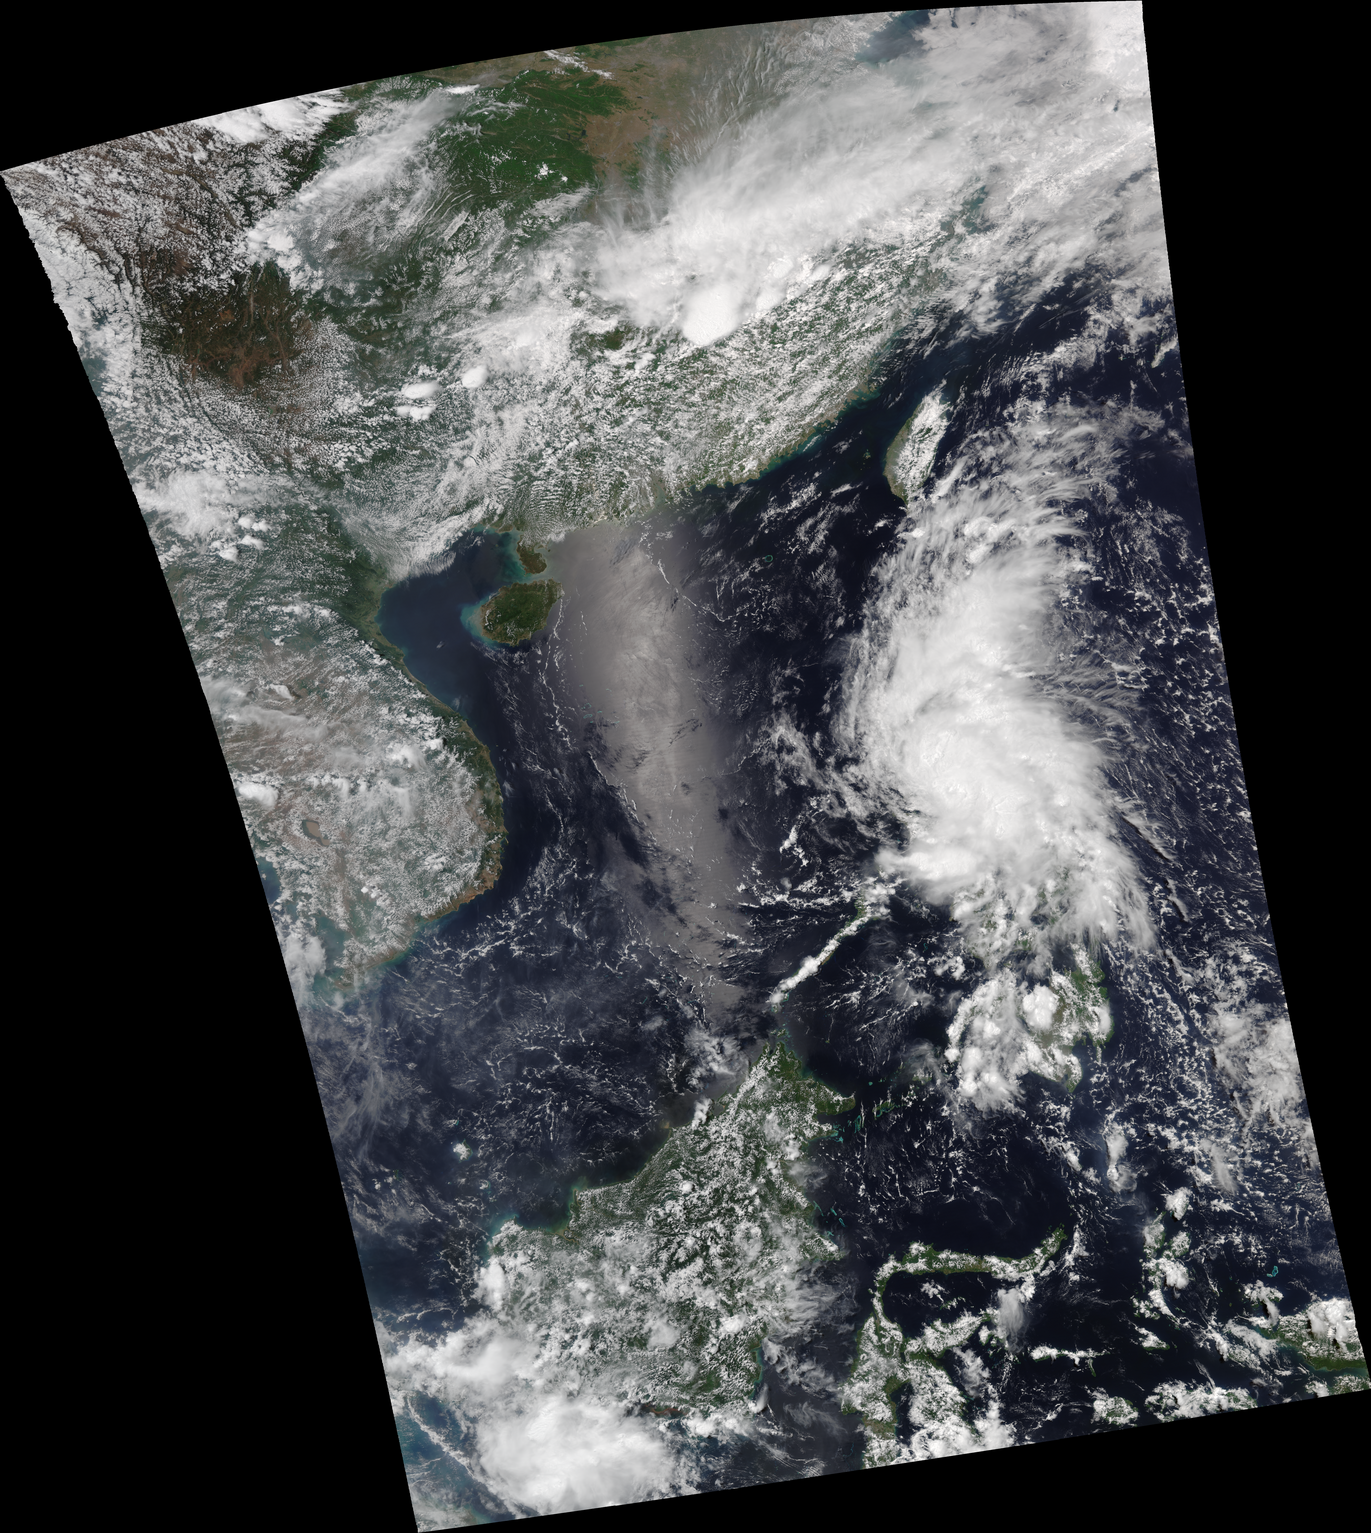
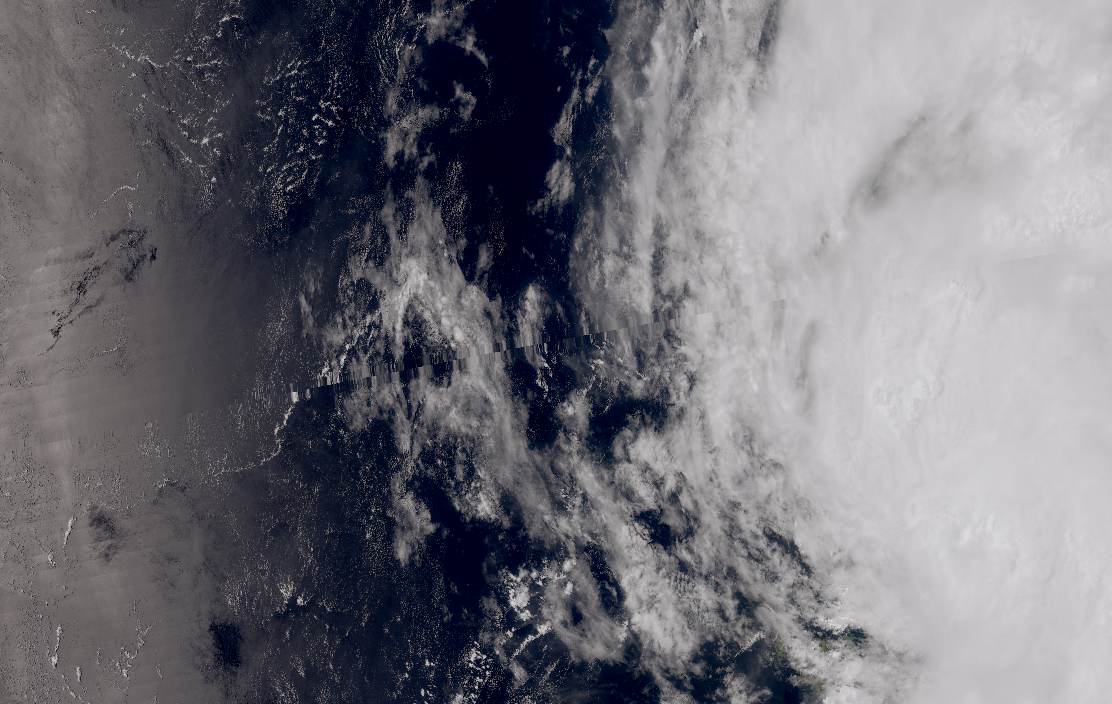
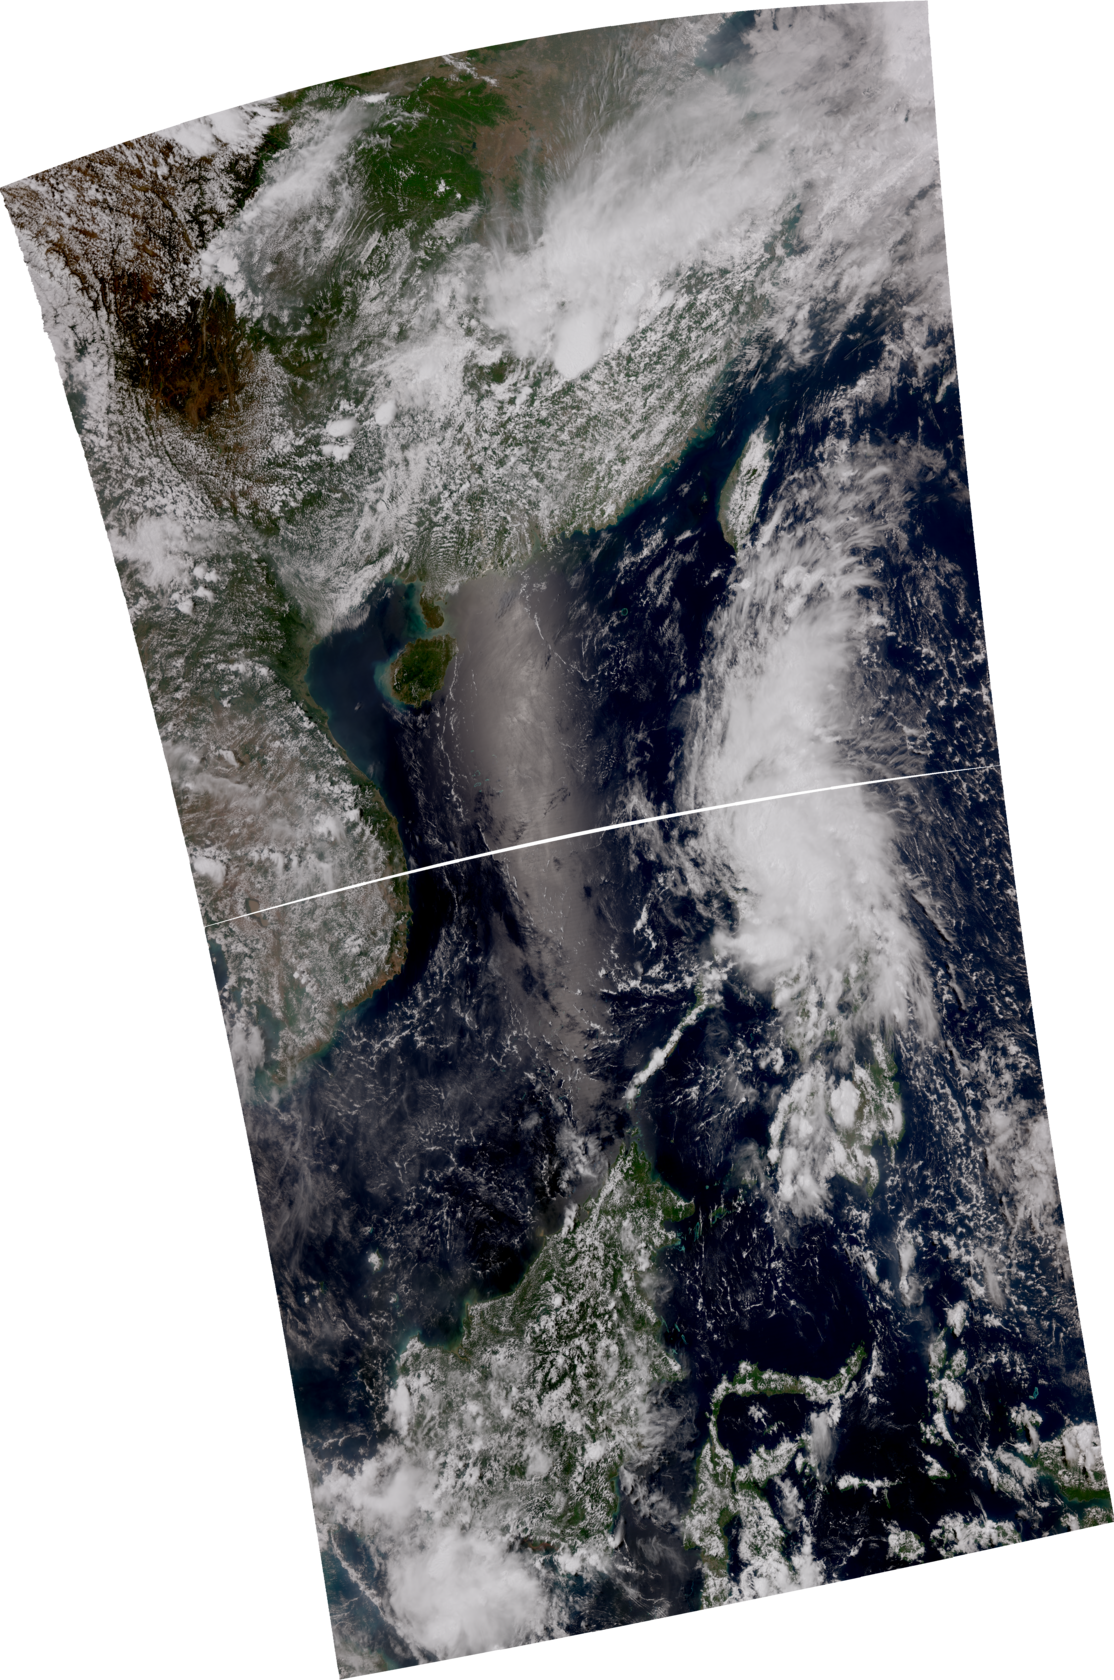
When attempting to combine data between two VIIRS granules using satpy there appears to be a gap inbetween, see image below
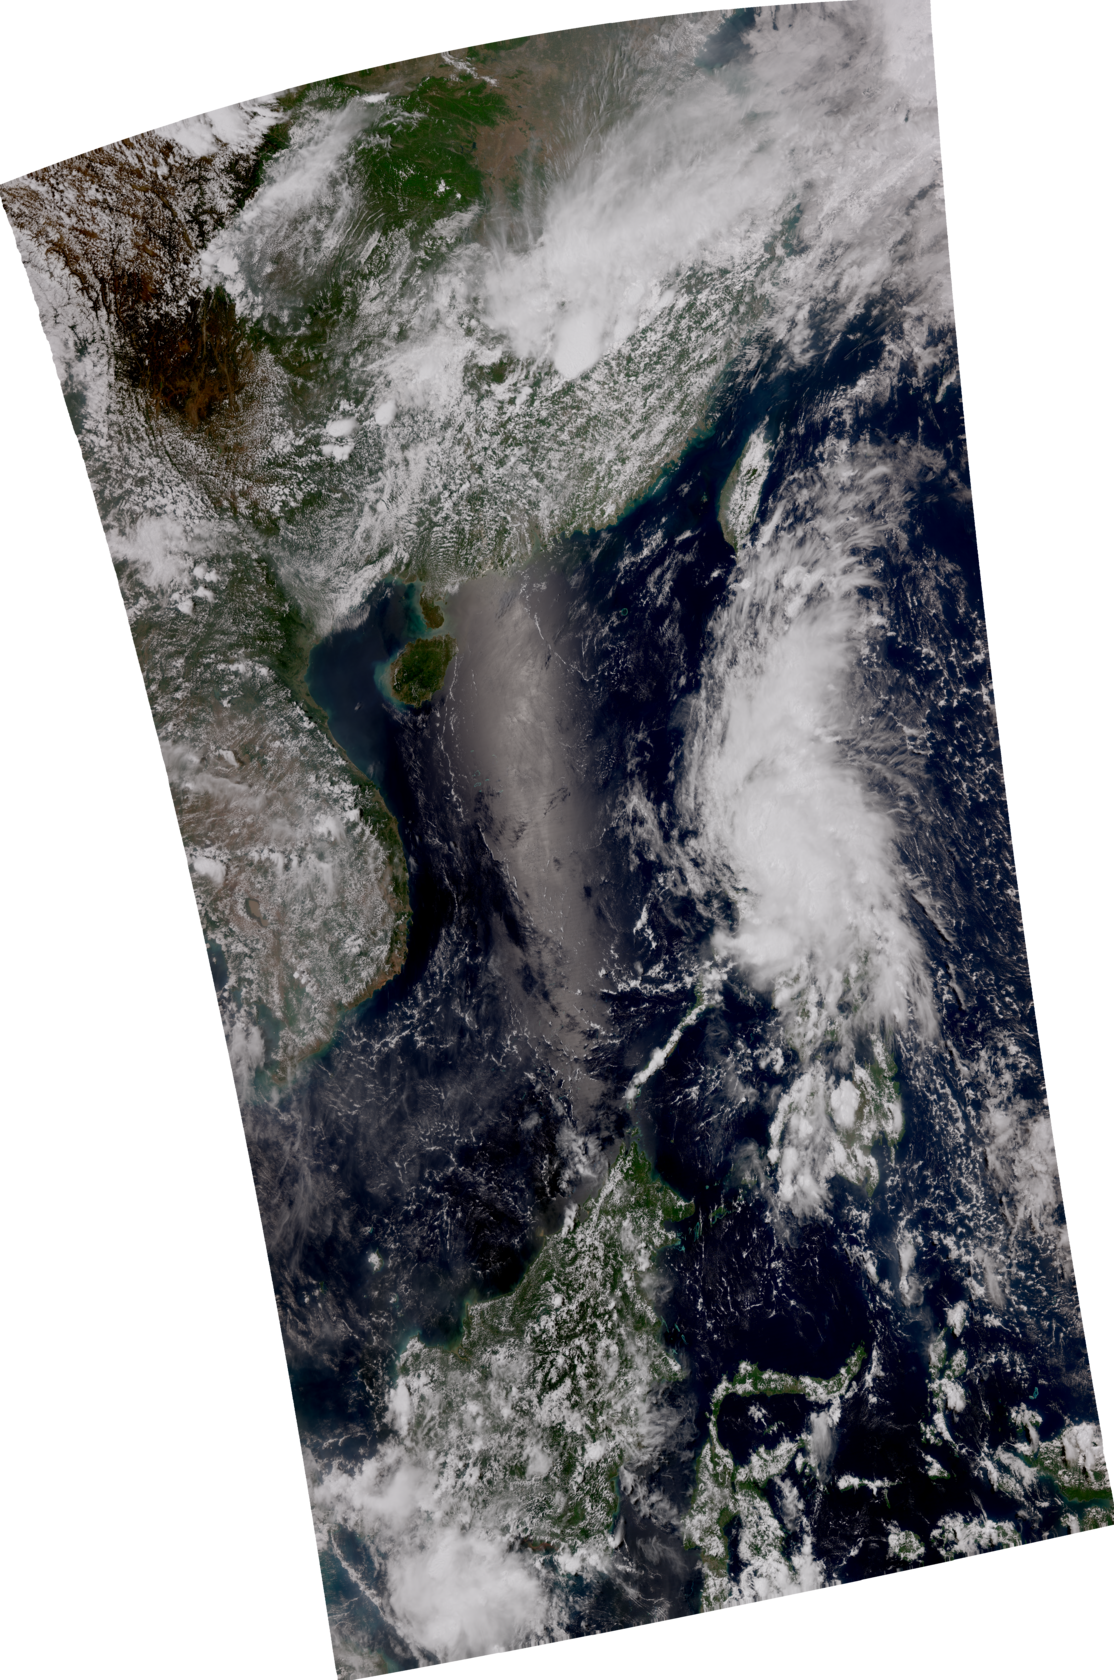
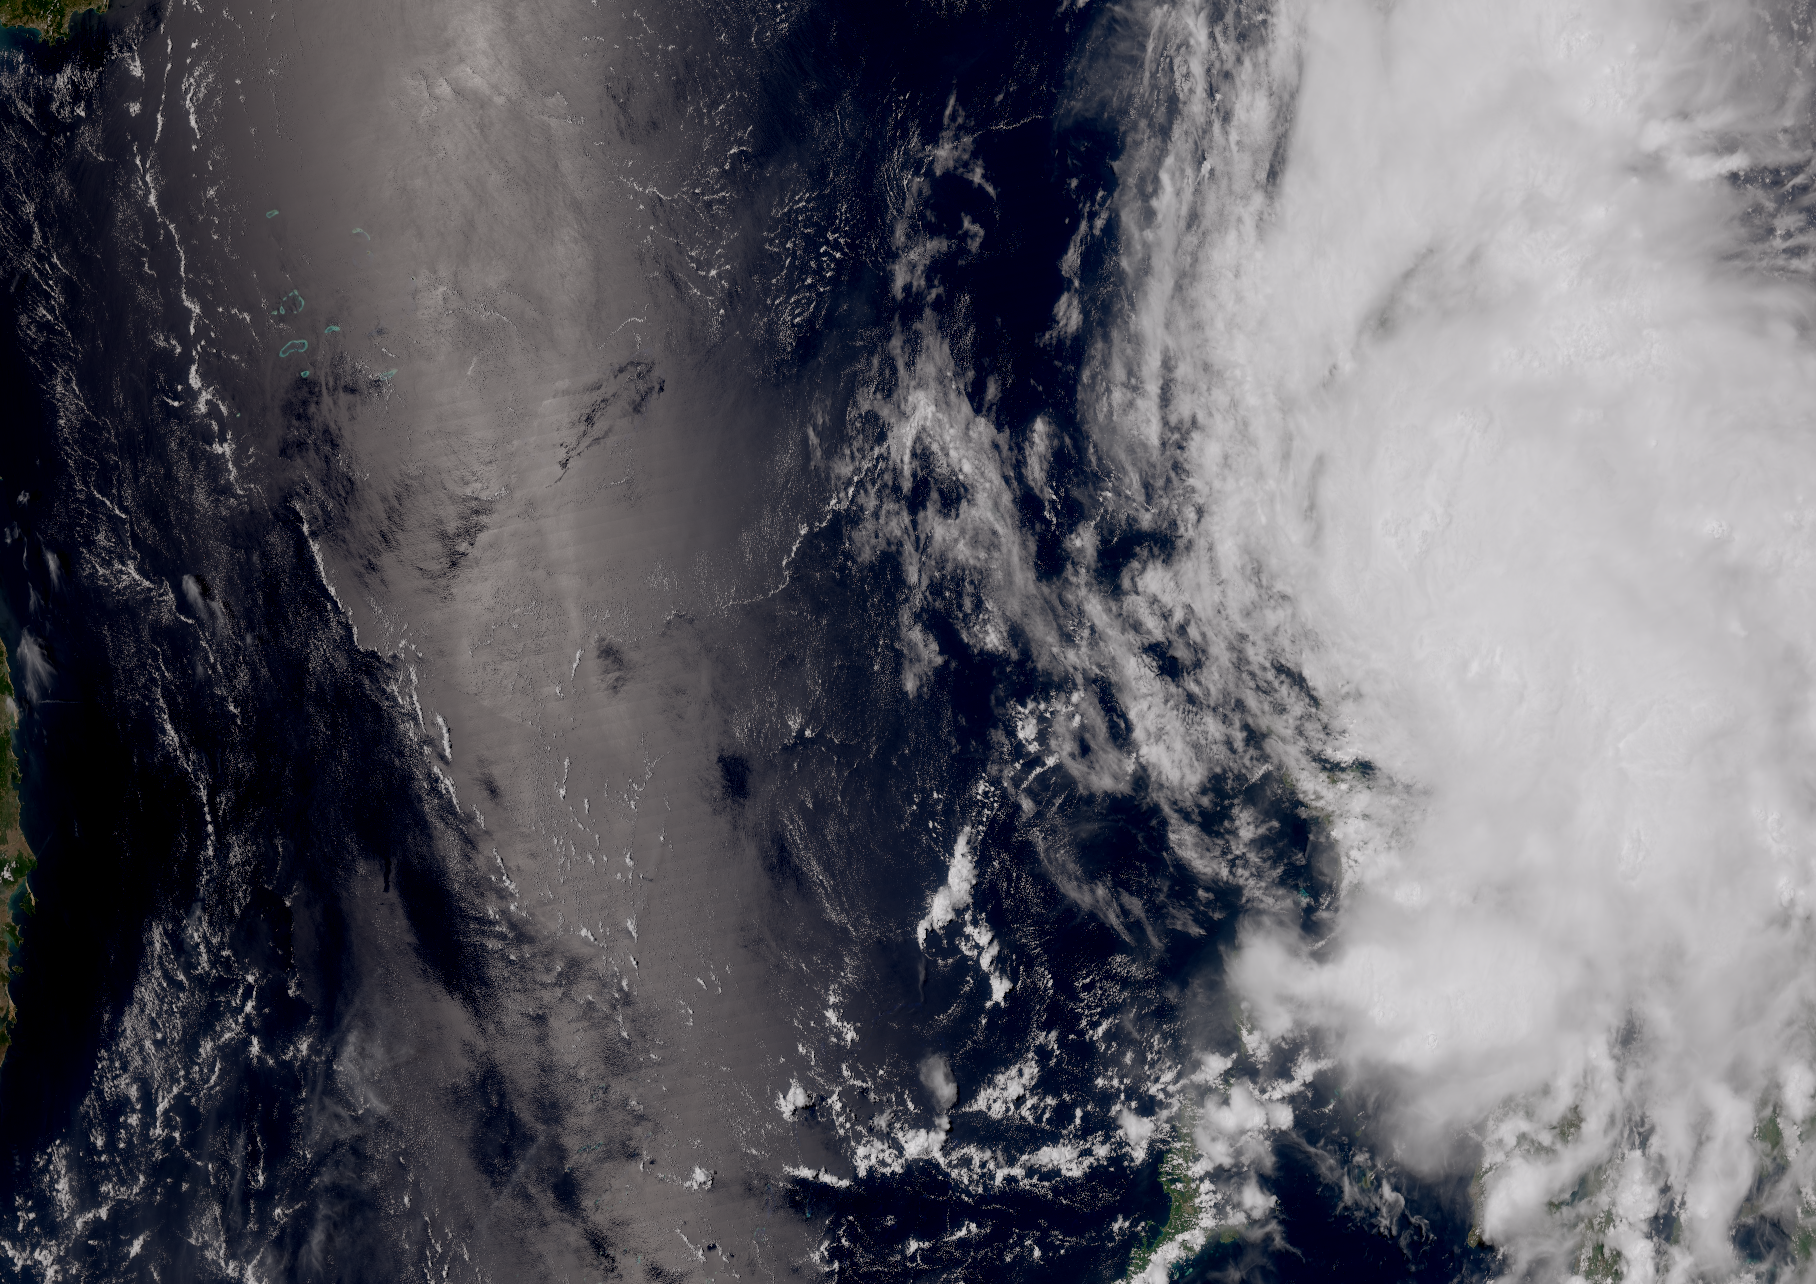
Another image generated by Polar2grid doesn't have this problem
Below is the running scripts and related images, any help would be much appreciated.
Thanks,
Isaac

Adam Dybbroe
Isaac,
Could it be that there actually is a missing scan (or part of a scan) in one of the granules and that the resampling in Polar2grid interpolates/fills out the missing part?
Can you check how many scans you have in each granule?
What happens if you increase the search radius (from the default - whatever that is here in this case?) when resampling? I am not very familiar with the EWA resampler, but with the nearest neighbour and bilinear resamplers you can set the search radius via the radius_of_influence attribute.
-Adam
--
You received this message because you are subscribed to the Google Groups "pytroll" group.
To unsubscribe from this group and stop receiving emails from it, send an email to pytroll+u...@googlegroups.com.
To view this discussion on the web, visit https://groups.google.com/d/msgid/pytroll/3b06e2b6-8e23-4d00-8d7f-29621f38cec3n%40googlegroups.com.
--
Adam Dybbroe,
Satellite Remote Sensing Scientist,
Atmospheric Research unit, Research and Development
Swedish Meteorological and Hydrological Institute (SMHI)
www.pytroll.org
nwcsaf.smhi.se
www.smhi.se
Isaac Wilmur
Isaac Wilmur

David Hoese
I guess EWA is just magic. Final answer.
But actually, we'd have to look at the data for sure, but one thing you
could try would be to use EWA resampling in Satpy. You can do this by
providing the following arguments the `scn.resample` in addition to your
area definition.
resampler='ewa', weight_distance_max=2.0, weight_delta_max=40.0
This should mimic almost exactly what Polar2Grid 2.3 is doing. If the
line still exists in the output then that means the issue is somewhere
else in Satpy.
Is there any chance you could put the files you're using somewhere we
could access?
Dave
On 5/12/22 05:35, Adam Dybbroe wrote:
> Isaac,
>
> Could it be that there actually is a missing scan (or part of a scan) in
> one of the granules and that the resampling in Polar2grid
> interpolates/fills out the missing part?
>
> Can you check how many scans you have in each granule?
>
> What happens if you increase the search radius (from the default -
> whatever that is here in this case?) when resampling? I am not very
> familiar with the EWA resampler, but with the nearest neighbour and
> bilinear resamplers you can set the search radius via the
> radius_of_influence attribute.
>
> -Adam
>
> *
> On 12/05/2022 11:58, Isaac Wilmur wrote:
>> Hello everyone,
>>
>> When attempting to combine data between two VIIRS granules using satpy
>> there appears to be a gap inbetween, see image below
>>
>> Another image generated by Polar2grid doesn't have this problem
>>
>> Below is the running scripts and related images, any help would be
>> much appreciated.
>>
>> Thanks,
>>
>> Isaac
>> --
>> You received this message because you are subscribed to the Google
>> Groups "pytroll" group.
>> To unsubscribe from this group and stop receiving emails from it, send
>> an email to pytroll+u...@googlegroups.com.
>> To view this discussion on the web, visit
>> https://groups.google.com/d/msgid/pytroll/3b06e2b6-8e23-4d00-8d7f-29621f38cec3n%40googlegroups.com
> --
> Adam Dybbroe,
> Satellite Remote Sensing Scientist,
> Atmospheric Research unit, Research and Development
> Swedish Meteorological and Hydrological Institute (SMHI)
> www.pytroll.org
> nwcsaf.smhi.se
> www.smhi.se
>
> You received this message because you are subscribed to the Google
> Groups "pytroll" group.
> To unsubscribe from this group and stop receiving emails from it, send
> an email to pytroll+u...@googlegroups.com
> <https://groups.google.com/d/msgid/pytroll/e651eb5d-70a5-5b82-2d74-22be612a1e2e%40smhi.se?utm_medium=email&utm_source=footer>.
Isaac Wilmur
David Hoese
My guess based on your message about the number of scans is that Satpy's
reader is technically being more correct with dealing with the different
number of scans. At least that's my hope because I did update the VIIRS
SDR reader to be smarter about handling "missing" scans. What we've seen
in the past is some odd behavior between number of scans reported in a
file and the amount of actual data. I'm not sure I'll have time to dive
into the files, but glad you got the deaggregated files to work.
Dave
>
> >
> > --
> > Adam Dybbroe,
> > Satellite Remote Sensing Scientist,
> > Atmospheric Research unit, Research and Development
> > Swedish Meteorological and Hydrological Institute (SMHI)
> > nwcsaf.smhi.se <http://nwcsaf.smhi.se>
> > www.smhi.se <http://www.smhi.se>
> > --
> > You received this message because you are subscribed to the Google
> > Groups "pytroll" group.
> > To unsubscribe from this group and stop receiving emails from it,
> send
> > an email to pytroll+u...@googlegroups.com
> > <mailto:pytroll+u...@googlegroups.com>.
> > To view this discussion on the web, visit
> >
> https://groups.google.com/d/msgid/pytroll/e651eb5d-70a5-5b82-2d74-22be612a1e2e%40smhi.se
> <https://groups.google.com/d/msgid/pytroll/e651eb5d-70a5-5b82-2d74-22be612a1e2e%40smhi.se>
>
> >
> <https://groups.google.com/d/msgid/pytroll/e651eb5d-70a5-5b82-2d74-22be612a1e2e%40smhi.se?utm_medium=email&utm_source=footer>>.
>
> --
> You received this message because you are subscribed to the Google
> Groups "pytroll" group.
> To unsubscribe from this group and stop receiving emails from it, send
> an email to pytroll+u...@googlegroups.com
> <mailto:pytroll+u...@googlegroups.com>.
> To view this discussion on the web, visit
> <https://groups.google.com/d/msgid/pytroll/e487a6fe-241e-4177-8037-294a27ebfccbn%40googlegroups.com?utm_medium=email&utm_source=footer>.

lobsiger...@gmail.com
lobsiger...@gmail.com
Adam Dybbroe
Ernst,
It was a while back I looked at this myself, but when I did the
number of lines in the NWCSAF products coming via EUMETCast
matched the AVHRR granules coming the same way via the EARS-AVHRR
service. So, I think the issue is in the level-1 processing with
AAPP run at EUMETSAT rather than the NWCSAF/PPS run at EUMETSAT or
the Satpy reader. Or rather the acquisition of data is more likely
the issue (than the actual level-1 processing). Could it be that
the downlink signal is weaker from N19 and therefore we end up
having more missing lines there? In general we seem to receive and
process NOAA-19 well here in Norrköping, so maybe it is a far
fetched hypothesis?
-Adam
To view this discussion on the web, visit https://groups.google.com/d/msgid/pytroll/455ac67c-cb13-4c23-ac31-7e75367b07e8n%40googlegroups.com.
--
Adam Dybbroe,
Satellite Remote Sensing Scientist,
Atmospheric Research unit, Research and Development
Swedish Meteorological and Hydrological Institute (SMHI)
www.pytroll.org

Panu Lahtinen
On 16.5.2022 11.23, Adam Dybbroe wrote:
> Ernst,
>
> It was a while back I looked at this myself, but when I did the number
> of lines in the NWCSAF products coming via EUMETCast matched the AVHRR
> granules coming the same way via the EARS-AVHRR service. So, I think the
> issue is in the level-1 processing with AAPP run at EUMETSAT rather than
> the NWCSAF/PPS run at EUMETSAT or the Satpy reader.
AAPP drops few lines from the beginning and end of the data it is given.
I'm not sure why, but we had this same issue with our old processing
chain where we ran the EARS granules through AAPP one at a time. Now
that we first concatenate the granules to cover our target area, the
deleted scan lines don't matter that much as they typically are outside
the area, and in every case are less evident when they are missing from
the ends of the swath.
And yes, I think this is something that should be asked from Eumetsat
helpdesk.
P
--
Finnish Meteorological Institute
Erik Palménin aukio 1, P.O.Box 503, FIN-00101 Helsinki, Finland
Room: 4B15a, Phone: +358 50 380 3261