pyresample proper usage question.
147 views
Skip to first unread message

Israel Brewster
Apr 26, 2021, 2:28:01 PM4/26/21
to pyt...@googlegroups.com
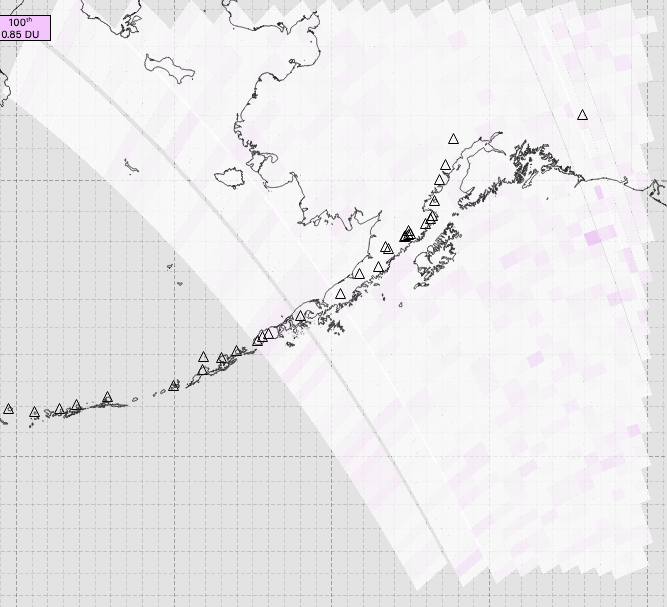
I am attempting to use pyresample to grid some (OMPS) data that I have. When I load the raw, unguided data, I have fairly full coverage of an area, as shown in this first screen shot:
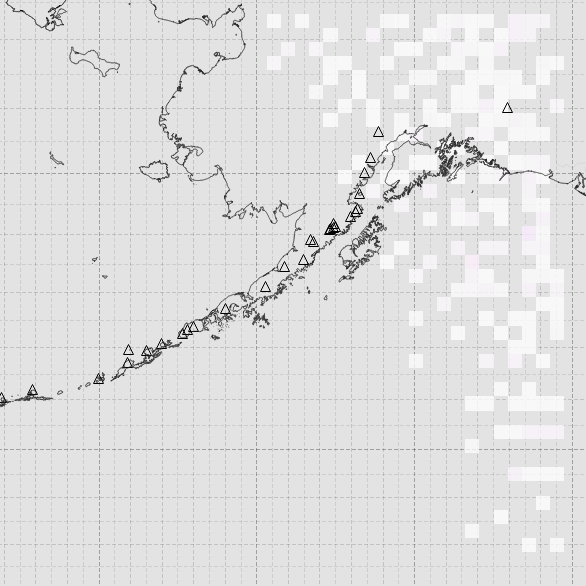
However, after gridding, most of the data is now missing:
presumably this is me doing something wrong, but having tried tweaking a number of parameters, I’m at a loss as to what.
My procedure is as follows:
1) Create a target area def:
area_extent = (x_start,y_start,x_stop,y_stop) # In target coordinates
proj_dict = {'proj': 'merc', 'lon_0': '-90', 'preserve_units': False}
# num_lat and num_lon are calculated to create a grid of approx 50km x 50km
# Have tried as small as 25kmx25km and as large as 100km x 100km
target_def = create_area_def("Binned", proj_dict, area_extent=area_extent,
shape=(num_lat, num_lon))
shape=(num_lat, num_lon))
2) Create a source SwathDefinition:
source_def = geometry.SwathDefinition(lons=data_lons, lats=data_lats) # in latitude/longitude
3) get_bil_info:
t_params, s_params, input_idxs, idx_ref = bilinear.get_bil_info(source_def, target_def, radius=radius) # Have tried radius from 100,000 to an insane 2e20
4) bin data. For each “column” of data I want gridded, I do the following:
# key_data is the data column from the source file
binned_data = bilinear.get_sample_from_bil_info(key_data,
t_params, s_params, input_idxs, idx_ref,
output_shape=target_def.shape)
So am I doing something wrong with the above procedure/parameters? How can I get the gridded data to show full coverage?
More information:
When loaded, my data is formatted into 1D, essentially treated as “time series” data, since the points are all recorded sequentially. As such, and due to this bug that I reported: https://github.com/pytroll/pyresample/issues/316, I am currently using pyresample 1.16, and am unable to update. If there is good reason to believe that this is an issue with the version of pyresample I am using, I could probably re-write the data import routines to pull in the data as a 2D lat/lon structure, such that it would work with the newer versions of pyresample, but that would take a lot of work that I’d prefer to avoid for now unless there is some definite benefit.
---
Israel Brewster
Software Engineer
Alaska Volcano Observatory
Geophysical Institute - UAF
2156 Koyukuk Drive
Fairbanks AK 99775-7320
Software Engineer
Alaska Volcano Observatory
Geophysical Institute - UAF
2156 Koyukuk Drive
Fairbanks AK 99775-7320

Panu Lahtinen
Apr 27, 2021, 2:58:00 AM4/27/21
to pyt...@googlegroups.com
On 26.4.2021 21.27, Israel Brewster wrote:
Hi,
> I am attempting to use pyresample to grid some (OMPS) data that I
> have. When I load the raw, unguided data, I have fairly full coverage
> of an area, as shown in this first screen shot:
resampling, so it's not ungridded. The nearest duplicates pixels to
locations where there's no data, and causes the swath edge (here on the
left edge) to elongate the features in the data.
> However, after gridding, most of the data is now missing:
location. The "surround" here means that in the target projection there
should be one source location in each of the four quadrants around the
target location. The current implementation of bilinear interpolation
uses the nearest neighbour interpolation to find 32 closest (regardless
of the direction they are in) source locations. From these the four
closest are within each of the quadrants. With very sparse data, or very
low resolution, these quadrant neighbours might not be found. This is
certain to happen close to the swath, like in your example, where
there's no data beyond the swath edge.
> presumably this is me doing something wrong, but having tried tweaking
> a number of parameters, I’m at a loss as to what.
*current* implementation. The current implementation is also very
inefficient with large datasets.
> 3) get_bil_info:
>
> t_params, s_params, input_idxs, idx_ref =
> bilinear.get_bil_info(source_def, target_def, radius=radius) # Have
> tried radius from 100,000 to an insane 2e20
neighbours that are searched with the "neighbours" keyword argument. The
default is 32, so you try with a larger value. This will increase the
memory use a lot, but might be worth a try.
> So am I doing something wrong with the above procedure/parameters? How
> can I get the gridded data to show full coverage?
first example image.
> More information:
>
> When loaded, my data is formatted into 1D, essentially treated as
> “time series” data, since the points are all recorded sequentially. As
> such, and due to this bug that I reported:
> https://github.com/pytroll/pyresample/issues/316
> using pyresample 1.16, and am unable to update. If there is good
> reason to believe that this is an issue with the version of pyresample
> I am using, I could probably re-write the data import routines to pull
> in the data as a 2D lat/lon structure, such that it would work with
> the newer versions of pyresample, but that would take a lot of work
> that I’d prefer to avoid for now unless there is some definite benefit.
Ah. Yeah, I hit a snag when trying to fix that, so no progress. But as
> reason to believe that this is an issue with the version of pyresample
> I am using, I could probably re-write the data import routines to pull
> in the data as a 2D lat/lon structure, such that it would work with
> the newer versions of pyresample, but that would take a lot of work
> that I’d prefer to avoid for now unless there is some definite benefit.
there's no change in the actual interpolation algorithm, the new version
wouldn't help here.
There is a new interpolation in the works
(https://github.com/pytroll/pyresample/pull/341), but it isn't yet ready
for general use.
P
--
Finnish Meteorological Institute
Erik Palménin aukio 1, P.O.Box 503, FIN-00101 Helsinki, Finland
Room: 4B15a, Phone: +358 50 380 3261
Israel Brewster
Apr 27, 2021, 12:59:25 PM4/27/21
to pyt...@googlegroups.com
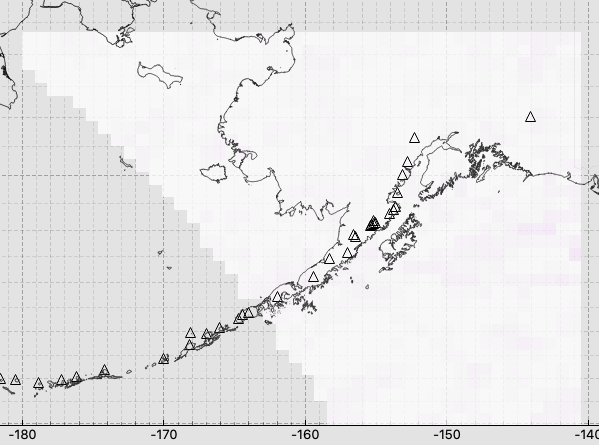
…and after reading through your very helpful and informative reply, below, I discovered that the whole problem was that I *hadn’t* actually tried different values for radius - I was changing the parameter, but due to a bug in my code, the changed parameter never actually got passed to the get_bil_info function, so every test I did was just using my default value for radius, which isn't large enough for this particular data set. Fixing that such that a reasonable-for-this-dataset value of radius was actually used gave the below much more as expected results. :)
On Apr 26, 2021, at 10:57 PM, Panu Lahtinen <panu.l...@fmi.fi> wrote:
On 26.4.2021 21.27, Israel Brewster wrote:
Hi,I am attempting to use pyresample to grid some (OMPS) data that I have. When I load the raw, unguided data, I have fairly full coverage of an area, as shown in this first screen shot:
The first screenshot shows the data resampled with nearest neighbour resampling, so it's not ungridded. The nearest duplicates pixels to locations where there's no data, and causes the swath edge (here on the left edge) to elongate the features in the data.
Actually, no, unless said re-sampling occurs prior to my obtaining the data file, which I do not believe is the case. What I actually drew on the map to make that image has a 1-to-1 correspondence between the data points in the data file and what is drawn there. The elongation effect at the edge was explained to me as being due to the sensor angle the data point was taken at - at the more extreme sensor angles you get close to the edge of the swath, the data points cover a larger area.
However, after gridding, most of the data is now missing:
The bilinear resampler needs four samples that surround the target location. The "surround" here means that in the target projection there should be one source location in each of the four quadrants around the target location. The current implementation of bilinear interpolation uses the nearest neighbour interpolation to find 32 closest (regardless of the direction they are in) source locations. From these the four closest are within each of the quadrants. With very sparse data, or very low resolution, these quadrant neighbours might not be found. This is certain to happen close to the swath, like in your example, where there's no data beyond the swath edge.presumably this is me doing something wrong, but having tried tweaking a number of parameters, I’m at a loss as to what.
It's not you doing anything wrong, it's just a limitation with the *current* implementation. The current implementation is also very inefficient with large datasets.
Good to know. This is actually one of the smaller datasets I work with, so if there is a newer, more efficient implementation coming, I’ll have to keep an eye out for that, and make whatever changes to my code that are needed to be able to use it as soon as possible.
More information:
When loaded, my data is formatted into 1D, essentially treated as “time series” data, since the points are all recorded sequentially. As such, and due to this bug that I reported: https://github.com/pytroll/pyresample/issues/316 <https://github.com/pytroll/pyresample/issues/316>, I am currently using pyresample 1.16, and am unable to update. If there is good reason to believe that this is an issue with the version of pyresample I am using, I could probably re-write the data import routines to pull in the data as a 2D lat/lon structure, such that it would work with the newer versions of pyresample, but that would take a lot of work that I’d prefer to avoid for now unless there is some definite benefit.
Ah. Yeah, I hit a snag when trying to fix that, so no progress. But as there's no change in the actual interpolation algorithm, the new version wouldn't help here.
No worries, I can just keep using 1.16 for now, until the new interpolation you mention is ready for general use. Thanks for your efforts!
---
Israel Brewster
Software Engineer
Alaska Volcano Observatory
Geophysical Institute - UAF
2156 Koyukuk Drive
Fairbanks AK 99775-7320
Software Engineer
Alaska Volcano Observatory
Geophysical Institute - UAF
2156 Koyukuk Drive
Fairbanks AK 99775-7320
There is a new interpolation in the works (https://github.com/pytroll/pyresample/pull/341), but it isn't yet ready for general use.
P
--
Finnish Meteorological Institute
Erik Palménin aukio 1, P.O.Box 503, FIN-00101 Helsinki, Finland
Room: 4B15a, Phone: +358 50 380 3261
--
You received this message because you are subscribed to the Google Groups "pytroll" group.
To unsubscribe from this group and stop receiving emails from it, send an email to pytroll+u...@googlegroups.com.
To view this discussion on the web, visit https://groups.google.com/d/msgid/pytroll/274f5791-91f2-5d92-e81c-216117757dd5%40fmi.fi.
Reply all
Reply to author
Forward
0 new messages