HEL:P: Reader for Sentinel 3 L2 Products: Land Surface Temperature
14 views
Skip to first unread message

DonteRw
Jul 1, 2021, 2:55:15 PM7/1/21
to pytroll
Hie all
Is there someone who has developed a reader for Sentinel-3 L2 products. I want to read the L2 Land Surface Temperature data
I have tried to follow what seems to me to be the key concepts in the """Reader for Sentinel-3 SLSTR SST data."""
-------------------------
from satpy import CHUNK_SIZE
import xarray as xr
## filename to unzipped file - direct approach for testing
fnem = "D:\\LST_SENTINEL_3\\_temp\\S3A_SL_2_LST____20210603T091323_20210603T091623_20210604T155731_0180_072_264_2160_LN2_O_NT_004.SEN3\\LST_in.nc"
#### read with xarry as done in satpy
utt = xr.open_dataset(fnem, decode_cf=True, mask_and_scale=True, chunks={'ni': CHUNK_SIZE, 'nj': CHUNK_SIZE} )
### check dimensions
In[144]: utt.dims
Out[144]:
Frozen(SortedKeysDict({'rows': 1200, 'columns': 1500, 'orphan_pixels': 187}))
### check coords - problem!
Out[145]: utt.coords
Out[145]: Coordinates: *empty*
Out[145]: Coordinates: *empty*
#check data variables - funny that I read 1 LST .nc and other files come along
Out[146]: utt.data_vars
Out[146]: Data variables:
LST (rows, columns) float32 dask.array<chunksize=(1200, 1500), meta=np.ndarray>
LST_orphan (rows, orphan_pixels) float32 dask.array<chunksize=(1200, 187), meta=np.ndarray>
LST_uncertainty (rows, columns) float32 dask.array<chunksize=(1200, 1500), meta=np.ndarray>
LST_uncertainty_orphan (rows, orphan_pixels) float32 dask.array<chunksize=(1200, 187), meta=np.ndarray>
exception (rows, columns) int16 dask.array<chunksize=(1200, 1500), meta=np.ndarray>
exception_orphan (rows, orphan_pixels) int16 dask.array<chunksize=(1200, 187), meta=np.ndarray>
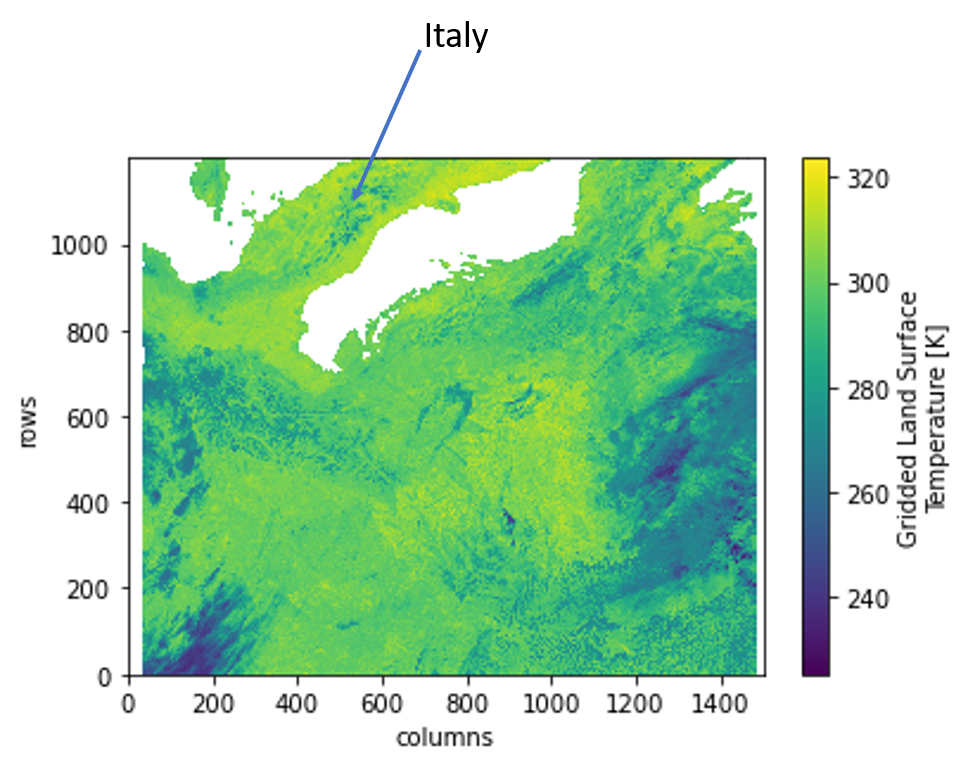
## test plot
Out[147] utt['LST'].plot()
# The plot is upside down. This is over Europe, so Italy should down but its on top. I also don't have coordinates
Help
Tendayi

David Hoese
Jul 2, 2021, 4:54:04 PM7/2/21
to pyt...@googlegroups.com
Hi,
The expert on the Sentinel-3 reader is on vacation right now and won't
be back for a couple weeks. I can try to help thought to get something
working for you. First, notice that xarray defaults to using
matplotlib's pcolormesh. See the note at the bottom of this section that
it may be faster to use imshow:
http://xarray.pydata.org/en/stable/user-guide/plotting.html#two-dimensions
That's what I usually use and you may be able to do
`.plot.imshow(origin='upper')` to flip it properly.
I'll try to help more if I can.
Dave
> S3_L2_LST_up_side_down.png
>
>
>
>
> Help
>
>
>
> Tendayi
>
>
>
>
>
>
> --
> You received this message because you are subscribed to the Google
> Groups "pytroll" group.
> To unsubscribe from this group and stop receiving emails from it, send
> an email to pytroll+u...@googlegroups.com
> <mailto:pytroll+u...@googlegroups.com>.
> To view this discussion on the web, visit
> https://groups.google.com/d/msgid/pytroll/108b2a11-4c0e-4af3-b5b1-04cc86dee926n%40googlegroups.com
> <https://groups.google.com/d/msgid/pytroll/108b2a11-4c0e-4af3-b5b1-04cc86dee926n%40googlegroups.com?utm_medium=email&utm_source=footer>.
The expert on the Sentinel-3 reader is on vacation right now and won't
be back for a couple weeks. I can try to help thought to get something
working for you. First, notice that xarray defaults to using
matplotlib's pcolormesh. See the note at the bottom of this section that
it may be faster to use imshow:
http://xarray.pydata.org/en/stable/user-guide/plotting.html#two-dimensions
That's what I usually use and you may be able to do
`.plot.imshow(origin='upper')` to flip it properly.
I'll try to help more if I can.
Dave
>
>
>
>
> Help
>
>
>
> Tendayi
>
>
>
>
>
>
> --
> You received this message because you are subscribed to the Google
> Groups "pytroll" group.
> To unsubscribe from this group and stop receiving emails from it, send
> an email to pytroll+u...@googlegroups.com
> <mailto:pytroll+u...@googlegroups.com>.
> To view this discussion on the web, visit
> https://groups.google.com/d/msgid/pytroll/108b2a11-4c0e-4af3-b5b1-04cc86dee926n%40googlegroups.com
> <https://groups.google.com/d/msgid/pytroll/108b2a11-4c0e-4af3-b5b1-04cc86dee926n%40googlegroups.com?utm_medium=email&utm_source=footer>.
Reply all
Reply to author
Forward
0 new messages