Cross-correlation plot
348 views
Skip to first unread message

Artem Glebov
May 21, 2023, 11:36:57 AM5/21/23
to pystatsmodels
Hi,

I would like to propose a change to be able to plot a matrix of auto- and cross-correlation plots of multiple time series, similar to the functionality available with the standard acf function in R.
An example plot from R:
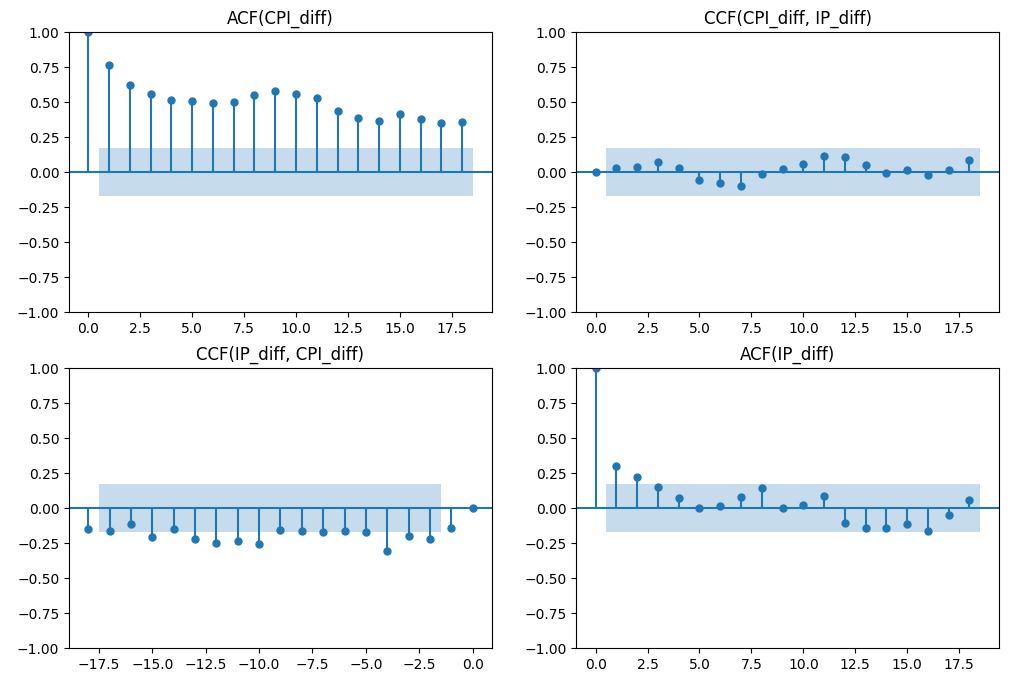
The corresponding plot in Python:
As a first step, this change adds optional confidence intervals to the output of statsmodels.tsa.stattools.ccf:
Additionally, the change introduces an argument to limit the number of lags in ccf, similar to how it's done in statsmodels.tsa.stattools.acf and statsmodels.tsa.stattools.pacf, and adds tests for ccf.
If the change is accepted, the next step (currently in draft) is to produce a matrix of plots:
Please let me know if there are any objections or comments.
Thanks
Reply all
Reply to author
Forward
0 new messages