GSoC 2018 - geovisualization module
70 views
Skip to first unread message

Stefanie Lumnitz
Mar 2, 2018, 9:07:00 PM3/2/18
to pysa...@googlegroups.com
Hello Dani, Serge and Joris,
my name is Stefanie (Lumnitz) and I am interested in participating as a team member of the geovisualization module project in GSoC 2018.
I have a Geography background (BSc. in Geography and Land Management at TU and LMU Munich) and am currently enrolled in a MSc. by research program at the faculty of forestry in the University of British Columbia, Canada. Here I have the chance to combine data science with geospatial analysis, using machine learning algorithms in combination with google street view imagery and remote sensing data to improve bio surveillance planning and early detection of invasive insect species in urban areas. I am a big fan of open source alternatives for geospatial analysis and enjoy working on visualizations. Besides uni, I have worked as a self employed videographer and am quite passionate about good visual design and representations.
I am fairly new to the open source community, but have experience in Python programming and matplotlib. I have just started contributing to the viz module (see pull request: https://github.com/pysal/pysal/pull/10220) and am looking forward to getting more involved.
I have just started to work on my GSoC application and have a couple of questions:
- You listed a couple of specific activities. How much time would you suggest should each of these activities take? I was thinking about four weeks for each of the first two, one week for the last two and two weeks of buffer time?
- Listing types of visualization in https://github.com/pysal/pysal/wiki/PySAL-Visualization-Project#common-views, are there any visualizations you would prioritise?
- Do you have any suggestions for me to read up on or include in my application?
Looking forward to your feedback.
Cheers,
Stef

Serge Rey
Mar 3, 2018, 11:31:43 AM3/3/18
to pysa...@googlegroups.com
Hello Stef,
Fantastic to hear of your interest in the project - Welcome aboard as it were. On Fri, Mar 2, 2018 at 6:06 PM, Stefanie Lumnitz <stefanie...@gmail.com> wrote:
Hello Dani, Serge and Joris,my name is Stefanie (Lumnitz) and I am interested in participating as a team member of the geovisualization module project in GSoC 2018.I have a Geography background (BSc. in Geography and Land Management at TU and LMU Munich) and am currently enrolled in a MSc. by research program at the faculty of forestry in the University of British Columbia, Canada. Here I have the chance to combine data science with geospatial analysis, using machine learning algorithms in combination with google street view imagery and remote sensing data to improve bio surveillance planning and early detection of invasive insect species in urban areas. I am a big fan of open source alternatives for geospatial analysis and enjoy working on visualizations. Besides uni, I have worked as a self employed videographer and am quite passionate about good visual design and representations.
Sounds like an excellent background and set of experiences for this project.
I am fairly new to the open source community, but have experience in Python programming and matplotlib. I have just started contributing to the viz module (see pull request: https://github.com/pysal/pysal/pull/10220) and am looking forward to getting more involved.I have just started to work on my GSoC application and have a couple of questions:- You listed a couple of specific activities. How much time would you suggest should each of these activities take? I was thinking about four weeks for each of the first two, one week for the last two and two weeks of buffer time?
In broad terms, that looks realistic. As you further develop the project/proposal, you can probably add specific sub-tasks for each of these to furhter decompose the project into tractable pieces.
- Listing types of visualization in https://github.com/pysal/pysal/wiki/PySAL-Visualization-Project#common-views, are there any visualizations you would prioritise?
My own biases would say the first two sets, as I think the pysal user base would have the greated demand for those. That said, if any of the areas strke your interest, contributions there would be most welcome.
- Do you have any suggestions for me to read up on or include in my application?
Keep reaching out as you have done here with further questions as they come up. Also, dig into the pysal code base to become familiar with the overall structure so that work on the viz component is more easily integrated. You might also give a look at the developer guidelines on the wiki: https://github.com/pysal/pysal/wiki
Looking forward to your feedback.
Hope this helps.
Best,
s.
Sergio (Serge) Rey
Founding Director, Center for Geospatial Sciences
University of California, Riverside
---
You received this message because you are subscribed to the Google Groups "pysal-dev" group.
To unsubscribe from this group and stop receiving emails from it, send an email to pysal-dev+unsubscribe@googlegroups.com.
For more options, visit https://groups.google.com/d/optout.
Stefanie Lumnitz
Mar 16, 2018, 2:51:17 AM3/16/18
to pysa...@googlegroups.com
On Sat, Mar 3, 2018 at 8:30 AM, Serge Rey <ser...@ucr.edu> wrote:
Answers below.Hello Stef,Fantastic to hear of your interest in the project - Welcome aboard as it were.On Fri, Mar 2, 2018 at 6:06 PM, Stefanie Lumnitz <stefanie...@gmail.com> wrote:Hello Dani, Serge and Joris,my name is Stefanie (Lumnitz) and I am interested in participating as a team member of the geovisualization module project in GSoC 2018.I have a Geography background (BSc. in Geography and Land Management at TU and LMU Munich) and am currently enrolled in a MSc. by research program at the faculty of forestry in the University of British Columbia, Canada. Here I have the chance to combine data science with geospatial analysis, using machine learning algorithms in combination with google street view imagery and remote sensing data to improve bio surveillance planning and early detection of invasive insect species in urban areas. I am a big fan of open source alternatives for geospatial analysis and enjoy working on visualizations. Besides uni, I have worked as a self employed videographer and am quite passionate about good visual design and representations.Sounds like an excellent background and set of experiences for this project.I am fairly new to the open source community, but have experience in Python programming and matplotlib. I have just started contributing to the viz module (see pull request: https://github.com/pysal/pysal/pull/10220) and am looking forward to getting more involved.I have just started to work on my GSoC application and have a couple of questions:- You listed a couple of specific activities. How much time would you suggest should each of these activities take? I was thinking about four weeks for each of the first two, one week for the last two and two weeks of buffer time?In broad terms, that looks realistic. As you further develop the project/proposal, you can probably add specific sub-tasks for each of these to furhter decompose the project into tractable pieces.- Listing types of visualization in https://github.com/pysal/pysal/wiki/PySAL-Visualization-Project#common-views, are there any visualizations you would prioritise?My own biases would say the first two sets, as I think the pysal user base would have the greated demand for those. That said, if any of the areas strke your interest, contributions there would be most welcome.
Thank you for the feedback, I went with those two categories and am also curious about the time series (spatial dynamics). Do you have a reference indicating how these time series (spatial dynamics) should look like?
Which visualizations, would you suggest, should be interactive? Would you expect the interactive functionality to match the Matplotlib visualizations or are different types of plots needed to be interactive?
- Do you have any suggestions for me to read up on or include in my application?Keep reaching out as you have done here with further questions as they come up. Also, dig into the pysal code base to become familiar with the overall structure so that work on the viz component is more easily integrated. You might also give a look at the developer guidelines on the wiki: https://github.com/pysal/pysal/wiki
I have been developing my proposal and the current draft can be found here: https://github.com/pysal/pysal/wiki/GSoC-2018---Geovisualization-Module-by-Stefanie-Lumnitz
I still have a few additional questions, especially regarding the last two parts of the project.
For Folium/D3 and geopandas it is not clear to me what has to be done, since I am not very familiar with these packages yet. Are there any concrete questions to be answered or explored? If it is too open ended, maybe it makes more sense to focus on the first two parts instead? Nevertheless, I briefly explored these packages and D3 seems like an interesting package to me to work with. There is a similar one called vega (https://vega.github.io/vega/examples/county-unemployment/) which seems more approachable. There might be a limitation to how many visualisations I can implement with this package, but I am motivated to try if there is time for me exploring a new language.
Thank you for your help so far!
Cheers,
Stef
Looking forward to your feedback.Hope this helps.Best,s.Sergio (Serge) ReyFounding Director, Center for Geospatial SciencesUniversity of California, Riverside
---
You received this message because you are subscribed to the Google Groups "pysal-dev" group.
To unsubscribe from this group and stop receiving emails from it, send an email to pysal-dev+unsubscribe@googlegroups.com.
For more options, visit https://groups.google.com/d/optout.
--

Levi John Wolf
Mar 18, 2018, 3:18:58 PM3/18/18
to pysa...@googlegroups.com
For the spatial dynamics vis, I'd think things like alluvial diagrams & rank clocks. I also find bivariate trajectory plots helpful, especially when they're interactive.
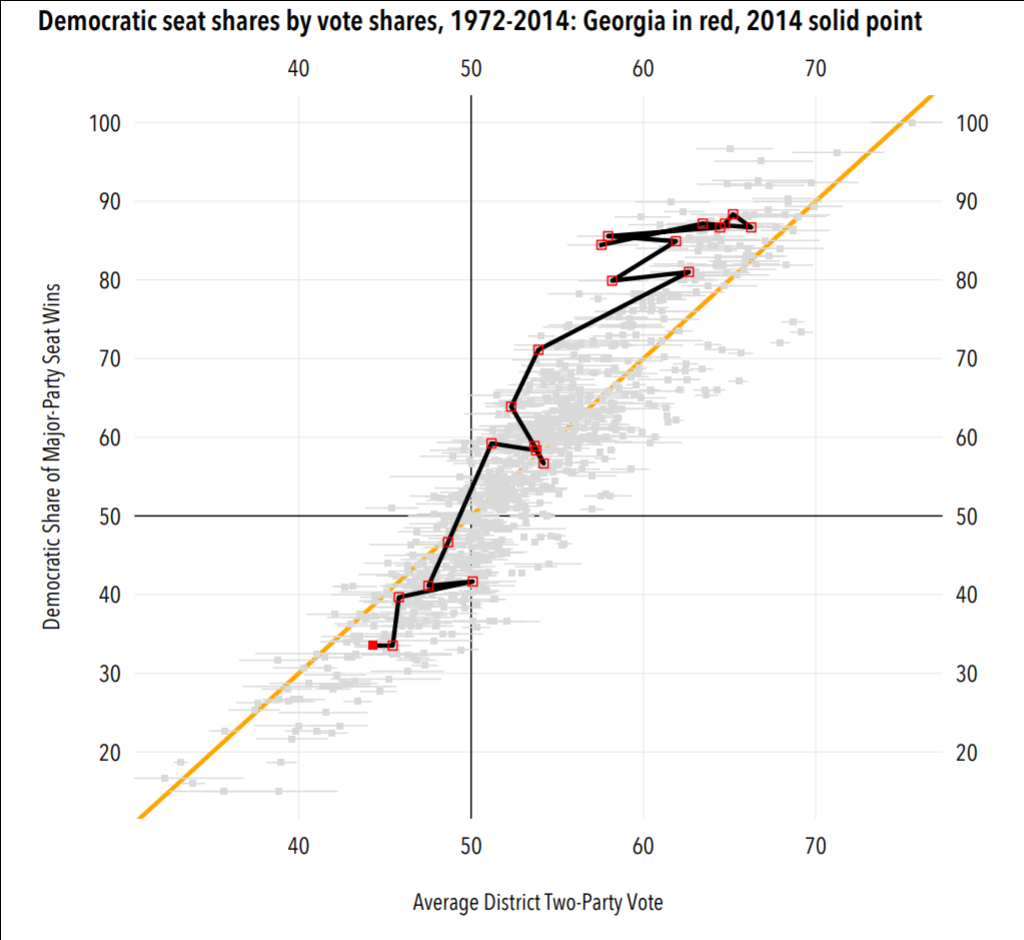
(from Jackman, 2016)
As far as the folium/d3 stuff, there was a class project a while ago to write some basic choropleth mapping stuff for folium, but it's from before we made the determination as a library to focus on geopandas dataframes, so the UX is clunky and the code could be written much better.
The important point is this: an interested student could pick whatever graphics engine they want and take a stab at writing these views in a consistent API. A successful project will likely pick a single frontend, and hopefully implement both interactive/static views if there's time.
The question prompt is open because we want to be sure students can pick whatever visualization engine (matplotlib, bokeh, vega/altair) they're excited about.
To unsubscribe from this group and stop receiving emails from it, send an email to pysal-dev+...@googlegroups.com.
For more options, visit https://groups.google.com/d/optout.
--
---
You received this message because you are subscribed to the Google Groups "pysal-dev" group.
To unsubscribe from this group and stop receiving emails from it, send an email to pysal-dev+...@googlegroups.com.
For more options, visit https://groups.google.com/d/optout.
--
---
You received this message because you are subscribed to the Google Groups "pysal-dev" group.
To unsubscribe from this group and stop receiving emails from it, send an email to pysal-dev+...@googlegroups.com.
For more options, visit https://groups.google.com/d/optout.
Levi John Wolf
Lecturer in Quantitative Human Geography | University of Bristol
Fellow | Center for Spatial Data Science, University of Chicago
Associate Member | Center for Multilevel Modeling, University of Bristol
Interim Director | Q-Step Program, University of Bristol
Stefanie Lumnitz
Mar 22, 2018, 12:23:32 AM3/22/18
to pysa...@googlegroups.com
Hi Levi,
thank you for your feedback.
On Sun, Mar 18, 2018 at 12:18 PM, Levi John Wolf <levi.jo...@gmail.com> wrote:
For the spatial dynamics vis, I'd think things like alluvial diagrams & rank clocks. I also find bivariate trajectory plots helpful, especially when they're interactive.
<image removed> (from Jackman, 2016)
Thanks, this made it a lot clearer. I decided not to go for these visualisations though and instead chose the rose plot and the Lorenz curve.
As far as the folium/d3 stuff, there was a class project a while ago to write some basic choropleth mapping stuff for folium, but it's from before we made the determination as a library to focus on geopandas dataframes, so the UX is clunky and the code could be written much better.The important point is this: an interested student could pick whatever graphics engine they want and take a stab at writing these views in a consistent API. A successful project will likely pick a single frontend, and hopefully implement both interactive/static views if there's time.The question prompt is open because we want to be sure students can pick whatever visualization engine (matplotlib, bokeh, vega/altair) they're excited about.
That's very helpful, thank you. After looking into the various options for static and interactive plotting libraries, I don't think a single engine is suitable for doing both of those. Matplotlib has no functionality for interactive plotting; Bokeh (and Vega/D3) could do both, but static plots are only screenshots of html rendering and will not be close to the quality of Matplotlib output.
I would suggest to use Matplotlib for static and Bokeh for interactive plots, and design a common API that can call on both static and interactive functionality. I reworked my proposal along these lines, see https://github.com/pysal/pysal/wiki/GSoC-2018---Geovisualization-Module-by-Stefanie-Lumnitz
I also think Vega is quite interesting and would like to explore how it can be implemented in future in the last two weeks of GSoC.
I am looking forward to your feedback.
Cheers,
Stef
To unsubscribe from this group and stop receiving emails from it, send an email to pysal-dev+unsubscribe@googlegroups.com.
For more options, visit https://groups.google.com/d/optout.
--
---
You received this message because you are subscribed to the Google Groups "pysal-dev" group.
To unsubscribe from this group and stop receiving emails from it, send an email to pysal-dev+unsubscribe@googlegroups.com.
For more options, visit https://groups.google.com/d/optout.
--
---
You received this message because you are subscribed to the Google Groups "pysal-dev" group.
To unsubscribe from this group and stop receiving emails from it, send an email to pysal-dev+unsubscribe@googlegroups.com.
For more options, visit https://groups.google.com/d/optout.
--Levi John WolfLecturer in Quantitative Human Geography | University of BristolFellow | Center for Spatial Data Science, University of ChicagoAssociate Member | Center for Multilevel Modeling, University of BristolInterim Director | Q-Step Program, University of Bristol
--
---
You received this message because you are subscribed to the Google Groups "pysal-dev" group.
To unsubscribe from this group and stop receiving emails from it, send an email to pysal-dev+unsubscribe@googlegroups.com.
Levi John Wolf
Mar 22, 2018, 8:02:09 AM3/22/18
to pysa...@googlegroups.com
Sure, that's fine. Glad to help clarify.
I'm real glad with that proposal as it stands; it's come together well.
I look forward to the submission!
ljw
To unsubscribe from this group and stop receiving emails from it, send an email to pysal-dev+...@googlegroups.com.
For more options, visit https://groups.google.com/d/optout.
--
---
You received this message because you are subscribed to the Google Groups "pysal-dev" group.
To unsubscribe from this group and stop receiving emails from it, send an email to pysal-dev+...@googlegroups.com.
For more options, visit https://groups.google.com/d/optout.
--
---
You received this message because you are subscribed to the Google Groups "pysal-dev" group.
To unsubscribe from this group and stop receiving emails from it, send an email to pysal-dev+...@googlegroups.com.
For more options, visit https://groups.google.com/d/optout.
--Levi John WolfLecturer in Quantitative Human Geography | University of BristolFellow | Center for Spatial Data Science, University of ChicagoAssociate Member | Center for Multilevel Modeling, University of BristolInterim Director | Q-Step Program, University of Bristol
--
---
You received this message because you are subscribed to the Google Groups "pysal-dev" group.
To unsubscribe from this group and stop receiving emails from it, send an email to pysal-dev+...@googlegroups.com.
--
---
You received this message because you are subscribed to the Google Groups "pysal-dev" group.
To unsubscribe from this group and stop receiving emails from it, send an email to pysal-dev+...@googlegroups.com.
For more options, visit https://groups.google.com/d/optout.
Stefanie Lumnitz
Mar 25, 2018, 5:10:18 PM3/25/18
to pysa...@googlegroups.com
On Thu, Mar 22, 2018 at 5:01 AM, Levi John Wolf <levi.jo...@gmail.com> wrote:
Sure, that's fine. Glad to help clarify.I'm real glad with that proposal as it stands; it's come together well.I look forward to the submission!
Ok awesome, I have updated the proposal on the wiki now and submitted it to GSoC.
Excited about the outcome!
Stef
ljw
To unsubscribe from this group and stop receiving emails from it, send an email to pysal-dev+unsubscribe@googlegroups.com.
For more options, visit https://groups.google.com/d/optout.
--
---
You received this message because you are subscribed to the Google Groups "pysal-dev" group.
To unsubscribe from this group and stop receiving emails from it, send an email to pysal-dev+unsubscribe@googlegroups.com.
For more options, visit https://groups.google.com/d/optout.
--
---
You received this message because you are subscribed to the Google Groups "pysal-dev" group.
To unsubscribe from this group and stop receiving emails from it, send an email to pysal-dev+unsubscribe@googlegroups.com.
For more options, visit https://groups.google.com/d/optout.
--Levi John WolfLecturer in Quantitative Human Geography | University of BristolFellow | Center for Spatial Data Science, University of ChicagoAssociate Member | Center for Multilevel Modeling, University of BristolInterim Director | Q-Step Program, University of Bristol
--
---
You received this message because you are subscribed to the Google Groups "pysal-dev" group.
To unsubscribe from this group and stop receiving emails from it, send an email to pysal-dev+unsubscribe@googlegroups.com.
--
---
You received this message because you are subscribed to the Google Groups "pysal-dev" group.
To unsubscribe from this group and stop receiving emails from it, send an email to pysal-dev+unsubscribe@googlegroups.com.
For more options, visit https://groups.google.com/d/optout.
----Levi John WolfLecturer in Quantitative Human Geography | University of BristolFellow | Center for Spatial Data Science, University of ChicagoAssociate Member | Center for Multilevel Modeling, University of BristolInterim Director | Q-Step Program, University of Bristol
---
You received this message because you are subscribed to the Google Groups "pysal-dev" group.
To unsubscribe from this group and stop receiving emails from it, send an email to pysal-dev+unsubscribe@googlegroups.com.
Reply all
Reply to author
Forward
0 new messages