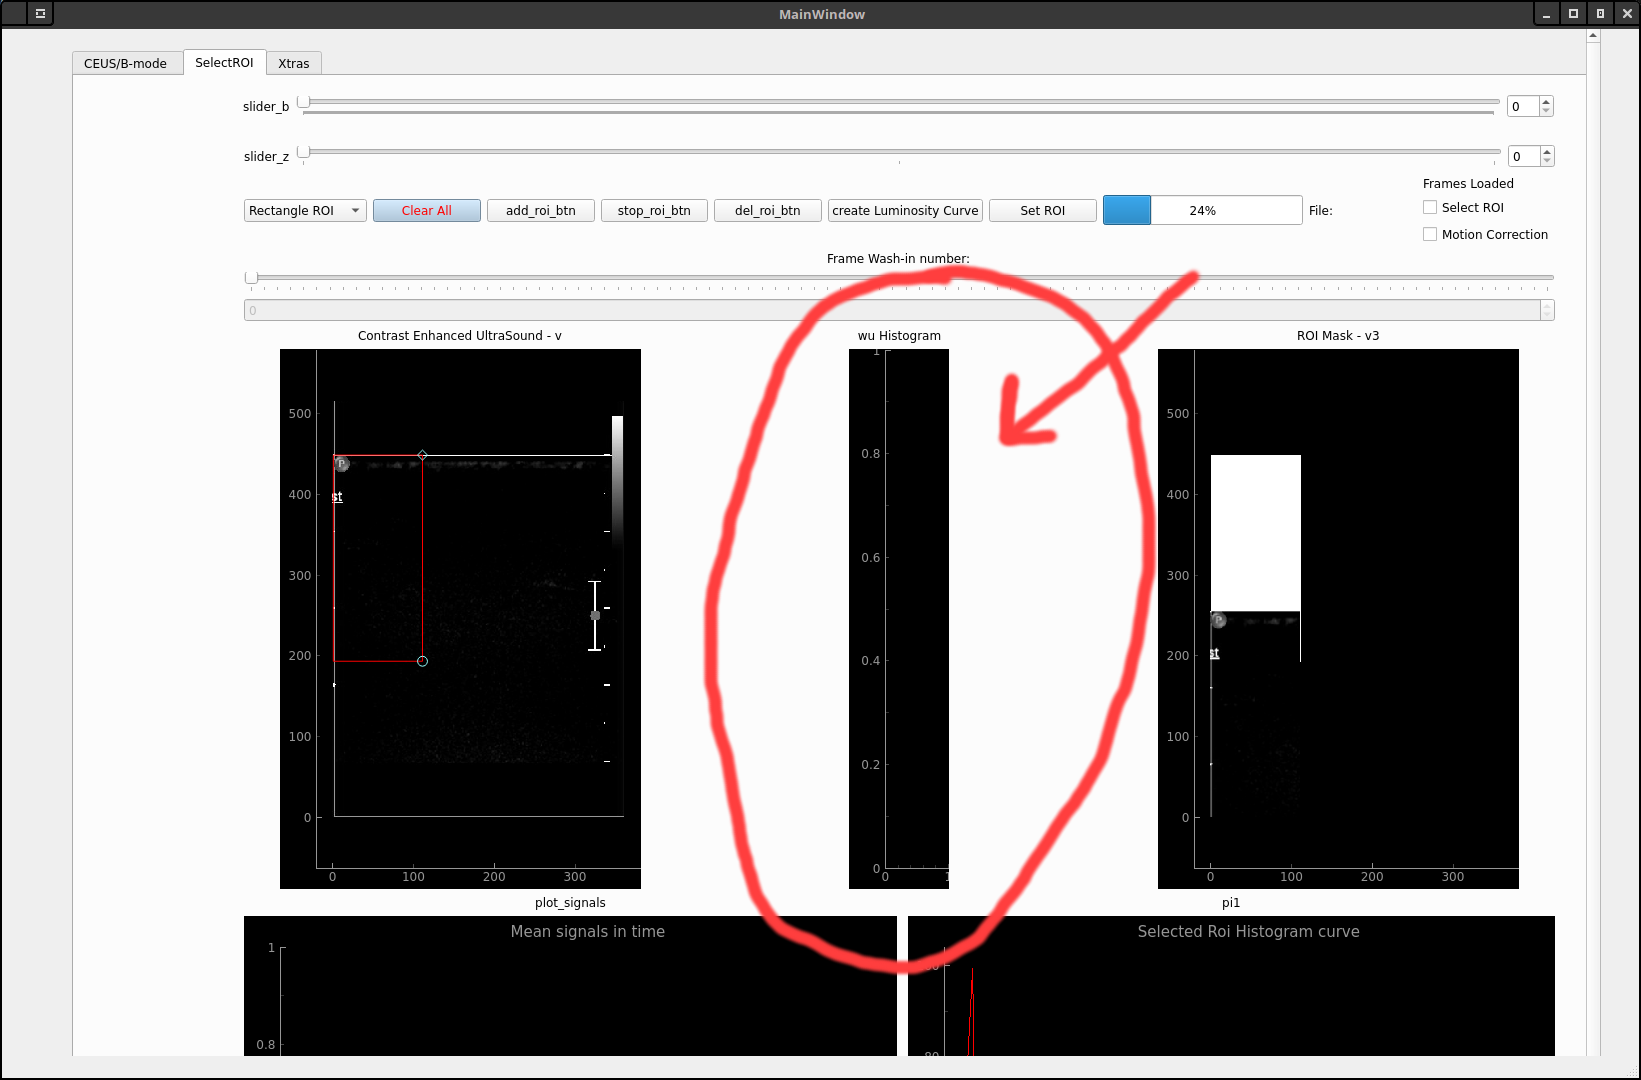
correct way of inserting a pyqtgraph histogramLut item from an .ui file.

pilkrow slash

class MainWindow(QMainWindow, ProcessDicom):
…
…
uic.loadUi(‘CEtb26.ui’, self)
…
…
self.im1 = pg.ImageItem(img,levels=[0, 255])
self.histWindow = self.findChild(PlotWidget, ‘wu’)
self.histWindow.setImageItem(self.im1)
but the only thing I get is an empty plot!
Thank you for your time.

Erik Johansson
--
You received this message because you are subscribed to the Google Groups "pyqtgraph" group.
To unsubscribe from this group and stop receiving emails from it, send an email to pyqtgraph+...@googlegroups.com.
To view this discussion on the web visit https://groups.google.com/d/msgid/pyqtgraph/7e99924b-7997-4853-b486-e58c08bbd841o%40googlegroups.com.
pilkrow slash
pilkrow slash

uic.loadUi(‘CEtb26.ui’, self)
self.wu = self.findChild(HistogramLUTWidget, 'wu')
self.wu = pg.HistogramLUTWidget(fillHistogram=False)
Τη Πέμπτη, 23 Ιουλίου 2020 - 7:37:51 μ.μ. UTC+3, ο χρήστης Erik J έγραψε:
Hello,I have done this a few times. To make it work, I use a QWidget for the histogram display which I then promote to a pyqtgraph HistogramLutWidget. Try changing your QGraphics widget to be a QWidget then promote it to a HistogramLUTWidget. I think if you do that the rest should work fine.Regards,Erik
On Thu, Jul 23, 2020 at 8:58 AM pilkrow slash <pilkro...@gmail.com> wrote:
Hello, I have little experience about pyqtgraph and sometimes simple things look difficult.--What I'm looking for is to display a histogramLUT widget into a gui created using qt Designer.I import the .ui file but I don't know how I can insert it into my code and connect it with an imageItem.
class MainWindow(QMainWindow, ProcessDicom):
…
…
uic.loadUi(‘CEtb26.ui’, self)
…
…
self.im1 = pg.ImageItem(img,levels=[0, 255])
self.histWindow = self.findChild(PlotWidget, ‘wu’)
self.histWindow.setImageItem(self.im1)
but the only thing I get is an empty plot!
Thank you for your time.
You received this message because you are subscribed to the Google Groups "pyqtgraph" group.


To unsubscribe from this group and stop receiving emails from it, send an email to pyqt...@googlegroups.com.
pilkrow slash

Τη Πέμπτη, 23 Ιουλίου 2020 - 5:58:15 μ.μ. UTC+3, ο χρήστης pilkrow slash έγραψε:
Erik Johansson
To unsubscribe from this group and stop receiving emails from it, send an email to pyqtgraph+...@googlegroups.com.
To view this discussion on the web visit https://groups.google.com/d/msgid/pyqtgraph/8da5b793-4558-4573-9e09-187ab3e49d4eo%40googlegroups.com.
************************************************
Erik Johansson
Project Manager, Wavefront Correction System
National Solar Observatory
Daniel K Inouye Solar Telescope
3665 Discovery Drive, Boulder, CO 80303
Tel: 303-735-7723
************************************************
pilkrow slash

To view this discussion on the web visit https://groups.google.com/d/msgid/pyqtgraph/8da5b793-4558-4573-9e09-187ab3e49d4eo%40googlegroups.com.
Erik Johansson
To unsubscribe from this group and stop receiving emails from it, send an email to pyqtgraph+...@googlegroups.com.
To view this discussion on the web visit https://groups.google.com/d/msgid/pyqtgraph/30bc5893-90a1-4425-820a-dc0c84f7f45do%40googlegroups.com.
Erik Johansson
>>>
pilkrow slash

Erik Johansson
--
You received this message because you are subscribed to the Google Groups "pyqtgraph" group.
To unsubscribe from this group and stop receiving emails from it, send an email to pyqtgraph+...@googlegroups.com.
To view this discussion on the web visit https://groups.google.com/d/msgid/pyqtgraph/4e6e3c27-bdf8-490f-bab2-522cad846661o%40googlegroups.com.

Jim Crowell
Enter code here...    layout = QtGui.QGridLayout()
    widget.setLayout(layout)
    layout.setSpacing(0)

    widget.plotView = pg.GraphicsView()
    layout.addWidget(widget.plotView, 0, 0, 1, 1)

    widget.plotItem = pg.PlotItem()
    widget.plotItem.setAspectLocked()
    widget.plotItem.resize = widget.resize

    for axis in ("left", "bottom", "top", "right"):
        widget.plotItem.showAxis(axis, False)

    widget.plotView.setCentralItem(widget.plotItem)

    widget.histogramItem = pg.HistogramLUTItem(image=image_item)

    widget.plotItem.addItem(widget.histogramItem)
On Thursday, July 23, 2020 at 12:37:51 PM UTC-4, Erik J wrote:
Hello,I have done this a few times. To make it work, I use a QWidget for the histogram display which I then promote to a pyqtgraph HistogramLutWidget. Try changing your QGraphics widget to be a QWidget then promote it to a HistogramLUTWidget. I think if you do that the rest should work fine.Regards,Erik
On Thu, Jul 23, 2020 at 8:58 AM pilkrow slash <pilkro...@gmail.com> wrote:
Hello, I have little experience about pyqtgraph and sometimes simple things look difficult.--What I'm looking for is to display a histogramLUT widget into a gui created using qt Designer.I import the .ui file but I don't know how I can insert it into my code and connect it with an imageItem.
class MainWindow(QMainWindow, ProcessDicom):
…
…
uic.loadUi(‘CEtb26.ui’, self)
…
…
self.im1 = pg.ImageItem(img,levels=[0, 255])
self.histWindow = self.findChild(PlotWidget, ‘wu’)
self.histWindow.setImageItem(self.im1)
but the only thing I get is an empty plot!
Thank you for your time.
You received this message because you are subscribed to the Google Groups "pyqtgraph" group.
To unsubscribe from this group and stop receiving emails from it, send an email to pyqt...@googlegroups.com.