Pyqtgraph with QML

Papee
Could anyone point me to a simple example where we can use pyqtgraph inside a QML generated window?
Thanks in advance - papee

Luke Campagnola
-- [ You are subscribed to pyqt...@googlegroups.com. To unsubscribe, send email to pyqtgraph+...@googlegroups.com ]
Papee
Luke,
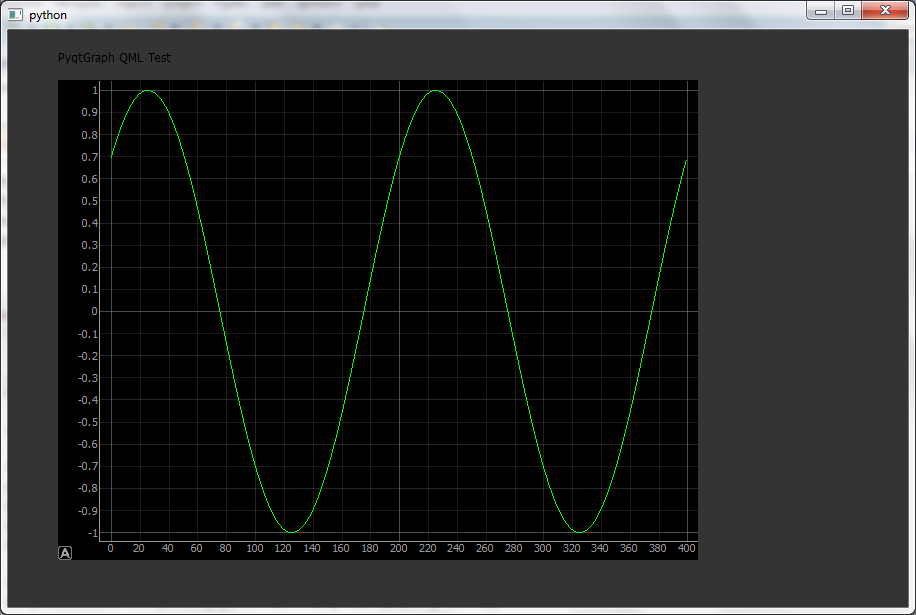
I have raised a question regarding pyqtgraph and qml in stackoverflow http://stackoverflow.com/questions/13240066/graph-pyqtgrapg-is-not-getting-plotted-inside-qml-generated-window . I got the graph window but no plotting. If you have any suggestion please reply.
regards ,
--afilash
Luke Campagnola
Luke,
I have raised a question regarding pyqtgraph and qml in stackoverflow http://stackoverflow.com/questions/13240066/graph-pyqtgrapg-is-not-getting-plotted-inside-qml-generated-window . I got the graph window but no plotting. If you have any suggestion please reply.
My best guess is that the problem is related to this bug:
Papee
Papee
#! /usr/bin/python
'''
Created on 03-Nov-2012
@author: Afilash
Main.py : Executable for creating application GUI
Created with QML, Having custom QtDeclarative
item to show a pyqtgraph inside a QGraphicsProxyWidget
( PySide specific 'Python version 2.7.3')
Do comment the 'itemChange' method in pyqtgraph/graphicsItems/GraphicsObject.py
as suggested by Luke, then only this will work.
'''
__credits__ =['afilash' , 'Luke Campagnola for bugfix']
__version__ = 'V1.0'
import os
import sys
from PySide import QtGui #'PySide version 1.1.2'
from PySide import QtCore #'setuptools version 0.6c11'
from PySide import QtDeclarative
import numpy as np #'numpy version 1.7.0b2' , 'scipy version 0.11.0'
import pyqtgraph as pg #'pyqtgraph REVISION 218'
class Graph (QtDeclarative.QDeclarativeItem):
""" This is where we are actually creating the graphics widget to show inside QML window"""
def __init__(self, parent = None):
QtDeclarative.QDeclarativeItem.__init__(self, parent)
self.setFlag(QtGui.QGraphicsItem.ItemHasNoContents, False )
#----------------------------------- only required for moving Sine Graph
self.framelength = 400
self.flowwindow = 2
self.index =0
self.indexmax = (1000 - self.framelength) / self.flowwindow
#----------------------------------- Data points for the sine wave graph
self.dataPlot = np.cos(np.linspace(0, 10*np.pi , 1000))
#-------------------------- Creating PlotItem for pyqtgraph-GraphicsView
self.graph = pg.PlotItem()
#------------------------------------ supplying datapoints for the graph
self.graph.plot( self.dataPlot, pen=(0,255,0))
#------------------------------------------------------ Back ground grid
self.graph.showGrid(x=True, y=True)
#-------------------------------------------- Actual pyqtgraph view item
self.view = pg.GraphicsView()
#------------------- Putting our previously created Graph into View Item
self.view.setCentralItem(self.graph)
#-------------- Since there is no main window as in PyQt we are creating
#-------------------------------------- a GraphicsProxyWidget inisde QML
#------------------ and then putting our View item into the Proxy Widget
mProxy = QtGui.QGraphicsProxyWidget(self)
mProxy.setWidget(self.view)
#-------------------------------- Just required for the moving sine wave
self.timer = QtCore.QTimer()
self.timer.timeout.connect(self.UpdatePlotData)
self.timer.start(50)
#-------------------------------- Just required for the moving sine wave
def UpdatePlotData(self):
self.index += 1
if (self.indexmax == self.index):
self.index = 0
self.graph.clear()
self.graph.plot(self.dataPlot[ self.index * self.flowwindow : self.framelength + self.index * self.flowwindow], pen=(0,255,0) , clear=True)
if __name__ == '__main__':
#---------------------------------------------- Creating a QtGui application
app = QtGui.QApplication(sys.argv)
#--------------- Here is our custom graph item, which is imported inside QML
QtDeclarative.qmlRegisterType(Graph, 'myPyQtGraph', 1, 0, 'PyQtGraph')
#--------------------------------------- Generating the view based on our QML
view = QtDeclarative.QDeclarativeView()
view.setSource(QtCore.QUrl('main.qml'))
view.setResizeMode(QtDeclarative.QDeclarativeView.SizeRootObjectToView)
#------------------ only required if you want to communicate with QML window
rootObject = view.rootObject()
#---------------------------------------------------- connecting quit signal
view.connect(view.engine() , QtCore.SIGNAL('quit()') ,app.instance( ) , QtCore.SLOT('quit()') )
#----------------------------------------------------------- Show the window
view.show()
#------------------------- Exit the python program when application finishes
sys.exit(app.exec_())
This is my main.qml:
import QtQuick 1.1
import myPyQtGraph 1.0
Rectangle {
id : page
width: 900
height: 400
color: "#343434"
PyQtGraph {
id: angleGraphID
anchors{
top: parent.top
left: parent.left
topMargin: 50
leftMargin: 50
}
width: 800
height: 300
//color: "#f5deb3"
}
Text {
id: text_Heading
anchors{
top: parent.top
left: parent.left
topMargin: 20
leftMargin: 50
}
text: qsTr("PyqtGraph QML Test")
font.pixelSize: 12
}
}
Papee
Hi Luke,
When running the above program , Memory is getting eaten up.
It is slowly getting increasing. If we leave the program like that I think the
system will purge it. Any solution ?
Luke Campagnola
Hi Luke,
When running the above program , Memory is getting eaten up. It is slowly getting increasing. If we leave the program like that I think the system will purge it. Any solution ?
Then you'll get a console you can do some testing from (this is necessary because PySide still blocks the Python interactive prompt). In the console, I ran this code:import pyqtgraph.console as conc = con.ConsoleWidget()c.show()
import __main__graph = __main__.rootObject.children()[0]## run updates many times to get the memory profile 'settled'for i in range(500):graph.UpdatePlotData()QtGui.QApplication.processEvents()## take a snapshot of all python objects, then run again## see help(pg.debug.ObjTracker) for more information on how this works.ot = pg.debug.ObjTracker()for i in range(500):graph.UpdatePlotData()QtGui.QApplication.processEvents()## take a second snapshot, run againot.diff()for i in range(500):graph.UpdatePlotData()QtGui.QApplication.processEvents()## and take a third snapshot. This will give you a list of 'persistent'## objects--those that were created between the first and second snapshots,## but were not re-collected by the third snapshot.ot.diff()
So only 116 'persistent' objects are present in this test, none of which are large objects like arrays, graphics items, etc.----------- 116 Created since start (persistent): ------------
1 504 <type 'unicode'>
87 1566 <type 'long'>
28 12208 <type 'type'>