Recursive step

Aaron MacNeil
# Lognormal distribution of P's
Pmean0 = 0.
P_0 = Lognormal('P_0', mu=Pmean0, tau=isigma2, trace=False, value=P_inits[0])
P = [P_0]
# Recursive step
for i in range(1,nyears):
Pmean = Lambda("Pmean", lambda P=P[i-1], k=k, r=r: log(max(P+r*P*(1-P)-k*catch[i-1],0.01)))
Pi = Lognormal('P_%i'%i, mu=Pmean, tau=isigma2, value=P_inits[i], trace=False)
P.append(Pi)
I've wanted to speed this up for a while as this looping is tremendously slow, but I'm having difficulty thinking how it might be done. Ideas?
Thanks much,
Aaron.

Flavio Coelho
One possibility is to look into the multiprocessing module. As most CPUs nowadays are at least dual core, you can cut you time in (at least) half, by creating a pool of processes, turning you loop into a function which you call using map, and passing range(1,nyears) as argument. The documentation has examples that you can easily adapt to your code.
it would look somewhat like this:
P=Pool()
def your_loop_core(i):
....
P.map(your_loop_core, range(1,nyears))
P.join()
P.close()
regards,
Flávio Codeço Coelho
================


--
You received this message because you are subscribed to the Google Groups "PyMC" group.
To post to this group, send email to py...@googlegroups.com.
To unsubscribe from this group, send email to pymc+uns...@googlegroups.com.
For more options, visit this group at http://groups.google.com/group/pymc?hl=en.

Chris Fonnesbeck

M. Aaron MacNeil
Thanks,
A.

David Huard
> It is distinctly faster, but also distinctly bad at converging - in fact it spirals out of control. The Metropolis steps converge on the known values. This is in line with my general experience with AdaptiveMetropolis - often if something isn't converging well, a forced Metropolis will solve the problem. Why might this be?
>
The AdaptiveMetropolis sampler performance hinges on a lot of
parameters being set correctly. We tried to make it as simple to use
as possible by setting a lot of parameters by defaults, but those
defaults regularly lead to convergence problems. Maybe one solution
would be to never assign AdaptiveMetropolis as the default sampler and
remove its default parameters. Users would need to work out by
themselves what parameter settings work best.
More fundamentally, the main issue with AM is finding the jump
covariance matrix. This covariance is computed from the last N steps,
hence the "adaptive". If for one reason or another this covariance is
problematic, chances are the next samples won't be good, leading to an
equally problematic update of the covariance. Conclusion is, you need
to start the AM sampler in the right track and make sure it stays in
the right track all along. I don't know if its possible to find a set
of parameters that provide those conditions for all problems. Maybe
not.
One thing that is already implemented and could help is using a past
trace to compute the initial covariance matrix. The strategy is to use
Metropolis on individual parameters for a while, then switch to AM to
speed things up, using the first trace to get a good initial
covariance. Maybe the AM sampler should do this by default.
David
Seth Flaxman
Roban Hultman Kramer
I don't have any insight into setting up initial covariance matrices,
but I've written some code to help graphically diagnose
AdaptiveMetropolis runs that you might find useful.
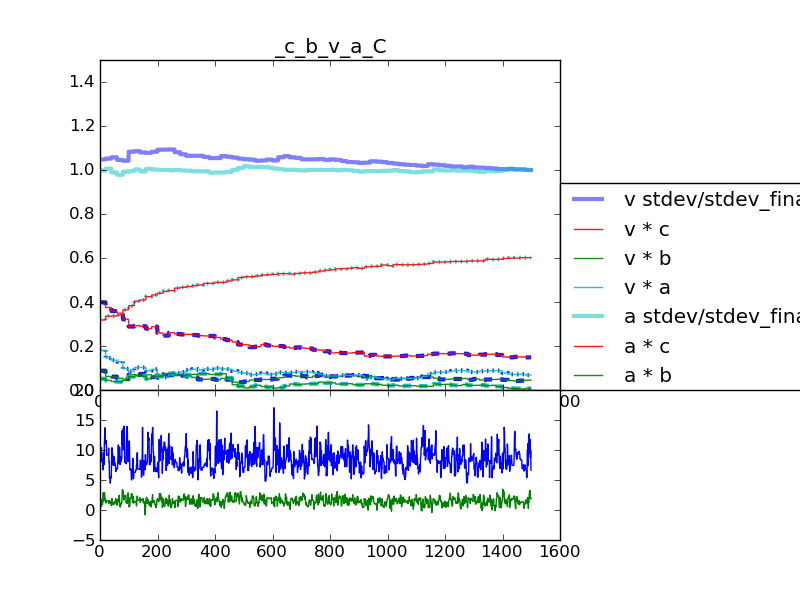
It's the plot_AM_correlation function in this module:
https://gist.github.com/793136
Direct link to the module file:
https://gist.github.com/raw/793136/0213c54789ae30c84b7e13947e3921c50ee9c632/plot2Ddist.py
Direct link to example script:
https://gist.github.com/raw/793136/7b6168ca4beb50e5d7f6a4100b580a5ea3eb38e9/plot2Ddist_example.py
Running the example script will produce a few plots (on screen). The
last plot is an example of plot_AM_correlation, showing the
correlations between variables calculated from the trace of the
Adaptive Metropolis proposal covariance matrix. Attached is an example
plot.
What you want to see: The variances (square root of the variance is
shown by the thick lines in the top panel) and covariances (or rather
correlations, shown by the other lines in the top panel) should look
like they converged to their final values early on. Any large
oscillations indicate unstable behavior in the algorithm. For
instance, if you have set shrink_if_necessary=True, and you continue
to see large drops in the variance, it indicates that few jumps are
getting accepted for some reason, and the algorithm keeps shrinking
the variance to try to increase the acceptance ratio.
Let me know if you have trouble running the example or applying it to
your own code, and feel free to email plots for help interpreting the
results.
-Roban
David Huard
This looks like a neat tool. Thanks for sharing it.
Seth,
Certainly others can chime in on this, but the acceptability of the
acceptance rate will depend on the dimension of the space you are
sampling from. In 1D, we usually target a 30%, 40% acceptance rate. As
you increase the dimensionality of the problem, that figure will
usually become lower. In my experience, problems occur when there are
less than ~3% jumps accepted during one update iteration of the
covariance.
As for the initial covariance matrix, certainly you can make a guess
about the expected value of the parameters you are sampling and a
rough estimate of their variance. Use the AM method `cov_from_scales`
to transform these guesses into a covariance matrix.
If users continue to share their experience about what works and what
doesn't, I'm hopeful we'll eventually find a strategy that works most
of the time and can be set as the default.
David
Chris Fonnesbeck
current development branch, so PyMC should not be selecting this step
method automatically for any model; it needs to be chosen manually.
It would certainly be useful for this sort of feedback to be formally
incorporated into the StepMethod. It shouldn't be too hard, for
example, to automate the switch from Metropolis to AdaptiveMetropolis
during the course of an MCMC run. The key will be coming up with
intelligent rules about when to pull the trigger.
In the meantime, to help Amac get some results (which was the initial
question in this thread), I am going to try to work up the surplus
example using the TWalk algorithm, which should improve the
performance significantly. Its in the sandbox now, and just needs to
be set up to work with containers properly.
cf

A. Flaxman
I was inspired by this discussion to do some experiments (and make some movies!) about when AM works and don't work. You can see the results here: http://healthyalgorithms.wordpress.com/2011/01/28/mcmc-in-python-pymc-step-methods-and-their-pitfalls
--Abie
cf

Thomas Wiecki
these look great and are really helpful! It would also be interesting
to read _why_ these samplers have these problems and show this type of
behavior in the scenarios you give. But maybe that's beyond the scope
of your post and requires more background knowledge on Metropolis.
-Thomas